

The DOI matches its Crossref record; 41 of the 41 references it cites were found in a registry or an index.
NetBID2 provides comprehensive hidden driver analysis
Open accessPublished version of a preprint
Abstract
Many signaling and other genes known as “hidden” drivers may not be genetically or epigenetically altered or differentially expressed at the mRNA or protein levels, but, rather, drive a phenotype such as tumorigenesis via post-translational modification or other mechanisms. However, conventional approaches based on genomics or differential expression are limited in exposing such hidden drivers. Here, we present a comprehensive algorithm and toolkit NetBID2 (data-driven network-based Bayesian inference of drivers, version 2), which reverse-engineers context-specific interactomes and integrates network activity inferred from large-scale multi-omics data, empowering the identification of hidden drivers that could not be detected by traditional analyses. NetBID2 has substantially re-engineered the previous prototype version by providing versatile data visualization and sophisticated statistical analyses, which strongly facilitate researchers for result interpretation through end-to-end multi-omics data analysis. We demonstrate the power of NetBID2 using three hidden driver examples. We deploy NetBID2 Viewer, Runner, and Cloud apps with 145 context-specific gene regulatory and signaling networks across normal tissues and paediatric and adult cancers to facilitate end-to-end analysis, real-time interactive visualization and cloud-based data sharing. NetBID2 is freely available at https://jyyulab.github.io/NetBID .
Overview
The claims and statistics of this paper haven’t been checked yet.
Free: it reads the open-access text and checks the first 5 claims that cite a source we can check. Create a free account to check every claim.
Integrity signals
Registry
Cites
Statistics
Figures


Verification
Claims the paper makes
The claims and statistics of this paper haven’t been checked yet.
Free: it reads the open-access text and checks the first 5 claims that cite a source we can check. Create a free account to check every claim.
Claims other papers make about this one
Each is checked against this paper’s own text: does it say what the citing paper says it does?
The check wasn’t confident either way, so it gives no verdict — never disputed.
In the citing paper
“Gene Regulatory Networks (GRNs), which try to illustrate the reciprocal interactions of genes and their targets (regulons), are an essential facet of biological networks and can be used in perturbational modelling as priors to facilitate more plausible predictions [4], [43].”
From A mini-review on perturbation modelling across single-cell omic modalities (2024) · cites this paper as [43]
Experimental — accuracy not yet measured
Self-check
Percentages, sums and reported differences re-computed from the paper’s own numbers.
The self-check needs the paper’s full text.
Citations
Cites
An integrated encyclopedia of DNA elements in the human genome
The ENCODE Project Consortium (2012) · Nature · doi:10.1038/nature11247 · Cited by 18,072
Comprehensive molecular profiling of lung adenocarcinoma
The Cancer Genome Atlas Research Network (2014) · Nature · doi:10.1038/nature13385 · Cited by 5,732
Self-citationThe Genotype-Tissue Expression (GTEx) pilot analysis: Multitissue gene regulation in humans
The GTEx Consortium, Ardlie, K. G., Deluca, D. S., Segrè, A. V., Sullivan, T. J., Young, T. R., Gelfand, E. T., Trowbridge, C. A., Maller, J. B., Tukiainen, T., et al. (2015) · Science · doi:10.1126/science.1262110 · Cited by 5,062
Self-citationComing of age: ten years of next-generation sequencing technologies
Goodwin, S., McPherson, J. D., & McCombie, W. R. (2016) · Nature Reviews Genetics · doi:10.1038/nrg.2016.49 · Cited by 4,352
Review The Cancer Genome Atlas (TCGA): an immeasurable source of knowledge
Tomczak, K., Czerwińska, P., & Wiznerowicz, M. (2015) · Współczesna Onkologia · doi:10.5114/wo.2014.47136 · Cited by 3,492
A comprehensive map of molecular drug targets
Santos, R., Ursu, O., Gaulton, A., Bento, A. P., Donadi, R. S., Bologa, C. G., Karlsson, A., Al-Lazikani, B., Hersey, A., Oprea, T. I., et al. (2017) · Nature Reviews Drug Discovery · doi:10.1038/nrd.2016.230 · Cited by 2,427
The transcription factor Myc controls metabolic reprogramming upon T lymphocyte activation
Wang, R., Dillon, C. P., Shi, L. Z., Milasta, S., Carter, R., Finkelstein, D., McCormick, L. L., Fitzgerald, P., Chi, H., Munger, J., et al. (2011) · Immunity · doi:10.1016/j.immuni.2011.09.021 · Cited by 2,140 · cited 1×
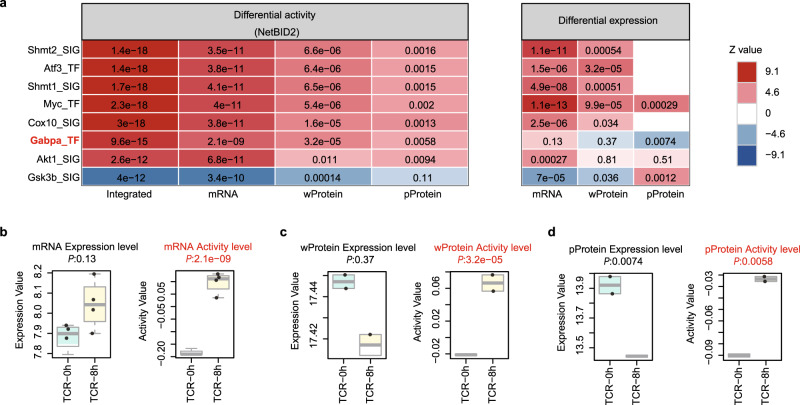
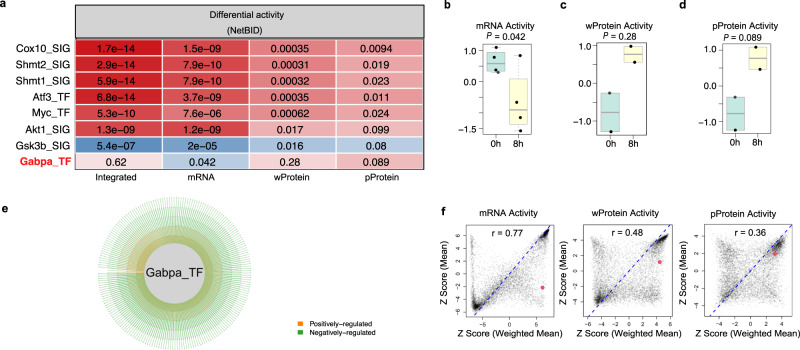
“To evaluate the performance of NetBID2, we curated eight positive con-trol drivers ( Cox10 , Shmt1 , Shmt2 , Myc , Atf3 , Gabpa , Akt1 , and Gsk3b ) that had previously been identi fi ed with experimental validations 31 – 35 (Table S2).”
Self-citationTargetable Kinase-Activating Lesions in Ph-like Acute Lymphoblastic Leukemia
Roberts, K. G., Li, Y., Payne-Turner, D., Harvey, R. C., Yang, Y.-L., Pei, D., McCastlain, K., Ding, L., Lu, C., Song, G., et al. (2014) · New England Journal of Medicine · doi:10.1056/nejmoa1403088 · Cited by 1,377
Self-citationAshley, E. A. (2016) · Nature Reviews Genetics · doi:10.1038/nrg.2016.86 · Cited by 1,116 · cited 1×
“Current targeted therapies against signaling drivers for cancer treatment rely primarily on gene mutations 6 ; however, actionable mutations are present in less than 25% of human and proteomics data 19 .”
Alvarez, M. J., Shen, Y., Giorgi, F. M., Lachmann, A., Ding, B. B., Ye, B. H., & Califano, A. (2016) · Nature Genetics · doi:10.1038/ng.3593 · Cited by 966
Research works printed but not linked: 2
- Mundi, P. S. et al. A transcriptome-based precision oncology platform for patient-therapy alignment in a diverse set of treatment resistant malignancies. Cancer Discov. https://doi.org/10.1158/2159-8290.CD-22-1020 (2023). · doi:10.1158/2159-8290.cd-22-1020 · Paper page
- Du, X. et al. Hippo/Mst signalling couples metabolic state and immune function of CD8α+ dendritic cells. Nature 558, 141–145 (2018). · DOI · Paper page
Cited by
CXCR6 orchestrates brain CD8+ T cell residency and limits mouse Alzheimer’s disease pathology
Su, W., Saravia, J., Risch, I., Rankin, S., Guy, C., Chapman, N. M., Shi, H., Sun, Y., KC, A., Li, W., et al. (2023) · Nature Immunology · doi:10.1038/s41590-023-01604-z · Cited by 205
Self-citationA mini-review on perturbation modelling across single-cell omic modalities
Gavriilidis, G. I., Vasileiou, V., Orfanou, A., Ishaque, N., & Psomopoulos, F. (2024) · Computational and Structural Biotechnology Journal · doi:10.1016/j.csbj.2024.04.058 · Cited by 54
Metabolic rewiring and communication in cancer immunity
Chapman, N. M., & Chi, H. (2024) · Cell chemical biology · doi:10.1016/j.chembiol.2024.02.001 · Cited by 48
Self-citationSpotiphy enables single-cell spatial whole transcriptomics across an entire section
Yang, J., Zheng, Z., Jiao, Y., Yu, K., Bhatara, S., Yang, X., Natarajan, S., Zhang, J., Pan, Q., Easton, J. B., et al. (2025) · Nature Methods · doi:10.1038/s41592-025-02622-5 · Cited by 53
Self-citationHuang, X., Li, Y., Zhang, J., Yan, L., Zhao, H., Ding, L., Bhatara, S., Yang, X., Yoshimura, S., Yang, W., et al. (2024) · Cancer Cell · doi:10.1016/j.ccell.2024.03.003 · Cited by 53
Self-citation
Metadata
- Authors
- Dong, X., Ding, L., Thrasher, A., Wang, X., Liu, J., Pan, Q., Rash, J., Dhungana, Y., Yang, X., Risch, I., Li, Y., Yan, L., Rusch, M., McLeod, C., Yan, K.-K., Peng, J., Chi, H., Zhang, J., & Yu, J.
- Affiliations
- St. Jude Children's Research Hospital (US)
- Corresponding author
- Yu, Jiyang
- ORCID
- Venue
- Nature Communications
- Published
- 2023-05-04
- Volume
- 14
- Issue
- 1
- Pages
- 2581-2581
- ISSN
- 2041-1723 (ISSN-L)
- PMC
- PMC10160099
- OpenAlex
- W4368364228
- Cited by
- 37
- References
- 41
- Citations by year
- 2026: 14 · 2025: 14 · 2024: 6 · 2023: 3
- FWCI
- 3.29
- Type
- journal article
- Language
- en
- Open access
- gold
- doi.org
- Licence
- cc-by
- creativecommons.org/licenses/by/4.0 (tdm)
- creativecommons.org/licenses/by/4.0 (vor)
- Locations
- Nature Communications (publishedVersion, cc-by)
- Research Square (acceptedVersion, cc-by)
- PubMed Central (publishedVersion, cc-by)
- PubMed (publishedVersion)
- RePEc: Research Papers in Economics (submittedVersion)
- DOAJ (DOAJ: Directory of Open Access Journals) (submittedVersion, cc-by-sa)
- Zenodo (CERN European Organization for Nuclear Research) (cc-by)
- Funders
- American Lebanese Syrian Associated Charities (P30CA021765)
- National Institutes of Health
- National Cancer Institute (R25CA023944, U01CA264610, P30CA021765)
- National Institute of General Medical Sciences (R01GM134382)
- Topics
- Life Sciences › Biochemistry, Genetics and Molecular Biology › Molecular Biology › Bioinformatics and Genomic Networks
- Life Sciences › Biochemistry, Genetics and Molecular Biology › Molecular Biology › Gene Regulatory Network Analysis
- Life Sciences › Biochemistry, Genetics and Molecular Biology › Cancer Research › Cancer Genomics and Diagnostics
- Keywords
- driver identification, multi-omics integration, gene regulatory networks, signaling networks, post-translational modification, carcinogenesis, cancer, childhood cancer, interactive visualization, cloud-based data sharing
- MeSH terms
- Algorithms, Bayes Theorem, Cell Transformation, Neoplastic, Humans, Research Design, Software, Genomics
About these checks
Registry, retraction, Cites and statistics results are computed, not judged, with one exception: a printed reference that no index lists is read once by a model before it counts as a citation error. Claims are extracted by a model and kept only when their quote appears verbatim in the text; each cited source is then checked, with a model’s help, for whether it says what the claim relies on. Those verdicts can be wrong — read the claim’s quote and the cited source before relying on one.
Statistics and arithmetic are recomputed, not judged.
Confidence bands are shown only for fields calibrated on our annotated test set. None is calibrated yet, so no band is shown.
What counts as a claim ›How we measure confidence ›How we check this ›
Are you an author, or do you see a problem with this page? Request a review
How to cite
Cite CoChat for the checks on this page, and the paper for its own findings.
- This page
- CoChat. (2026). Citation check: NetBID2 provides comprehensive hidden driver analysis. https://app.cochat.ai/papers/10.1038/s41467-023-38335-6
- The paper
- Dong, X., Ding, L., Thrasher, A., Wang, X., Liu, J., Pan, Q., Rash, J., Dhungana, Y., Yang, X., Risch, I., Li, Y., Yan, L., Rusch, M., McLeod, C., Yan, K.-K., Peng, J., Chi, H., Zhang, J., & Yu, J. (2023). NetBID2 provides comprehensive hidden driver analysis. Nature Communications. https://doi.org/10.1038/s41467-023-38335-6
Data sources
Bibliographic data: Semantic Scholar, OpenAlex, Crossref.
Contains information from the Semantic Scholar Academic Graph Datasets, made available under the ODC Attribution License (ODC-BY 1.0).
Semantic Scholar’s data is described in: Kinney, R., et al. (2023). The Semantic Scholar Open Data Platform. arXiv:2301.10140.
