Cited by 13Axon Guidance and Neuronal SignalingNerve injury and regenerationNeurogenesis and neuroplasticity mechanisms

The DOI matches its Crossref record; 1 of the 1 references it cites were found in a registry or an index.

Subcellular second messenger networks drive distinct repellent-induced axon behaviors

Open access

Published version of a preprint

Abstract

Second messengers, including cAMP, cGMP and Ca 2+ are often placed in an integrating position to combine the extracellular cues that orient growing axons in the developing brain. This view suggests that axon repellents share the same set of cellular messenger signals and that axon attractants evoke opposite cAMP, cGMP and Ca 2+ changes. Investigating the confinement of these second messengers in cellular nanodomains, we instead demonstrate that two repellent cues, ephrin-A5 and Slit1, induce spatially segregated signals. These guidance molecules activate subcellular-specific second messenger crosstalk, each signaling network controlling distinct axonal morphology changes in vitro and pathfinding decisions in vivo.

Overview

The claims and statistics of this paper haven’t been checked yet.

Run the check — free, no account needed. It reads the open-access text and checks the sources it cites.

A few free checks a day · papers already verified open instantly · results are public

Integrity signals

Registry

Crossref · 10.1038/s41467-023-39516-z

Cites

1 of 1 references verified0 citation errors · 0 not checkable

Statistics

Figures

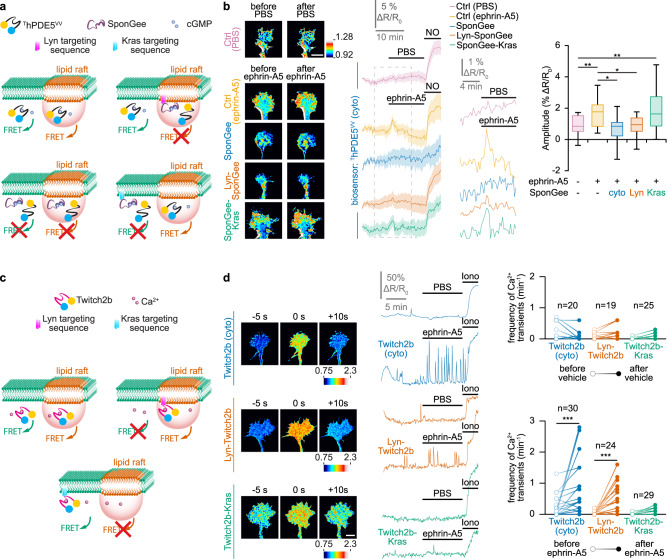
Fig. 1 Ephrin-A5 induces an elevation of cGMP and an increase in the frequency of Ca2+ transients in lipid rafts. a Strategy to identify the cGMP source. The cGMP biosensor ThPDE5VV is expressed in RGC axons alone (top left) or together with either the non-targeted cGMP scavenger SponGee (bottom left) or its lipid raft-targeted (Lyn-SponGee, top right) or -excluded (SponGee-Kras, bottom right) variants. When expressed alone, ThPDE5VV monitors cGMP from the entire cytoplasm. SponGee prevents the sensor to report changes in cGMP concentration. Lyn-SponGee or SponGee-Kras lead ThPDE5VV to monitor cGMP changes from all cellular compartments excluding the vicinity of either lipid rafts or the non-raft plasma membrane, respectively. b After ephrin-A5 exposure, ThPDE5VV alone or co-expressed with SponGee-Kras monitors a cGMP elevation. By contrast, when co-expressed with SponGee or Lyn-SponGee, the FRET signal is not affected by ephrin-A5, similarly to vehicle (PBS)-exposed axons. A nitric oxide (NO)-induced cGMP elevation at the end of each recording ensures biosensor functionality and axon viability. Right traces: magnification of the dashed line-enclosed portion of the left traces. Image color-code: from low cGMP (blue) to high cGMP (red/white). Traces: mean ± s.e.m. Box-and-whisker plot elements: median, upper and lower quartiles, 10th and 90th percentiles. *P < 0.05; **P < 0.01; Kruskal–Wallis test followed by Dunn’s post-hoc test. Scale bar, 10 µm. c Strategy to identify local changes in Ca2+ concentration. The Ca2+ sensor Twitch2b (top left), its lipid raft-targeted (top right) or -excluded (bottom) variants are expressed in RGCs. They report Ca2+ changes from all cytosolic sources, lipid rafts and the non-raft fraction of the plasma membrane, respectively. d An elevation in the Ca2+ transient frequency is detected by Twitch2b after ephrin-A5 but not after vehicle (PBS) exposure. This observation is reproduced with the lipid raft-targeted Twitch2b, but not when using its lipid raft-excluded equivalent. An ionomycin (iono)-induced Ca2+ elevation at the end of each recording ensures biosensor functionality and axon viability. Images illustrate a detected Ca2+ transient. Color-code: from low Ca2+ (blue) to high Ca2+ (red/white). Representative traces and individual data points (n indicated on the graphs) are shown. *** P < 0.001; two-tailed Wilcoxon test. Scale bar, 10 µm. Source data, number of replicates and P values are provided as a Source Data file.
Fig. 1 Ephrin-A5 induces an elevation of cGMP and an increase in the frequency of Ca2+ transients in lipid rafts. a Strategy to identify the cGMP source. The cGMP biosensor ThPDE5VV is expressed in RGC axons alone (top left) or together with either the non-targeted cGMP scavenger SponGee (bottom left) or its lipid raft-targeted (Lyn-SponGee, top right) or -excluded (SponGee-Kras, bottom right) variants. When expressed alone, ThPDE5VV monitors cGMP from the entire cytoplasm. SponGee prevents the sensor to report changes in cGMP concentration. Lyn-SponGee or SponGee-Kras lead ThPDE5VV to monitor cGMP changes from all cellular compartments excluding the vicinity of either lipid rafts or the non-raft plasma membrane, respectively. b After ephrin-A5 exposure, ThPDE5VV alone or co-expressed with SponGee-Kras monitors a cGMP elevation. By contrast, when co-expressed with SponGee or Lyn-SponGee, the FRET signal is not affected by ephrin-A5, similarly to vehicle (PBS)-exposed axons. A nitric oxide (NO)-induced cGMP elevation at the end of each recording ensures biosensor functionality and axon viability. Right traces: magnification of the dashed line-enclosed portion of the left traces. Image color-code: from low cGMP (blue) to high cGMP (red/white). Traces: mean ± s.e.m. Box-and-whisker plot elements: median, upper and lower quartiles, 10th and 90th percentiles. *P < 0.05; **P < 0.01; Kruskal–Wallis test followed by Dunn’s post-hoc test. Scale bar, 10 µm. c Strategy to identify local changes in Ca2+ concentration. The Ca2+ sensor Twitch2b (top left), its lipid raft-targeted (top right) or -excluded (bottom) variants are expressed in RGCs. They report Ca2+ changes from all cytosolic sources, lipid rafts and the non-raft fraction of the plasma membrane, respectively. d An elevation in the Ca2+ transient frequency is detected by Twitch2b after ephrin-A5 but not after vehicle (PBS) exposure. This observation is reproduced with the lipid raft-targeted Twitch2b, but not when using its lipid raft-excluded equivalent. An ionomycin (iono)-induced Ca2+ elevation at the end of each recording ensures biosensor functionality and axon viability. Images illustrate a detected Ca2+ transient. Color-code: from low Ca2+ (blue) to high Ca2+ (red/white). Representative traces and individual data points (n indicated on the graphs) are shown. *** P < 0.001; two-tailed Wilcoxon test. Scale bar, 10 µm. Source data, number of replicates and P values are provided as a Source Data file.CC BY · PubMed Central
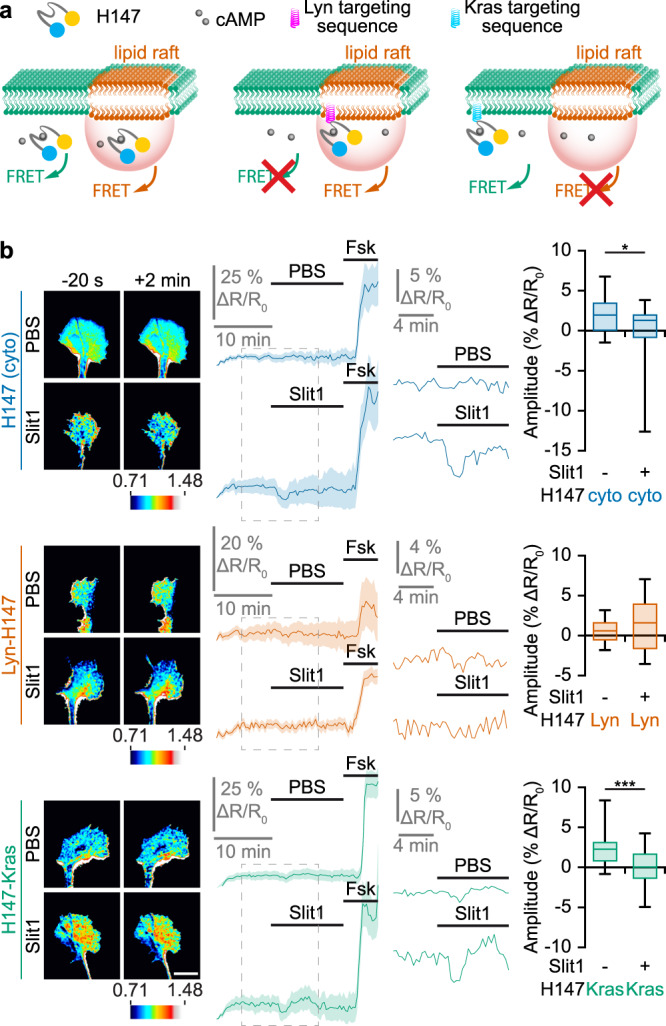
Fig. 2 Slit1 induces a cAMP reduction in the vicinity of the plasma membrane, outside lipid rafts. a Strategy to identify local changes in cAMP concentration. The cAMP FRET sensor H147 (left), its lipid raft-targeted (middle) or -excluded (right) variants are expressed in RGCs. They report cAMP changes from anywhere in the cytosol, from lipid rafts and from the non-raft fraction of the plasma membrane, respectively. b A reduction in the cAMP concentration is detected by the biosensor H147 after Slit1 exposure but not after vehicle (PBS) addition to the culture medium. This observation is reproduced with the lipid raft-excluded H147 (H147-Kras), but not when using its lipid raft-targeted equivalent (Lyn-H147). A forskolin (Fsk) stimulation leading to a cAMP elevation was achieved at the end of each recording to verify the functionality of the biosensor and the viability of the axon. The portion of the left traces enclosed in the dashed rectangles is shown magnified in the right part of the panel. Images illustrating the change in the FRET ratio between before (−20 s) and after (+2 min) the PBS or Slit1 stimulation are color-coded from low blue to high red/white. Traces: mean ± s.e.m. Box-and-whisker plot elements: median, upper and lower quartiles, 10th and 90th percentiles. *P < 0.05; ***P < 0.001; two-tailed Mann–Whitney test. Scale bar, 10 µm. Source data, number of replicates and P values are provided as a Source Data file.
Fig. 2 Slit1 induces a cAMP reduction in the vicinity of the plasma membrane, outside lipid rafts. a Strategy to identify local changes in cAMP concentration. The cAMP FRET sensor H147 (left), its lipid raft-targeted (middle) or -excluded (right) variants are expressed in RGCs. They report cAMP changes from anywhere in the cytosol, from lipid rafts and from the non-raft fraction of the plasma membrane, respectively. b A reduction in the cAMP concentration is detected by the biosensor H147 after Slit1 exposure but not after vehicle (PBS) addition to the culture medium. This observation is reproduced with the lipid raft-excluded H147 (H147-Kras), but not when using its lipid raft-targeted equivalent (Lyn-H147). A forskolin (Fsk) stimulation leading to a cAMP elevation was achieved at the end of each recording to verify the functionality of the biosensor and the viability of the axon. The portion of the left traces enclosed in the dashed rectangles is shown magnified in the right part of the panel. Images illustrating the change in the FRET ratio between before (−20 s) and after (+2 min) the PBS or Slit1 stimulation are color-coded from low blue to high red/white. Traces: mean ± s.e.m. Box-and-whisker plot elements: median, upper and lower quartiles, 10th and 90th percentiles. *P < 0.05; ***P < 0.001; two-tailed Mann–Whitney test. Scale bar, 10 µm. Source data, number of replicates and P values are provided as a Source Data file.CC BY · PubMed Central
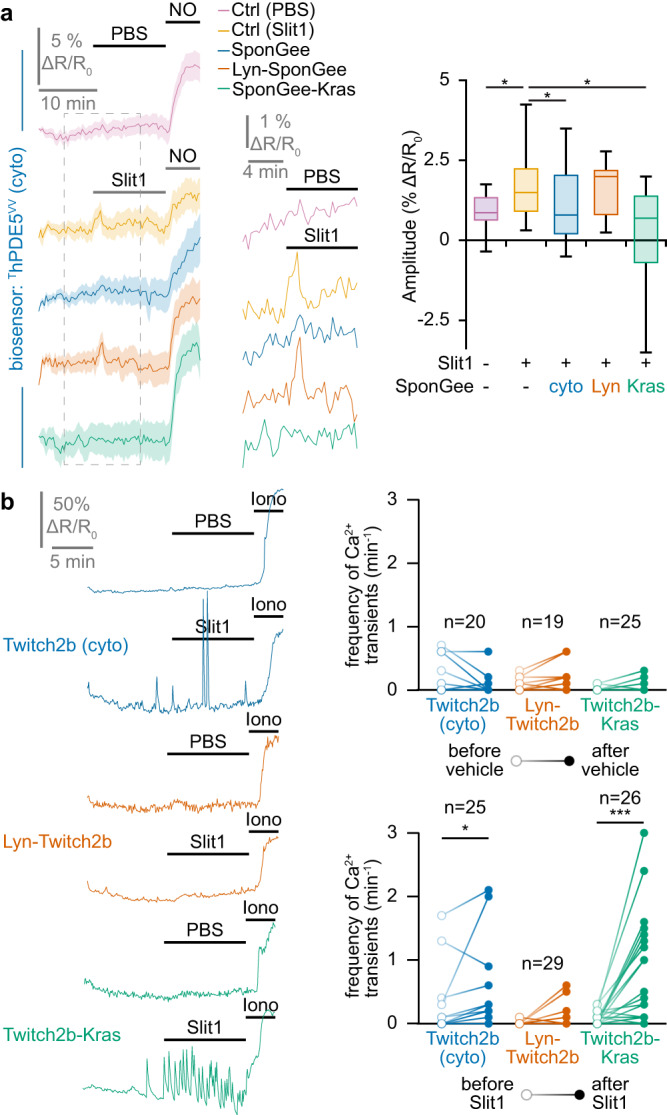
Fig. 3 Slit1 induces a cGMP elevation and an increase in the frequency of Ca2+ transients in the vicinity of the plasma membrane, outside lipid rafts. a When retinal axons are exposed to Slit1, ThPDE5VV alone or co-expressed with Lyn-SponGee monitors an elevation of cGMP. By contrast, when co-expressed with SponGee or SponGee-Kras, the FRET ratio is not affected by Slit1, similarly to axons that are not exposed to Slit1 and express ThPDE5VV. A nitric oxide (NO) stimulation leading to a cGMP elevation was achieved at the end of each recording to verify the functionality of the biosensor and the viability of the axon. The portion of the left traces enclosed in the dashed rectangles is shown magnified in the right part of the panel. Traces: mean ± s.e.m. Box-and-whisker plot elements: median, upper and lower quartiles, 10th and 90th percentiles. b An elevation in the frequency of Ca2+ transients is detected by Twitch2b after Slit1 exposure but not after vehicle (PBS) addition to the culture medium. This elevation is reproduced with the lipid raft-excluded Twitch2b, but not when using its lipid raft-excluded equivalent. An ionomycin (iono) stimulation leading to a Ca2+ elevation was achieved at the end of each recording to verify the functionality of the biosensor and the viability of the axon. Representative traces and individual data points are shown. The number of quantified axons is indicated on the graphs. a,b * P < 0.05; *** P < 0.001; a Kruskal–Wallis test followed by Dunn’s post-hoc test, b two-tailed paired Wilcoxon test. Source data, number of replicates and P values are provided as a Source Data file.
Fig. 3 Slit1 induces a cGMP elevation and an increase in the frequency of Ca2+ transients in the vicinity of the plasma membrane, outside lipid rafts. a When retinal axons are exposed to Slit1, ThPDE5VV alone or co-expressed with Lyn-SponGee monitors an elevation of cGMP. By contrast, when co-expressed with SponGee or SponGee-Kras, the FRET ratio is not affected by Slit1, similarly to axons that are not exposed to Slit1 and express ThPDE5VV. A nitric oxide (NO) stimulation leading to a cGMP elevation was achieved at the end of each recording to verify the functionality of the biosensor and the viability of the axon. The portion of the left traces enclosed in the dashed rectangles is shown magnified in the right part of the panel. Traces: mean ± s.e.m. Box-and-whisker plot elements: median, upper and lower quartiles, 10th and 90th percentiles. b An elevation in the frequency of Ca2+ transients is detected by Twitch2b after Slit1 exposure but not after vehicle (PBS) addition to the culture medium. This elevation is reproduced with the lipid raft-excluded Twitch2b, but not when using its lipid raft-excluded equivalent. An ionomycin (iono) stimulation leading to a Ca2+ elevation was achieved at the end of each recording to verify the functionality of the biosensor and the viability of the axon. Representative traces and individual data points are shown. The number of quantified axons is indicated on the graphs. a,b * P < 0.05; *** P < 0.001; a Kruskal–Wallis test followed by Dunn’s post-hoc test, b two-tailed paired Wilcoxon test. Source data, number of replicates and P values are provided as a Source Data file.CC BY · PubMed Central
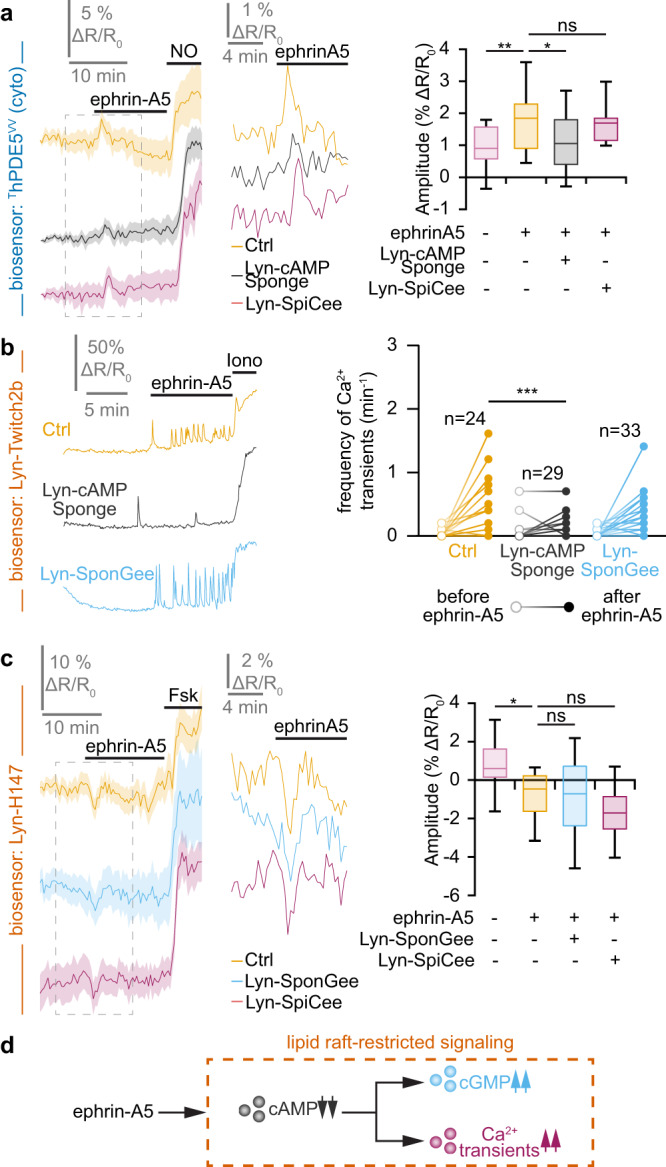
Fig. 4 Lipid raft-restricted second messenger network downstream of ephrin-A5. a The ephrin-A5-induced elevation of the cGMP concentration monitored using ThDPE5VV is reduced by preventing local cAMP signals in lipid rafts (Lyn-cAMP Sponge). By contrast, reducing Ca2+ downstream signaling in this cellular domain does not affect cGMP changes. A nitric oxide (NO) stimulation was achieved at the end of each recording to verify the functionality of the biosensor and the viability of the axon. b The ephrinA5-induced elevation in the Ca2+ transient frequency monitored by Lyn-Twitch2b was prevented by scavenging cAMP in lipid rafts (Lyn-cAMP Sponge), whereas altering the downstream signaling of cGMP in this subcellular domain did not impact the ephrin-A5-induced Ca2+ transients. An ionomycin (iono) stimulation was achieved at the end of each recording to verify the functionality of the biosensor and the viability of the axon. c The lipid raft-restricted cAMP signals induced by ephrin-A5 were monitored using Lyn-H147. The reduction in the cAMP concentration was not affected by preventing the cGMP or Ca2+ downstream signaling in the same cellular compartment using Lyn-SponGee and Lyn-SpiCee, respectively. A forskolin (Fsk) stimulation was achieved at the end of each recording to verify the functionality of the biosensor and the viability of the axon. d Overall model of the lipid raft-restricted second messenger network downstream of ephrin-A5. Exposing growth cones to this axon guidance molecule leads to a combined modulation of cyclic nucleotides and Ca2+ that is restricted to the vicinity of lipid rafts. This network is characterized by a non-reciprocal influence of cAMP on cGMP and Ca2+ signaling. a,c The portion of the left traces enclosed in the dashed rectangle in is shown magnified in the right part of the panel. Traces: mean ± s.e.m. Box-and-whisker plot elements: median, upper and lower quartiles, 10th and 90th percentiles. b Representative traces and individual data points are shown. The number of quantified axons is indicated on the graphs. a–c * P < 0.05; ** P < 0.01; *** P < 0.001; Kruskal–Wallis test followed by Dunn’s post-hoc test. Source data, number of replicates and P values are provided as a Source Data file.
Fig. 4 Lipid raft-restricted second messenger network downstream of ephrin-A5. a The ephrin-A5-induced elevation of the cGMP concentration monitored using ThDPE5VV is reduced by preventing local cAMP signals in lipid rafts (Lyn-cAMP Sponge). By contrast, reducing Ca2+ downstream signaling in this cellular domain does not affect cGMP changes. A nitric oxide (NO) stimulation was achieved at the end of each recording to verify the functionality of the biosensor and the viability of the axon. b The ephrinA5-induced elevation in the Ca2+ transient frequency monitored by Lyn-Twitch2b was prevented by scavenging cAMP in lipid rafts (Lyn-cAMP Sponge), whereas altering the downstream signaling of cGMP in this subcellular domain did not impact the ephrin-A5-induced Ca2+ transients. An ionomycin (iono) stimulation was achieved at the end of each recording to verify the functionality of the biosensor and the viability of the axon. c The lipid raft-restricted cAMP signals induced by ephrin-A5 were monitored using Lyn-H147. The reduction in the cAMP concentration was not affected by preventing the cGMP or Ca2+ downstream signaling in the same cellular compartment using Lyn-SponGee and Lyn-SpiCee, respectively. A forskolin (Fsk) stimulation was achieved at the end of each recording to verify the functionality of the biosensor and the viability of the axon. d Overall model of the lipid raft-restricted second messenger network downstream of ephrin-A5. Exposing growth cones to this axon guidance molecule leads to a combined modulation of cyclic nucleotides and Ca2+ that is restricted to the vicinity of lipid rafts. This network is characterized by a non-reciprocal influence of cAMP on cGMP and Ca2+ signaling. a,c The portion of the left traces enclosed in the dashed rectangle in is shown magnified in the right part of the panel. Traces: mean ± s.e.m. Box-and-whisker plot elements: median, upper and lower quartiles, 10th and 90th percentiles. b Representative traces and individual data points are shown. The number of quantified axons is indicated on the graphs. a–c * P < 0.05; ** P < 0.01; *** P < 0.001; Kruskal–Wallis test followed by Dunn’s post-hoc test. Source data, number of replicates and P values are provided as a Source Data file.CC BY · PubMed Central
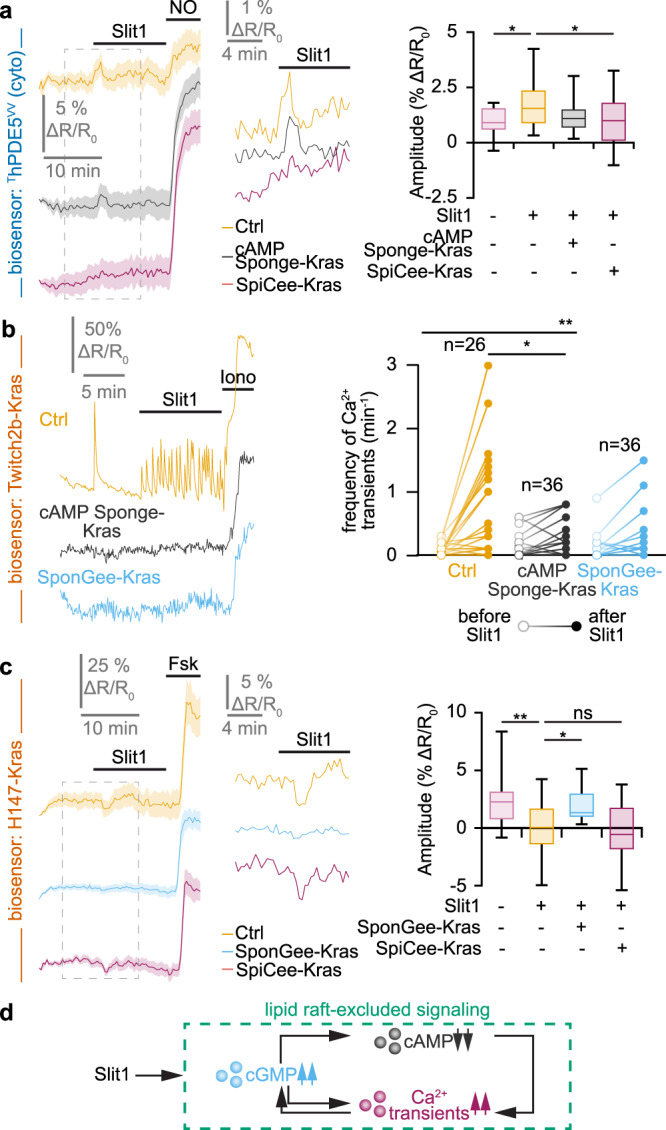
Fig. 5 Lipid raft-excluded second messenger network downstream of Slit1. a The Slit1-induced elevation in cGMP imaged using ThDPE5VV is prevented by the blockade of Ca2+ signaling next to the non-raft plasma membrane (SpiCee-Kras). By contrast, blocking cAMP signaling outside lipid rafts (cAMP Sponge-Kras) does not affect the Slit1-induced cGMP changes. A nitric oxide (NO) stimulation was achieved at the end of each recording to verify the biosensor functionality and the axon viability. b The elevation in the Ca2+ transient frequency induced by Slit1 outside lipid rafts and recorded using Twitch2b-Kras is prevented by scavenging either cAMP or cGMP outside lipid rafts (cAMP Sponge-Kras or SponGee-Kras, respectively). An ionomycin (iono) stimulation was achieved at the end of each recording to verify the biosensor functionality and the axon viability. c The juxta-membrane lipid raft-excluded cAMP signals induced by Slit1 were monitored using the biosensor H147-Kras. The reduction in the cAMP concentration is dampened by preventing cGMP downstream signaling in the same cellular compartment using SponGee-Kras, but not by reducing Ca2+ signaling with SpiCee-Kras. A forskolin (Fsk) stimulation was achieved at the end of each recording to verify the biosensor functionality and the axon viability. d Overall model of the juxta-membrane lipid raft-excluded second messenger network downstream of Slit1. Exposing growth cones to this axon guidance molecule leads to a combined modulation of cyclic nucleotides and Ca2+ that is restricted to the vicinity of the non-raft domain of the plasma membrane. This network is characterized by complex interactions including a cAMP influence on Ca2+, a control of cGMP elevation by Ca2+ transients and cGMP influencing both cAMP and Ca2+ signals. a,c The portion of the left traces enclosed in the dashed rectangle in is shown magnified in the right part of the panel. Traces: mean ± s.e.m. Box-and-whisker plot elements: median, upper and lower quartiles, 10th and 90th percentiles. b Representative traces and individual data points are shown. The number of quantified axons is indicated on the graphs. a–c * P < 0.05; ** P < 0.01; *** P < 0.001; Kruskal–Wallis test followed by Dunn’s post-hoc test. Source data, number of replicates and P values are provided as a Source Data file.
Fig. 5 Lipid raft-excluded second messenger network downstream of Slit1. a The Slit1-induced elevation in cGMP imaged using ThDPE5VV is prevented by the blockade of Ca2+ signaling next to the non-raft plasma membrane (SpiCee-Kras). By contrast, blocking cAMP signaling outside lipid rafts (cAMP Sponge-Kras) does not affect the Slit1-induced cGMP changes. A nitric oxide (NO) stimulation was achieved at the end of each recording to verify the biosensor functionality and the axon viability. b The elevation in the Ca2+ transient frequency induced by Slit1 outside lipid rafts and recorded using Twitch2b-Kras is prevented by scavenging either cAMP or cGMP outside lipid rafts (cAMP Sponge-Kras or SponGee-Kras, respectively). An ionomycin (iono) stimulation was achieved at the end of each recording to verify the biosensor functionality and the axon viability. c The juxta-membrane lipid raft-excluded cAMP signals induced by Slit1 were monitored using the biosensor H147-Kras. The reduction in the cAMP concentration is dampened by preventing cGMP downstream signaling in the same cellular compartment using SponGee-Kras, but not by reducing Ca2+ signaling with SpiCee-Kras. A forskolin (Fsk) stimulation was achieved at the end of each recording to verify the biosensor functionality and the axon viability. d Overall model of the juxta-membrane lipid raft-excluded second messenger network downstream of Slit1. Exposing growth cones to this axon guidance molecule leads to a combined modulation of cyclic nucleotides and Ca2+ that is restricted to the vicinity of the non-raft domain of the plasma membrane. This network is characterized by complex interactions including a cAMP influence on Ca2+, a control of cGMP elevation by Ca2+ transients and cGMP influencing both cAMP and Ca2+ signals. a,c The portion of the left traces enclosed in the dashed rectangle in is shown magnified in the right part of the panel. Traces: mean ± s.e.m. Box-and-whisker plot elements: median, upper and lower quartiles, 10th and 90th percentiles. b Representative traces and individual data points are shown. The number of quantified axons is indicated on the graphs. a–c * P < 0.05; ** P < 0.01; *** P < 0.001; Kruskal–Wallis test followed by Dunn’s post-hoc test. Source data, number of replicates and P values are provided as a Source Data file.CC BY · PubMed Central
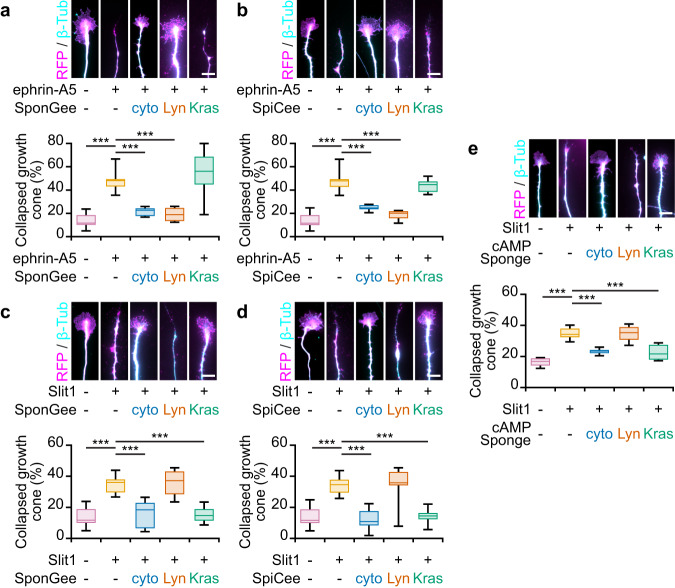
Fig. 6 Lipid raft-specific and -excluded scavenging of second messengers prevent the collapse of growth cones induced by ephrin-A5 and Slit−1, respectively. a Ephrin-A5 induces the collapse of mRFP- and SponGee-Kras-expressing axons, whereas the non-targeted and lipid-raft targeted variants of SponGee (Lyn-SponGee) prevent growth cone collapse. b When lacking a targeting sequence or when restricted to lipid rafts, SpiCee prevents the ephrin-A5-induced growth cone collapse, in contrast to the lipid raft-excluded variant of SpiCee (SpiCee-Kras). c Slit−1 induces the collapse of mRFP-expressing retinal growth cones. The proportion of collapsing axons is not affected by the expression of Lyn-SponGee but is reduced by SponGee-Kras or the cytosolic SponGee. d The collapse of retinal growth cones exposed to Slit−1 is reduced by the expression of SpiCee (not targeted) or its lipid raft-excluded variant (SpiCee-Kras), but not by Lyn-SpiCee. e Slit−1-induced growth cone collapse is prevented by cAMP Sponge or cAMP Sponge-Kras, but not by Lyn-cAMP-Sponge. Axons were immunolabeled with a βIII-tubulin and a Ds-Red (mRFP) antibody. The latter reports the expression of SponGee (a,c), SpiCee (b,d) or cAMP Sponge (e). Scale bars, 10 µm. Box-and-whisker plot elements: median, upper and lower quartiles, 10th and 90th percentiles. *** P < 0.001; One way ANOVA followed by Dunnett post-hoc test. Source data, number of replicates and P values are provided as a Source Data file.
Fig. 6 Lipid raft-specific and -excluded scavenging of second messengers prevent the collapse of growth cones induced by ephrin-A5 and Slit−1, respectively. a Ephrin-A5 induces the collapse of mRFP- and SponGee-Kras-expressing axons, whereas the non-targeted and lipid-raft targeted variants of SponGee (Lyn-SponGee) prevent growth cone collapse. b When lacking a targeting sequence or when restricted to lipid rafts, SpiCee prevents the ephrin-A5-induced growth cone collapse, in contrast to the lipid raft-excluded variant of SpiCee (SpiCee-Kras). c Slit−1 induces the collapse of mRFP-expressing retinal growth cones. The proportion of collapsing axons is not affected by the expression of Lyn-SponGee but is reduced by SponGee-Kras or the cytosolic SponGee. d The collapse of retinal growth cones exposed to Slit−1 is reduced by the expression of SpiCee (not targeted) or its lipid raft-excluded variant (SpiCee-Kras), but not by Lyn-SpiCee. e Slit−1-induced growth cone collapse is prevented by cAMP Sponge or cAMP Sponge-Kras, but not by Lyn-cAMP-Sponge. Axons were immunolabeled with a βIII-tubulin and a Ds-Red (mRFP) antibody. The latter reports the expression of SponGee (a,c), SpiCee (b,d) or cAMP Sponge (e). Scale bars, 10 µm. Box-and-whisker plot elements: median, upper and lower quartiles, 10th and 90th percentiles. *** P < 0.001; One way ANOVA followed by Dunnett post-hoc test. Source data, number of replicates and P values are provided as a Source Data file.CC BY · PubMed Central
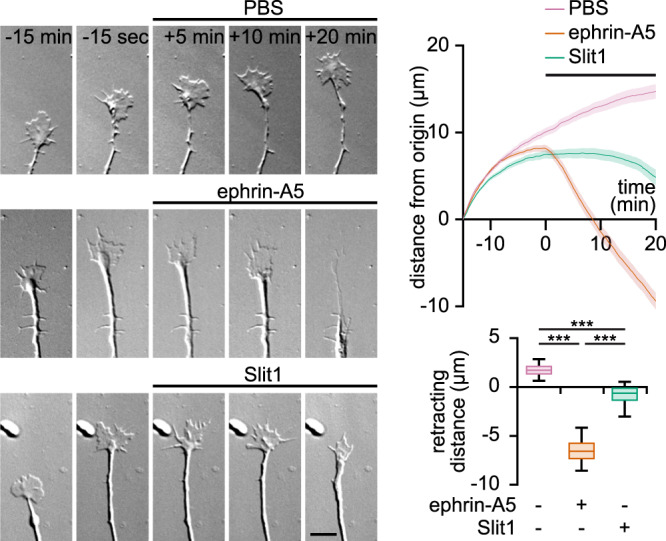
Fig. 7 Ephrin-A5 and Slit1 induce distinct morphological changes of axonal growth cones in vitro. The growth of axons exposed to PBS is not affected (top row). Ephrin-A5 induces a growth cone collapse followed by a prompt retraction (middle row). Axons exposed to Slit1 exhibit a collapse of the growth cones but in contrast to axons encountering ephrin-A5, do not retract within the 20 min recorded (bottom row). Traces: mean ± s.e.m. Box-and-whisker plot elements: median, upper and lower quartiles, 10th and 90th percentiles. *** P < 0.001; Kruskal–Wallis test followed by Dunn’s post-hoc test. Source data, number of replicates and P values are provided as a Source Data file.
Fig. 7 Ephrin-A5 and Slit1 induce distinct morphological changes of axonal growth cones in vitro. The growth of axons exposed to PBS is not affected (top row). Ephrin-A5 induces a growth cone collapse followed by a prompt retraction (middle row). Axons exposed to Slit1 exhibit a collapse of the growth cones but in contrast to axons encountering ephrin-A5, do not retract within the 20 min recorded (bottom row). Traces: mean ± s.e.m. Box-and-whisker plot elements: median, upper and lower quartiles, 10th and 90th percentiles. *** P < 0.001; Kruskal–Wallis test followed by Dunn’s post-hoc test. Source data, number of replicates and P values are provided as a Source Data file.CC BY · PubMed Central
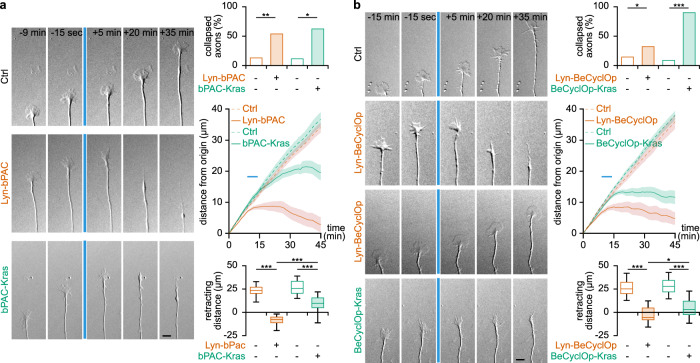
Fig. 8 Imposing lipid raft-restricted and -excluded cyclic nucleotides modulation mimics the axon behavior induced by ephrin-A5 and slit1, respectively. a Lyn-bPAC-expressing growth cones retract when exposed to successive pulse of blue light whereas control axons are insensitive to this light stimulation. By contrast, bPAC-Kras-expressing growth cones collapse but do not retract. The blue line denotes the time of light exposure both in the image sequences and in the traces. b When exposed to blue light, Lyn-BeCyclOp induces the collapse of a limited fraction of growth cone. Light activation of BeCyclop-Kras also leads to growth cone collapse, but in a large majority of axons. Lyn-BeCyclOp-expressing collapsing growth cones retract more than the axons of BeCyclOp-Kras-electroporated neurons. a,b Traces: mean ± s.e.m. Box-and-whisker plot elements: median, upper and lower quartiles, 10th and 90th percentiles. * P < 0.05, ** P < 0.01, *** P < 0.001. Top graphs χ2 test followed by χ2 post-hoc tests; bottom graphs, One way ANOVA followed by Dunnett post-hoc test. Source data, number of replicates and P values are provided as a Source Data file.
Fig. 8 Imposing lipid raft-restricted and -excluded cyclic nucleotides modulation mimics the axon behavior induced by ephrin-A5 and slit1, respectively. a Lyn-bPAC-expressing growth cones retract when exposed to successive pulse of blue light whereas control axons are insensitive to this light stimulation. By contrast, bPAC-Kras-expressing growth cones collapse but do not retract. The blue line denotes the time of light exposure both in the image sequences and in the traces. b When exposed to blue light, Lyn-BeCyclOp induces the collapse of a limited fraction of growth cone. Light activation of BeCyclop-Kras also leads to growth cone collapse, but in a large majority of axons. Lyn-BeCyclOp-expressing collapsing growth cones retract more than the axons of BeCyclOp-Kras-electroporated neurons. a,b Traces: mean ± s.e.m. Box-and-whisker plot elements: median, upper and lower quartiles, 10th and 90th percentiles. * P < 0.05, ** P < 0.01, *** P < 0.001. Top graphs χ2 test followed by χ2 post-hoc tests; bottom graphs, One way ANOVA followed by Dunnett post-hoc test. Source data, number of replicates and P values are provided as a Source Data file.CC BY · PubMed Central
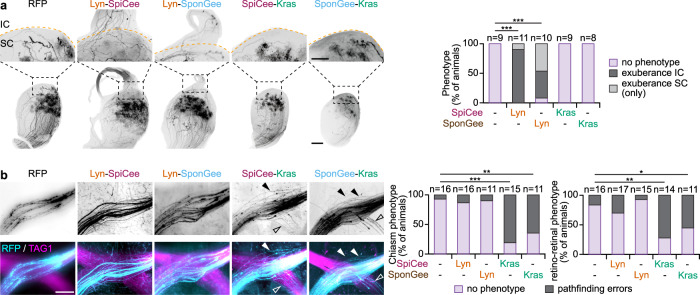
Fig. 9 Lipid raft-targeted and -excluded scavenging lead to misguided retinal axons in the SC and at the optic chiasm, respectively. a Lyn-SpiCee- and Lyn-SponGee-expression lead to overshooting axons in the inferior colliculus at P15, by contrast to mRFP-, SpiCee-Kras- and SponGee-Kras-expression. The orange dashed line highlights the position of the posterior end of the superior colliculus (SC). The inferior colliculus (IC) is above this line. The top row images are magnifications of the regions of the bottom row images indicated by the black dashed squares. Scale bars: top row, 250 µm; bottom row, 500 µm. b SpiCee-Kras- and SponGee-Kras-expressing axons (cyan) exit the optic chiasm labeled with TAG1 (magenta), by contrast to the axons of mRFP-, Lyn-SpiCee and Lyn-SponGee-electroporated RGCs. An excess of retino-retinal axons is also detected in SpiCee-Kras- and SponGee-Kras-electroporated animals, as compared to mRFP-, Lyn-SpiCee- and Lyn-SponGee-electroporated RGCs. The top row highlights the mRFP channels in which electroporated axons are seen. Closed arrowheads, axons exiting the optic chiasm; open arrowheads, retino-retinal axons. Scale bar, 200 µm. a,b ** P < 0.01; *** P < 0.001; χ2 test followed by χ2 post-hoc tests. Source data are provided as a Source data, number of replicates and P values are provided as a Source Data file.
Fig. 9 Lipid raft-targeted and -excluded scavenging lead to misguided retinal axons in the SC and at the optic chiasm, respectively. a Lyn-SpiCee- and Lyn-SponGee-expression lead to overshooting axons in the inferior colliculus at P15, by contrast to mRFP-, SpiCee-Kras- and SponGee-Kras-expression. The orange dashed line highlights the position of the posterior end of the superior colliculus (SC). The inferior colliculus (IC) is above this line. The top row images are magnifications of the regions of the bottom row images indicated by the black dashed squares. Scale bars: top row, 250 µm; bottom row, 500 µm. b SpiCee-Kras- and SponGee-Kras-expressing axons (cyan) exit the optic chiasm labeled with TAG1 (magenta), by contrast to the axons of mRFP-, Lyn-SpiCee and Lyn-SponGee-electroporated RGCs. An excess of retino-retinal axons is also detected in SpiCee-Kras- and SponGee-Kras-electroporated animals, as compared to mRFP-, Lyn-SpiCee- and Lyn-SponGee-electroporated RGCs. The top row highlights the mRFP channels in which electroporated axons are seen. Closed arrowheads, axons exiting the optic chiasm; open arrowheads, retino-retinal axons. Scale bar, 200 µm. a,b ** P < 0.01; *** P < 0.001; χ2 test followed by χ2 post-hoc tests. Source data are provided as a Source data, number of replicates and P values are provided as a Source Data file.CC BY · PubMed Central

Verification

Claims the paper makes

The claims and statistics of this paper haven’t been checked yet.

Run the check — free, no account needed. It reads the open-access text and checks the sources it cites.

A few free checks a day · papers already verified open instantly · results are public

Claims other papers make about this one

Each is checked against this paper’s own text: does it say what the citing paper says it does?

Self-check

Percentages, sums and reported differences re-computed from the paper’s own numbers.

The self-check needs the paper’s full text.

Citations

Cites

Show all 1 references

Research works printed but not linked: 59

  1. Zaccolo, M., Zerio, A. & Lobo, M. J. Subcellular Organization of the cAMP Signaling Pathway. Pharmacol. Rev. 73, 278–309 (2021). · DOI
  2. Berridge, M. J. Calcium microdomains: organization and function. Cell Calcium 40, 405–412 (2006). · DOI · Paper page
  3. Conklin, M. W., Lin, M. S. & Spitzer, N. C. Local calcium transients contribute to disappearance of pFAK, focal complex removal and deadhesion of neuronal growth cones and fibroblasts. Dev. Biol. 287, 201–212 (2005). · DOI
  4. Gomez, T. M. & Spitzer, N. C. In vivo regulation of axon extension and pathfinding by growth-cone calcium transients. Nature 397, 350–355 (1999). · DOI
  5. Gomez, T. M., Robles, E., Poo, M. & Spitzer, N. C. Filopodial calcium transients promote substrate-dependent growth cone turning. Science 291, 1983–1987 (2001). · DOI
  6. Anton, S. E. et al. Receptor-associated independent cAMP nanodomains mediate spatiotemporal specificity of GPCR signaling. Cell 185, 1130–1142.e11 (2022). · DOI · Paper page
  7. Bock, A. et al. Optical Mapping of cAMP Signaling at the Nanometer Scale. Cell 182, 1519–1530.e17 (2020). · DOI
  8. Zhang, J. Z. et al. Phase Separation of a PKA Regulatory Subunit Controls cAMP Compartmentation and Oncogenic Signaling. Cell 182, 1531–1544.e15 (2020). · DOI
  9. Averaimo, S. et al. A plasma membrane microdomain compartmentalizes ephrin-generated cAMP signals to prune developing retinal axon arbors. Nat. Commun. 7, 12896 (2016). · DOI
  10. Subramanian, H. et al. Distinct submembrane localisation compartmentalises cardiac NPR1 and NPR2 signalling to cGMP. Nat. Commun. 9, 2446 (2018). · DOI
  11. Averaimo, S. & Nicol, X. Intermingled cAMP, cGMP and calcium spatiotemporal dynamics in developing neuronal circuits. Front. Cell Neurosci. 8, 376 (2014). · DOI
  12. Zaccolo, M. & Movsesian, M. A. cAMP and cGMP signaling cross-talk: role of phosphodiesterases and implications for cardiac pathophysiology. Circ. Res. 100, 1569–1578 (2007). · DOI
  13. Potter, L. R. Guanylyl cyclase structure, function and regulation. Cell. Signalling 23, 1921–1926 (2011). · DOI
  14. Willoughby, D. & Cooper, D. M. F. Organization and Ca2+ regulation of adenylyl cyclases in cAMP microdomains. Physiol. Rev. 87, 965–1010 (2007). · DOI
  15. Francis, S. H., Turko, I. V. & Corbin, J. D. Cyclic nucleotide phosphodiesterases: relating structure and function. Prog. Nucleic Acid Res. Mol. Biol. 65, 1–52 (2001).
  16. Michie, A. M., Lobban, M., Müller, T., Harnett, M. M. & Houslay, M. D. Rapid regulation of PDE-2 and PDE-4 cyclic AMP phosphodiesterase activity following ligation of the T cell antigen receptor on thymocytes: analysis using the selective inhibitors erythro-9-(2-hydroxy-3-nonyl)-adenine (EHNA) and rolipram. Cell Signal 8, 97–110 (1996). · DOI
  17. Bradley, J., Reisert, J. & Frings, S. Regulation of cyclic nucleotide-gated channels. Curr. Opin. Neurobiol. 15, 343–349 (2005). · DOI
  18. Dyachok, O., Isakov, Y., Sågetorp, J. & Tengholm, A. Oscillations of cyclic AMP in hormone-stimulated insulin-secreting beta-cells. Nature 439, 349–352 (2006). · DOI
  19. Gorbunova, Y. V. & Spitzer, N. C. Dynamic interactions of cyclic AMP transients and spontaneous Ca2+ spikes. Nature 418, 93–96 (2002). · DOI
  20. Landa, L. R. et al. Interplay of Ca2+ and cAMP signaling in the insulin-secreting MIN6 beta-cell line. J. Biol. Chem. 280, 31294–31302 (2005). · DOI
  21. Willoughby, D. & Cooper, D. M. F. Ca2+ stimulation of adenylyl cyclase generates dynamic oscillations in cyclic AMP. J. Cell. Sci 119, 828–836 (2006). · DOI
  22. Hong, K., Nishiyama, M., Henley, J., Tessier-Lavigne, M. & Poo, M. Calcium signalling in the guidance of nerve growth by netrin-1. Nature 403, 93–98 (2000). · DOI
  23. Ming, G. L. et al. cAMP-dependent growth cone guidance by netrin-1. Neuron 19, 1225–1235 (1997). · DOI
  24. Nishiyama, M., von Schimmelmann, M. J., Togashi, K., Findley, W. M. & Hong, K. Membrane potential shifts caused by diffusible guidance signals direct growth-cone turning. Nat. Neurosci. 11, 762–771 (2008). · DOI
  25. Kobayashi, T., Nagase, F., Hotta, K. & Oka, K. Crosstalk between second messengers predicts the motility of the growth cone. Sci. Rep. 3, 3118 (2013). · DOI
  26. Nicol, X., Hong, K. P. & Spitzer, N. C. Spatial and temporal second messenger codes for growth cone turning. PNAS 108, 13776–13781 (2011). · DOI
  27. Nishiyama, M. et al. Cyclic AMP/GMP-dependent modulation of Ca2+ channels sets the polarity of nerve growth-cone turning. Nature 423, 990–995 (2003). · DOI
  28. Guirland, C., Suzuki, S., Kojima, M., Lu, B. & Zheng, J. Q. Lipid rafts mediate chemotropic guidance of nerve growth cones. Neuron 42, 51–62 (2004). · DOI
  29. Hérincs, Z. et al. DCC association with lipid rafts is required for netrin-1-mediated axon guidance. J. Cell. Sci 118, 1687–1692 (2005). · DOI
  30. McConnell, R. E. et al. A requirement for filopodia extension toward Slit during Robo-mediated axon repulsion. J Cell Biol. 213, 261–274 (2016). · DOI
  31. Plump, A. S. et al. Slit1 and Slit2 cooperate to prevent premature midline crossing of retinal axons in the mouse visual system. Neuron 33, 219–232 (2002). · DOI
  32. Thompson, H., Barker, D., Camand, O. & Erskine, L. Slits contribute to the guidance of retinal ganglion cell axons in the mammalian optic tract. Dev. Biol. 296, 476–484 (2006). · DOI
  33. Feldheim, D. A. et al. Genetic analysis of ephrin-A2 and ephrin-A5 shows their requirement in multiple aspects of retinocollicular mapping. Neuron 25, 563–574 (2000). · DOI
  34. Frisén, J. et al. Ephrin-A5 (AL-1/RAGS) is essential for proper retinal axon guidance and topographic mapping in the mammalian visual system. Neuron 20, 235–243 (1998). · DOI
  35. Ros, O. et al. SponGee: A Genetic Tool for Subcellular and Cell-Specific cGMP Manipulation. Cell Rep. 27, 4003–4012.e6 (2019). · DOI
  36. Thestrup, T. et al. Optimized ratiometric calcium sensors for functional in vivo imaging of neurons and T lymphocytes. Nat. Methods 11, 175–182 (2014). · DOI
  37. Starostina, I. et al. Distinct calcium regulation of TRPM7 mechanosensitive channels at plasma membrane microdomains visualized by FRET-based single cell imaging. Sci Rep. 11, 17893 (2021). · DOI
  38. Tang, F., Dent, E. W. & Kalil, K. Spontaneous calcium transients in developing cortical neurons regulate axon outgrowth. J. Neurosci. 23, 927–936 (2003). · DOI
  39. Klarenbeek, J., Goedhart, J., van Batenburg, A., Groenewald, D. & Jalink, K. Fourth-generation epac-based FRET sensors for cAMP feature exceptional brightness, photostability and dynamic range: characterization of dedicated sensors for FLIM, for ratiometry and with high affinity. PLoS ONE 10, e0122513 (2015). · DOI
  40. Lefkimmiatis, K., Moyer, M. P., Curci, S. & Hofer, A. M. ‘cAMP sponge’: a buffer for cyclic adenosine 3’, 5’-monophosphate. PLoS ONE 4, e7649 (2009). · DOI
  41. Ros, O. et al. SpiCee: A Genetic Tool for Subcellular and Cell-Specific Calcium Manipulation. Cell Rep. 32, 107934 (2020). · DOI
  42. Simon, D. K. & O’Leary, D. D. Development of topographic order in the mammalian retinocollicular projection. J. Neurosci. 12, 1212–1232 (1992). · DOI
  43. Stierl, M. et al. Light modulation of cellular cAMP by a small bacterial photoactivated adenylyl cyclase, bPAC, of the soil bacterium Beggiatoa. J. Biol. Chem. 286, 1181–1188 (2011). · DOI
  44. Gao, S. et al. Optogenetic manipulation of cGMP in cells and animals by the tightly light-regulated guanylyl-cyclase opsin CyclOp. Nat. Commun. 6, 8046 (2015). · DOI
  45. Ohta, Y., Furuta, T., Nagai, T. & Horikawa, K. Red fluorescent cAMP indicator with increased affinity and expanded dynamic range. Sci. Rep. 8, 1866 (2018). · DOI
  46. Nausch, L. W. M., Ledoux, J., Bonev, A. D., Nelson, M. T. & Dostmann, W. R. Differential patterning of cGMP in vascular smooth muscle cells revealed by single GFP-linked biosensors. Proc. Natl. Acad. Sci. U.S.A. 105, 365–370 (2008). · DOI
  47. Feldheim, D. A. et al. Loss-of-function analysis of EphA receptors in retinotectal mapping. J. Neurosci. 24, 2542–2550 (2004). · DOI
  48. Akiyama, H., Matsu-ura, T., Mikoshiba, K. & Kamiguchi, H. Control of neuronal growth cone navigation by asymmetric inositol 1,4,5-trisphosphate signals. Sci. Signal 2, ra34 (2009). · DOI
  49. Li, L., Hutchins, B. I. & Kalil, K. Wnt5a induces simultaneous cortical axon outgrowth and repulsive axon guidance through distinct signaling mechanisms. J. Neurosci. 29, 5873–5883 (2009). · DOI
  50. Atkins, M., Darmon, M., Roche, F., Nicol, X. & Métin, C. CXCL12 targets the primary cilium cAMP/cGMP ratio to regulate cell polarity during migration. 2023.02.07.527463 Preprint at https://doi.org/10.1101/2023.02.07.527463 (2023). · DOI
  51. Corbin, J. D., Turko, I. V., Beasley, A. & Francis, S. H. Phosphorylation of phosphodiesterase-5 by cyclic nucleotide-dependent protein kinase alters its catalytic and allosteric cGMP-binding activities. Eur. J. Biochem. 267, 2760–2767 (2000). · DOI
  52. Shelly, M. et al. Local and long-range reciprocal regulation of cAMP and cGMP in axon/dendrite formation. Science 327, 547–552 (2010). · DOI
  53. Ford, K. J. et al. A role for TREK1 in generating the slow afterhyperpolarization in developing starburst amacrine cells. J. Neurophysiol. 109, 2250–2259 (2013). · DOI
  54. Nicol, X. et al. cAMP oscillations and retinal activity are permissive for ephrin signaling during the establishment of the retinotopic map. Nat. Neurosci. 10, 340–347 (2007). · DOI
  55. Gomez, T. M. & Zheng, J. Q. The molecular basis for calcium-dependent axon pathfinding. Nat. Rev. Neurosci. 7, 115–125 (2006). · DOI · Paper page
  56. Poliak, S. et al. Synergistic integration of Netrin and ephrin axon guidance signals by spinal motor neurons. Elife 4, e10841 (2015). · DOI
  57. Agarwal, S. R. et al. Role of membrane microdomains in compartmentation of cAMP signaling. PLoS ONE 9, e95835 (2014). · DOI
  58. Louail, A. et al. cAMP-Dependent Co-stabilization of Axonal Arbors from Adjacent Developing Neurons. Cell Rep. 33, 108220 (2020). · DOI
  59. Louail, A., Assali, A. & Nicol, X. Targeted in utero electroporation of the ventro-temporal mouse retina. STAR Protoc. 2, 100516 (2021). · DOI

Cited by

Sorted by citations

Metadata

Authors
Baudet, S., Zagar, Y., Roche, F., Gomez-Bravo, C., Couvet, S., Bécret, J., Belle, M., Vougny, J., Uthayasuthan, S., Ros, O., & Nicol, X.
Affiliations
Centre National de la Recherche Scientifique (FR)
Corresponding author
Nicol, Xavier
Venue
Nature Communications
Published
2023-06-27
Volume
14
Issue
1
Pages
3809-3809
ISSN
2041-1723 (ISSN-L)
OpenAlex
W4382344515
Cited by
13
References
1
Citations by year
2026: 3 · 2025: 8 · 2023: 2
FWCI
1.58
Type
journal article
Language
en
Open access
Locations
  • Nature Communications (publishedVersion, cc-by)
  • bioRxiv (Cold Spring Harbor Laboratory) (acceptedVersion, cc-by-nc-nd)
  • PubMed Central (publishedVersion, cc-by)
  • PubMed (publishedVersion)
  • HAL (submittedVersion, cc-by)
  • RePEc: Research Papers in Economics (submittedVersion)
  • DOAJ (DOAJ: Directory of Open Access Journals) (submittedVersion, cc-by-sa)
Funders
  • Agence Nationale de la Recherche (ANR-18-CE16-0017, ANR‐10‐LABX‐65, ANR18, 10-LABX-65, ANR-18-IAHU-0001, ANR-10)
  • Fondation pour la Recherche Médicale (ANR-10-LABX-65, FDT202204014862)
  • Fondation de France (00099274)
  • Fondation Voir et Entendre (ANR-10-LABX-65)
  • Sorbonne Université
Topics
  • Life Sciences › Neuroscience › Cellular and Molecular Neuroscience › Axon Guidance and Neuronal Signaling
  • Life Sciences › Neuroscience › Cellular and Molecular Neuroscience › Nerve injury and regeneration
  • Life Sciences › Neuroscience › Developmental Neuroscience › Neurogenesis and neuroplasticity mechanisms
Keywords
axon guidance, second messengers, cyclic AMP, cyclic GMP, calcium signaling, ephrin-A5, Slit1, axon morphology, nanodomains
MeSH terms
Axons, Cyclic GMP, Second Messenger Systems, Signal Transduction

About these checks

Registry, retraction, Cites and statistics results are computed, not judged, with one exception: a printed reference that no index lists is read once by a model before it counts as a citation error. Claims are extracted by a model and kept only when their quote appears verbatim in the text; each cited source is then checked, with a model’s help, for whether it says what the claim relies on. Those verdicts can be wrong — read the claim’s quote and the cited source before relying on one.

Statistics and arithmetic are recomputed, not judged.

Confidence bands are shown only for fields calibrated on our annotated test set. None is calibrated yet, so no band is shown.

What counts as a claim ›How we measure confidence ›How we check this ›

Are you an author, or do you see a problem with this page? Request a review