Student or educator? Sign up with your school email and get 6 months of Pro free.
CoChat

The DOI matches its Crossref record; the references it cites are not checked yet.

Behavioral decomposition reveals rich encoding structure employed across neocortex in rats

Open access

Abstract

The cortical population code is pervaded by activity patterns evoked by movement, but it remains largely unknown how such signals relate to natural behavior or how they might support processing in sensory cortices where they have been observed. To address this we compared high-density neural recordings across four cortical regions (visual, auditory, somatosensory, motor) in relation to sensory modulation, posture, movement, and ethograms of freely foraging male rats. Momentary actions, such as rearing or turning, were represented ubiquitously and could be decoded from all sampled structures. However, more elementary and continuous features, such as pose and movement, followed region-specific organization, with neurons in visual and auditory cortices preferentially encoding mutually distinct head-orienting features in world-referenced coordinates, and somatosensory and motor cortices principally encoding the trunk and head in egocentric coordinates. The tuning properties of synaptically coupled cells also exhibited connection patterns suggestive of area-specific uses of pose and movement signals, particularly in visual and auditory regions. Together, our results indicate that ongoing behavior is encoded at multiple levels throughout the dorsal cortex, and that low-level features are differentially utilized by different regions to serve locally relevant computations.

Overview

The claims and statistics of this paper haven’t been checked yet.

Free: it reads the open-access text and checks the first 5 claims that cite a source we can check. Create a free account to check every claim.

A few free checks a day · papers already verified open instantly · results are public

Integrity signals

Registry

Crossref · 10.1038/s41467-023-39520-3

Cites

Statistics

Figures

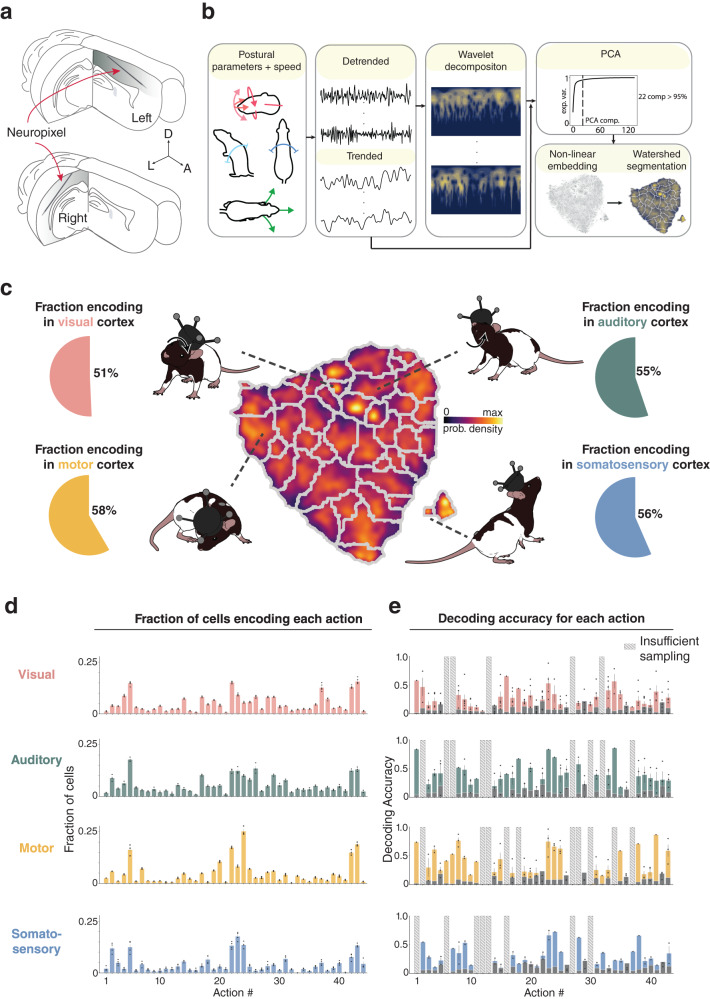
Fig. 1 Encoding and decoding of natural actions is robust in visual, auditory, motor and somatosensory cortices. a (Top) Neuropixels probes implanted in the left hemisphere were tilted 60-70° in the sagittal plane, traveling anteriorly from S1 to M1. (Bottom) Separate animals were implanted with probes in the right hemisphere tilted 45--50∘ in the coronal plane, progressing laterally through primary and secondary visual and auditory cortices. b (Left) To extract discernible actions, time series were generated for each postural feature of the head (pitch, azimuth, roll) and back (pitch, azimuth), together with running speed and neck elevation. (Middle) Data were then detrended and decomposed spectrally using a Morlet wavelet transform. (Right) Features from all animals were sub-sampled and co-embedded in two dimensions using t-SNE, followed by watershed segmentation, producing a map in which distinct actions separated into discrete categories. c (Middle) A map of identified actions, color-coded for occupancy, shows cumulative sampling of the 44 actions. d The fraction of cells encoding each action, arranged by numerical labels (1 to 44), in each overarching region; all regions encoded both still and active behaviors. In visual cortex, the most common actions included #5, “still, head down left, curl left” and #22, “running, head level, scanning''. Action #5 was also most common in auditory cortex, followed by #26, “walk, clockwise head roll''. Motor cortical neurons most commonly encoded action #24, “still, CW head roll, slight up” and action #22, “running, head level, scanning'', while somatosensory neurons most frequently encoded action #23, “running, head up''. Dots indicate encoding rates for each animal in each session, bars and error bars denote the mean and ± standard deviation (stdv), respectively. e Decoding accuracy for each action in each cortical area, with analyses restricted to 60 cells to match sampling across regions. Dots denote decoder performance in each session for each rat, bars denote the mean, error bars denote ± stdv; gray bars show decoder performance consisting only of a prior distribution; actions with insufficient sampling shown as striped bars. Rat illustrations by Falconieri Visuals. ⓒ All Rights Reserved. Source data are provided as a Source data file.
Fig. 1 Encoding and decoding of natural actions is robust in visual, auditory, motor and somatosensory cortices. a (Top) Neuropixels probes implanted in the left hemisphere were tilted 60-70° in the sagittal plane, traveling anteriorly from S1 to M1. (Bottom) Separate animals were implanted with probes in the right hemisphere tilted 45--50∘ in the coronal plane, progressing laterally through primary and secondary visual and auditory cortices. b (Left) To extract discernible actions, time series were generated for each postural feature of the head (pitch, azimuth, roll) and back (pitch, azimuth), together with running speed and neck elevation. (Middle) Data were then detrended and decomposed spectrally using a Morlet wavelet transform. (Right) Features from all animals were sub-sampled and co-embedded in two dimensions using t-SNE, followed by watershed segmentation, producing a map in which distinct actions separated into discrete categories. c (Middle) A map of identified actions, color-coded for occupancy, shows cumulative sampling of the 44 actions. d The fraction of cells encoding each action, arranged by numerical labels (1 to 44), in each overarching region; all regions encoded both still and active behaviors. In visual cortex, the most common actions included #5, “still, head down left, curl left” and #22, “running, head level, scanning''. Action #5 was also most common in auditory cortex, followed by #26, “walk, clockwise head roll''. Motor cortical neurons most commonly encoded action #24, “still, CW head roll, slight up” and action #22, “running, head level, scanning'', while somatosensory neurons most frequently encoded action #23, “running, head up''. Dots indicate encoding rates for each animal in each session, bars and error bars denote the mean and ± standard deviation (stdv), respectively. e Decoding accuracy for each action in each cortical area, with analyses restricted to 60 cells to match sampling across regions. Dots denote decoder performance in each session for each rat, bars denote the mean, error bars denote ± stdv; gray bars show decoder performance consisting only of a prior distribution; actions with insufficient sampling shown as striped bars. Rat illustrations by Falconieri Visuals. ⓒ All Rights Reserved. Source data are provided as a Source data file.CC BY · PubMed Central
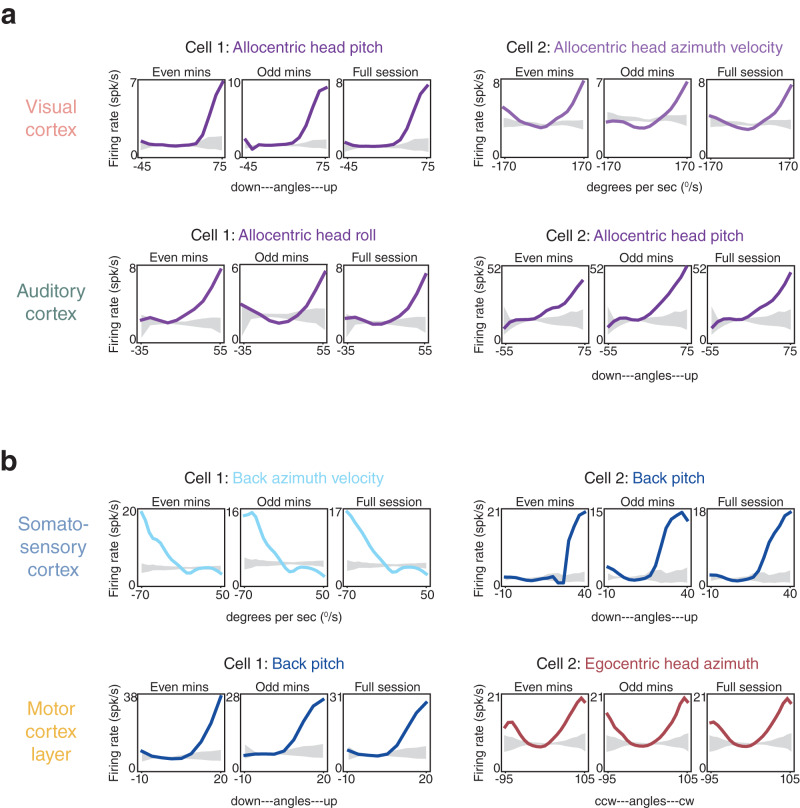
Fig. 2 Tuning curves for posture and movement in superficial or granular layers in each overarching cortical area. a (Top left) Tuning curves from a layer 2/3 visual cortical neuron (Cell 1) preferring upward pitch of the head in allocentric coordinates (all examples recorded in darkness). Data from even and odd minutes of a 20 min recording session are shown adjacently (left and middle), and full-session data are shown to the right; the 99% CI of shuffled data are shown in gray. A total of 30% of visual cortical neurons had even-odd minute tuning curve stability higher than the 95th quantile of shuffled data (“Methods”). In relation to the subsequent GLM analyses (in Fig. 3 and Supplementary Figs. 12 and 13), the pseudo-R2 value for allocentric head pitch for Cell 1 was 0.003. (Top right) A layer 2/3 visual cortical neuron tuned to right head azimuth velocity in allocentric coordinates; pseudo-R2 value of 0.01. (Lower left) A layer 4 auditory cortical neuron preferring rightward head roll (pseudo-R2, 0.004), and (lower right) a L4 auditory neuron tuned to upward pitch of the head in allocentric coordinates (pseudo-R2 of 0.001). 37% of auditory cortical neurons had tuning curves exceeding the shuffled distribution (as described above). b Somatosensory cortical neurons in layer 2/3 tuned to leftward flexion velocity of the back (top left; pseudo-R2 of 0.03), and upward pitch of the back (top right; pseudo-R2, 0.02). 43% of S1 neurons were stable beyond the shuffled data. (Lower left) Tuning curves from layer 2/3 motor cortical neurons preferring upward pitch of the back (pseudo-R2 of 0.06), and (lower right) left and right head roll relative to the trunk (pseudo-R2 of 0.01). Tuning curves from 66% of M1 neurons were stable beyond the 95th quantile of shuffled data.
Fig. 2 Tuning curves for posture and movement in superficial or granular layers in each overarching cortical area. a (Top left) Tuning curves from a layer 2/3 visual cortical neuron (Cell 1) preferring upward pitch of the head in allocentric coordinates (all examples recorded in darkness). Data from even and odd minutes of a 20 min recording session are shown adjacently (left and middle), and full-session data are shown to the right; the 99% CI of shuffled data are shown in gray. A total of 30% of visual cortical neurons had even-odd minute tuning curve stability higher than the 95th quantile of shuffled data (“Methods”). In relation to the subsequent GLM analyses (in Fig. 3 and Supplementary Figs. 12 and 13), the pseudo-R2 value for allocentric head pitch for Cell 1 was 0.003. (Top right) A layer 2/3 visual cortical neuron tuned to right head azimuth velocity in allocentric coordinates; pseudo-R2 value of 0.01. (Lower left) A layer 4 auditory cortical neuron preferring rightward head roll (pseudo-R2, 0.004), and (lower right) a L4 auditory neuron tuned to upward pitch of the head in allocentric coordinates (pseudo-R2 of 0.001). 37% of auditory cortical neurons had tuning curves exceeding the shuffled distribution (as described above). b Somatosensory cortical neurons in layer 2/3 tuned to leftward flexion velocity of the back (top left; pseudo-R2 of 0.03), and upward pitch of the back (top right; pseudo-R2, 0.02). 43% of S1 neurons were stable beyond the shuffled data. (Lower left) Tuning curves from layer 2/3 motor cortical neurons preferring upward pitch of the back (pseudo-R2 of 0.06), and (lower right) left and right head roll relative to the trunk (pseudo-R2 of 0.01). Tuning curves from 66% of M1 neurons were stable beyond the 95th quantile of shuffled data.CC BY · PubMed Central
Fig. 3 Distinct cortices show differential tuning to posture, movement and self-motion. a (Top left) Pie charts showing the fraction of single units in visual cortices (V1, V2L and V2M) that incorporated specific behavioral features as the first covariate (largest mean cross-validated log-likelihood among single covariates models) in model selection (see color-coded legend at bottom for feature identification). (Lower left) Bar graph indicating the percentages of single units statistically linked to one or any larger number of behavioral covariates. (Right) Polar charts denoting the relative importance of individual covariates included in the full model, after model selection, with “unclassified” cells excluded. Wedge length denotes the mean cross-validated rLLR (“Methods”) of each covariate across the set of models it was included in. The width of each wedge reflects the fraction of times that feature was selected among the other covariates. Wedge length and width are independent (i.e. the area does not reflect effect size). b Same as (a) but for auditory cortices (A1 and A2D). c Same as (a) but for the primary motor cortex (M1). d Same as (a) but for the primary somatosensory cortex (S1HL and S1Tr). (Bottom) Two color gradients were used to convey GLM results: one in pie charts (denoted by elongated lines) with related features grouped together, and one in polar plots (denoted by clear and striped rectangles) with each representing an individual feature. Rat illustrations by Falconieri Visuals. ⓒ All Rights Reserved. Source data are provided as a Source data file.
Fig. 3 Distinct cortices show differential tuning to posture, movement and self-motion. a (Top left) Pie charts showing the fraction of single units in visual cortices (V1, V2L and V2M) that incorporated specific behavioral features as the first covariate (largest mean cross-validated log-likelihood among single covariates models) in model selection (see color-coded legend at bottom for feature identification). (Lower left) Bar graph indicating the percentages of single units statistically linked to one or any larger number of behavioral covariates. (Right) Polar charts denoting the relative importance of individual covariates included in the full model, after model selection, with “unclassified” cells excluded. Wedge length denotes the mean cross-validated rLLR (“Methods”) of each covariate across the set of models it was included in. The width of each wedge reflects the fraction of times that feature was selected among the other covariates. Wedge length and width are independent (i.e. the area does not reflect effect size). b Same as (a) but for auditory cortices (A1 and A2D). c Same as (a) but for the primary motor cortex (M1). d Same as (a) but for the primary somatosensory cortex (S1HL and S1Tr). (Bottom) Two color gradients were used to convey GLM results: one in pie charts (denoted by elongated lines) with related features grouped together, and one in polar plots (denoted by clear and striped rectangles) with each representing an individual feature. Rat illustrations by Falconieri Visuals. ⓒ All Rights Reserved. Source data are provided as a Source data file.CC BY · PubMed Central
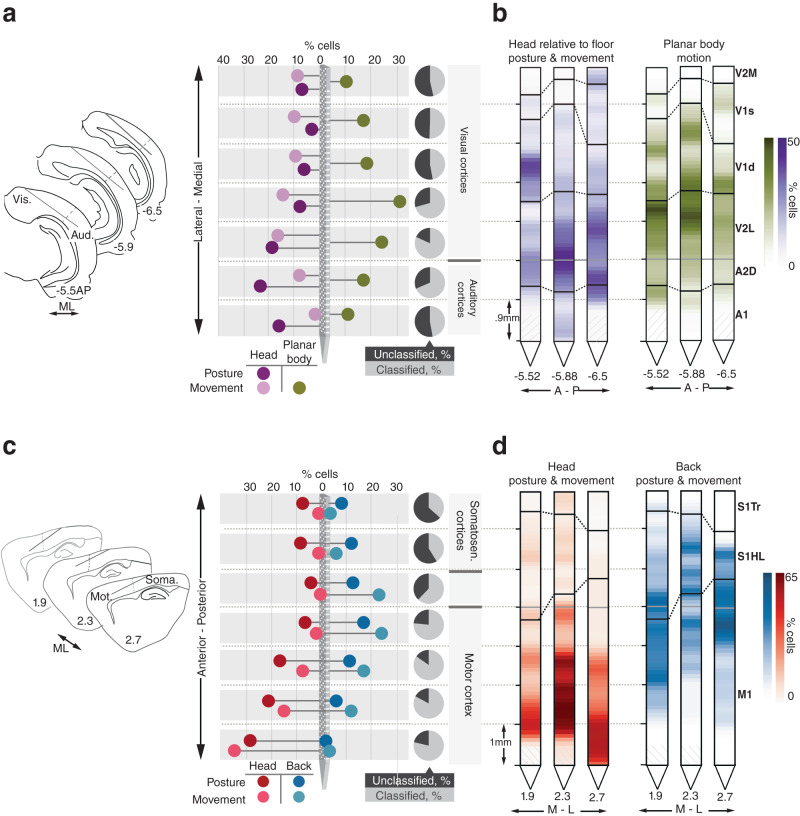
Fig. 4 Anatomically organized behavioral tuning gradients span sensory and motor regions. a (Left) Probe positions relative to corresponding coronal atlas sections in all right hemisphere implanted animals; the dotted line marks the border between auditory and visual cortices. (Middle) Percentage of all recorded cells responsive to allocentric head posture, allocentric head movement and planar body motion along the mediolateral axis. (Right) The fraction of cells showing any type of behavioral tuning at a given location is indicated by the gray and black pie charts. b Probes from each animal showing the percentage of cells encoding behavioral features along their length. c (Left) Same as in (a) only for left hemisphere implanted animals, with the dotted line marking the border between primary somatosensory and motor cortices. (Middle) percentage of all recorded cells responsive to egocentric head posture and movement, and back posture and movement along the rostrocaudal axis. (Right) same as in (a), but for cells classified along the length of S1-M1. d Same as (b), but using the probe view along S1 and M1 for each animal. Source data are provided as a Source Data file.
Fig. 4 Anatomically organized behavioral tuning gradients span sensory and motor regions. a (Left) Probe positions relative to corresponding coronal atlas sections in all right hemisphere implanted animals; the dotted line marks the border between auditory and visual cortices. (Middle) Percentage of all recorded cells responsive to allocentric head posture, allocentric head movement and planar body motion along the mediolateral axis. (Right) The fraction of cells showing any type of behavioral tuning at a given location is indicated by the gray and black pie charts. b Probes from each animal showing the percentage of cells encoding behavioral features along their length. c (Left) Same as in (a) only for left hemisphere implanted animals, with the dotted line marking the border between primary somatosensory and motor cortices. (Middle) percentage of all recorded cells responsive to egocentric head posture and movement, and back posture and movement along the rostrocaudal axis. (Right) same as in (a), but for cells classified along the length of S1-M1. d Same as (b), but using the probe view along S1 and M1 for each animal. Source data are provided as a Source Data file.CC BY · PubMed Central
Fig. 5 Auditory and visual cortices show similar prevalence and overlap of sensory and behavioral signals. a (Top) White noise stimulation paradigm schematic. (Bottom)Trial averaged activity for single cells (arranged by unit number, left axis) and ensemble averaged activity (overlaid trace) of all significantly suppressed (left) and sound-excited (right) single units in auditory cortices during sequences of sound stimulation. Colorimetric axis denoting activity relative to max are shown to the right. b (Top) Recording paradigm for light/dark sessions. 2 s segments of trial averaged and ensemble averaged activity of all significantly dark-suppressed (left) and dark-excited (right) single units in visual cortices. Axis labels are the same as in (a). c Distribution of recording sites of single units modulated significantly by sound (blue) or luminance (red) across sensory cortices (opacity represents concentrations of units). Sound- and light-modulation within auditory and visual cortices, respectively, were highest in layer 4 (L4). In A1, 48% of L4 neurons had significant sound modulation indices (SMIs), followed by layers 5 and 6, with 26% and 25%, respectively. In V1, 30% of layer 4 neurons had significant luminance modulation indices (LMIs); layer 5 had 27%, layer 6 had 24%, and layer 2/3 had 23%. d (Left) Venn diagrams and pie charts summarizing the overlap between and breakdown of spiking profile, sound modulation and behavioral tuning (as determined by the GLM analysis; n.c. non coding) in auditory cortices (A1 and A2D); the fraction of fast spiking (FS) and regular spiking (RS) cells in each category are indicated on either side of each pie chart. (Right) Same as (left) but for luminance modulation and visual cortices (V1, V2L and V2M). Source data are provided as a Source data file.
Fig. 5 Auditory and visual cortices show similar prevalence and overlap of sensory and behavioral signals. a (Top) White noise stimulation paradigm schematic. (Bottom)Trial averaged activity for single cells (arranged by unit number, left axis) and ensemble averaged activity (overlaid trace) of all significantly suppressed (left) and sound-excited (right) single units in auditory cortices during sequences of sound stimulation. Colorimetric axis denoting activity relative to max are shown to the right. b (Top) Recording paradigm for light/dark sessions. 2 s segments of trial averaged and ensemble averaged activity of all significantly dark-suppressed (left) and dark-excited (right) single units in visual cortices. Axis labels are the same as in (a). c Distribution of recording sites of single units modulated significantly by sound (blue) or luminance (red) across sensory cortices (opacity represents concentrations of units). Sound- and light-modulation within auditory and visual cortices, respectively, were highest in layer 4 (L4). In A1, 48% of L4 neurons had significant sound modulation indices (SMIs), followed by layers 5 and 6, with 26% and 25%, respectively. In V1, 30% of layer 4 neurons had significant luminance modulation indices (LMIs); layer 5 had 27%, layer 6 had 24%, and layer 2/3 had 23%. d (Left) Venn diagrams and pie charts summarizing the overlap between and breakdown of spiking profile, sound modulation and behavioral tuning (as determined by the GLM analysis; n.c. non coding) in auditory cortices (A1 and A2D); the fraction of fast spiking (FS) and regular spiking (RS) cells in each category are indicated on either side of each pie chart. (Right) Same as (left) but for luminance modulation and visual cortices (V1, V2L and V2M). Source data are provided as a Source data file.CC BY · PubMed Central
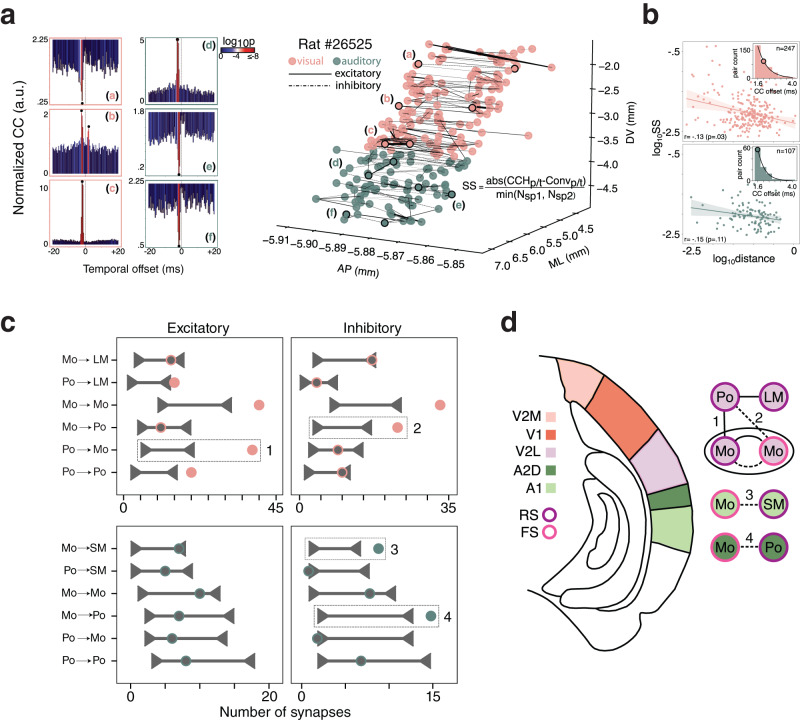
Fig. 6 Synaptic connectivity patterns reveal behavioral information is employed differently across auditory and visual subregions. a (Left) Three example temporal spiking cross-correlograms from visual (a–c) and auditory cortices (d–f). Significance threshold was set at the 99.9999% or 0.0001% of the cumulative Poisson distribution for excitatory or inhibitory connections, respectively; P-value calculations described in detail in “Methods” sub-section “Functional connectivity.” (Right) All putative synaptic connections including outlined examples (a–f) from one example rat’s (#26525) visual (pink) and auditory (green) areas localized in anatomical space, with the width of each connection weighted by synaptic strength (SS). b (Top) The log-log relationship of anatomical distance and synaptic strength (SS) revealed weak effects of anatomical distance on SS (two-sided r = − 0.13, p = 0.03); (inset) distribution and median (colored circle) of cross-correlogram peaks/troughs. (Bottom) Same as above, only for auditory cortices; SS did not vary as a function of anatomical distance (two-sided r = −0.15, p = 0.11). Lines in the scatter plots denote the least squares regression fit, shaded areas denote the 95% confidence intervals; the circle in inset histograms denotes the median of the distribution. c (Left) Shuffled connection distributions (horizontal line with carets) and experimentally observed excitatory and inhibitory connections (circles) for various functional subtypes in visual (above) and auditory (below) cortices. d (Top) The V2L network utilizes excitation and inhibition between postural and movement ensembles (connections 1 and 2, respectively; dashed boxes in (c)) which could serve to coordinate impending movements with visual flow. (Middle) A1 FS ensembles inherit movement information, which could enable gain-modulation of local sound modulated RS units (connection 3) in response to self-generated sounds. (Bottom) A2D FS movement modulated ensembles inhibit gravity-relative, posture-responsive units (connection 4), which could facilitate sound localization. Source data are provided as a Source data file.
Fig. 6 Synaptic connectivity patterns reveal behavioral information is employed differently across auditory and visual subregions. a (Left) Three example temporal spiking cross-correlograms from visual (a–c) and auditory cortices (d–f). Significance threshold was set at the 99.9999% or 0.0001% of the cumulative Poisson distribution for excitatory or inhibitory connections, respectively; P-value calculations described in detail in “Methods” sub-section “Functional connectivity.” (Right) All putative synaptic connections including outlined examples (a–f) from one example rat’s (#26525) visual (pink) and auditory (green) areas localized in anatomical space, with the width of each connection weighted by synaptic strength (SS). b (Top) The log-log relationship of anatomical distance and synaptic strength (SS) revealed weak effects of anatomical distance on SS (two-sided r = − 0.13, p = 0.03); (inset) distribution and median (colored circle) of cross-correlogram peaks/troughs. (Bottom) Same as above, only for auditory cortices; SS did not vary as a function of anatomical distance (two-sided r = −0.15, p = 0.11). Lines in the scatter plots denote the least squares regression fit, shaded areas denote the 95% confidence intervals; the circle in inset histograms denotes the median of the distribution. c (Left) Shuffled connection distributions (horizontal line with carets) and experimentally observed excitatory and inhibitory connections (circles) for various functional subtypes in visual (above) and auditory (below) cortices. d (Top) The V2L network utilizes excitation and inhibition between postural and movement ensembles (connections 1 and 2, respectively; dashed boxes in (c)) which could serve to coordinate impending movements with visual flow. (Middle) A1 FS ensembles inherit movement information, which could enable gain-modulation of local sound modulated RS units (connection 3) in response to self-generated sounds. (Bottom) A2D FS movement modulated ensembles inhibit gravity-relative, posture-responsive units (connection 4), which could facilitate sound localization. Source data are provided as a Source data file.CC BY · PubMed Central

Verification

Claims the paper makes

The claims and statistics of this paper haven’t been checked yet.

Free: it reads the open-access text and checks the first 5 claims that cite a source we can check. Create a free account to check every claim.

A few free checks a day · papers already verified open instantly · results are public

Claims other papers make about this one

Each is checked against this paper’s own text: does it say what the citing paper says it does?

Self-check

Percentages, sums and reported differences re-computed from the paper’s own numbers.

The self-check needs the paper’s full text.

Citations

The citation lists are queued

They are fetched later and appear here then.

References 118 · Cited by 45

Research works printed but not linked: 6

  1. Merel, J. et al. Deep neuroethology of a virtual rodent. 8th International Conference on Learning Representations (ICLR), (2020).
  2. Paxinos, G. & Watson, C. The Rat Brain in Stereotaxic Coordinates (Elsevier, 2007).
  3. Berman, G. J., Choi, D. M., Bialek, W. & Shaevitz, J. W. Mapping the stereotyped behaviour of freely moving fruit flies. J. R. Soc. Interface 11, 20140672 (2014). · DOI · Paper page
  4. Skaggs, W., McNaughton, B. & Gothard, K. An information-theoretic approach to deciphering the hippocampal code. In NIPS'92: Proceedings of the 5th International Conference on Neural Information Processing Systems 1030–1037 (Morgan-Kaufmann, 1993).
  5. Maaten, Lvd. & Hinton, G. Visualizing data using t-SNE. J. Mach. Learn. Res. 9, 2579–2605 (2008).
  6. McFadden, D. In Conditional Logit Analysis of Qualitative Choice Behaviour (ed. Zarembka, P.) 105–142 (Academic Press, 1973).

Metadata

Authors
Mimica, B., Tombaz, T., Battistin, C., Fuglstad, J. G., Dunn, B. A., & Whitlock, J. R.
Affiliations
  • Princeton University (US)
  • Norwegian University of Science and Technology (NO)
Corresponding author
  • Mimica, Bartul
  • Whitlock, Jonathan R.
Venue
Nature Communications
Published
2023-07-04
Volume
14
Issue
1
Pages
3947-3947
ISSN
2041-1723 (ISSN-L)
OpenAlex
W4383067213
Cited by
45
References
118
Citations by year
2026: 7 · 2025: 14 · 2024: 19 · 2023: 5
FWCI
6.71
Type
journal article
Language
en
Open access
Licence
Locations
  • Nature Communications (publishedVersion, cc-by)
  • PubMed Central (publishedVersion, cc-by)
  • PubMed (publishedVersion)
  • RePEc: Research Papers in Economics (submittedVersion)
  • DOAJ (DOAJ: Directory of Open Access Journals) (submittedVersion, cc-by-sa)
  • NORA - Norwegian Open Research Archives (submittedVersion, cc-by)
Funders
Faculty of Medicine at NTNU Central Norway Regional Health Authority
Topics
  • Life Sciences › Neuroscience › Cognitive Neuroscience › Neural dynamics and brain function
  • Life Sciences › Neuroscience › Cognitive Neuroscience › Memory and Neural Mechanisms
  • Life Sciences › Neuroscience › Cognitive Neuroscience › Motor Control and Adaptation
Keywords
neocortex, rats, visual cortex, auditory cortex, somatosensory cortex, motor cortex, head orientation, posture, movement, neural decoding, dorsal cortex, ethogram
MeSH terms
Animals, Auditory Cortex, Male, Movement, Parietal Lobe, Posture, Neocortex, Rats

About these checks

Registry, retraction, Cites and statistics results are computed, not judged, with one exception: a printed reference that no index lists is read once by a model before it counts as a citation error. Claims are extracted by a model and kept only when their quote appears verbatim in the text; each cited source is then checked, with a model’s help, for whether it says what the claim relies on. Those verdicts can be wrong — read the claim’s quote and the cited source before relying on one.

Statistics and arithmetic are recomputed, not judged.

Confidence bands are shown only for fields calibrated on our annotated test set. None is calibrated yet, so no band is shown.

What counts as a claim ›How we measure confidence ›How we check this ›

Are you an author, or do you see a problem with this page? Request a review

How to cite

Cite CoChat for the checks on this page, and the paper for its own findings.

This page
CoChat. (2026). Citation check: Behavioral decomposition reveals rich encoding structure employed across neocortex in rats. https://app.cochat.ai/papers/10.1038/s41467-023-39520-3
The paper
Mimica, B., Tombaz, T., Battistin, C., Fuglstad, J. G., Dunn, B. A., & Whitlock, J. R. (2023). Behavioral decomposition reveals rich encoding structure employed across neocortex in rats. Nature Communications. https://doi.org/10.1038/s41467-023-39520-3

Data sources

Bibliographic data: Semantic Scholar, OpenAlex, Crossref.

Contains information from the Semantic Scholar Academic Graph Datasets, made available under the ODC Attribution License (ODC-BY 1.0).

Semantic Scholar’s data is described in: Kinney, R., et al. (2023). The Semantic Scholar Open Data Platform. arXiv:2301.10140.