

The DOI matches its Crossref record; 37 of the 37 references it cites were found in a registry or an index.
Lanthanide-regulating Ru-O covalency optimizes acidic oxygen evolution electrocatalysis
Open accessAbstract
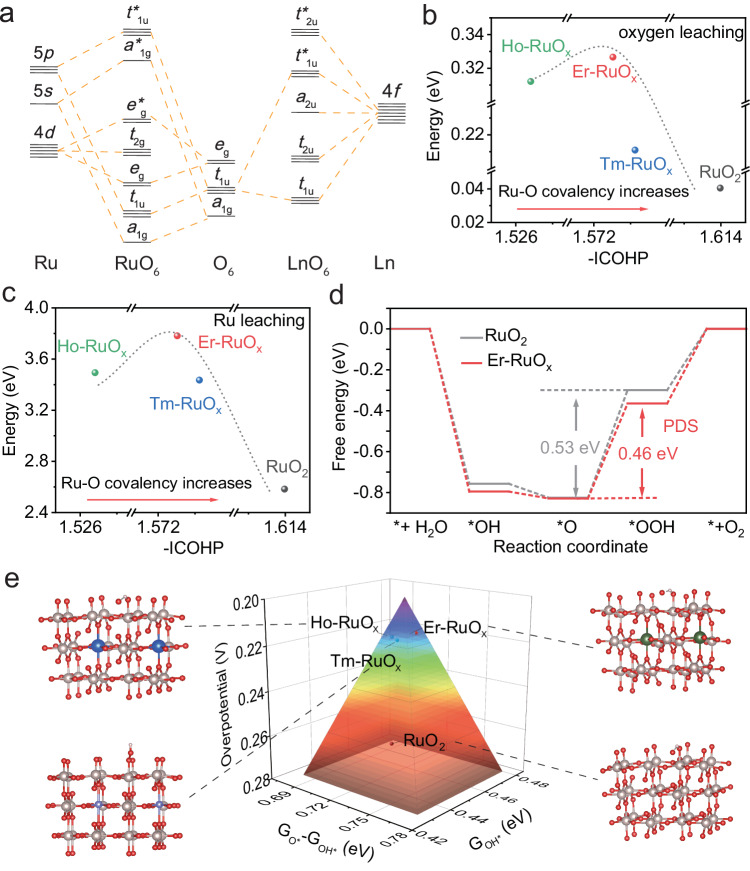
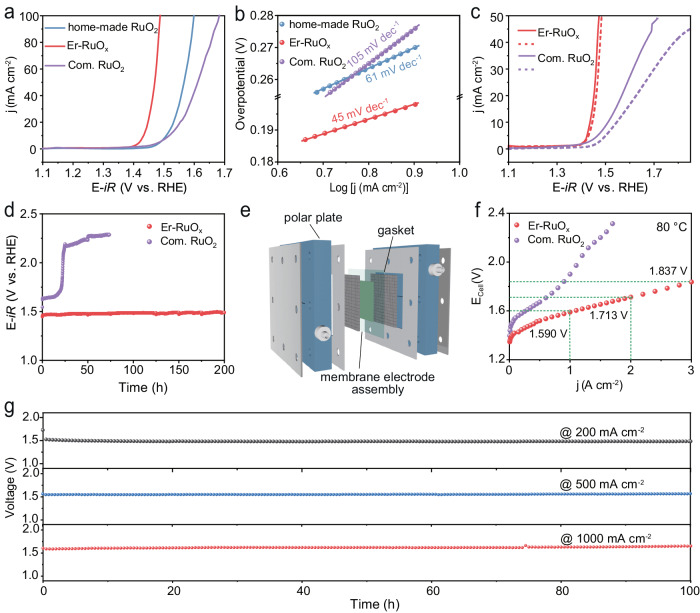
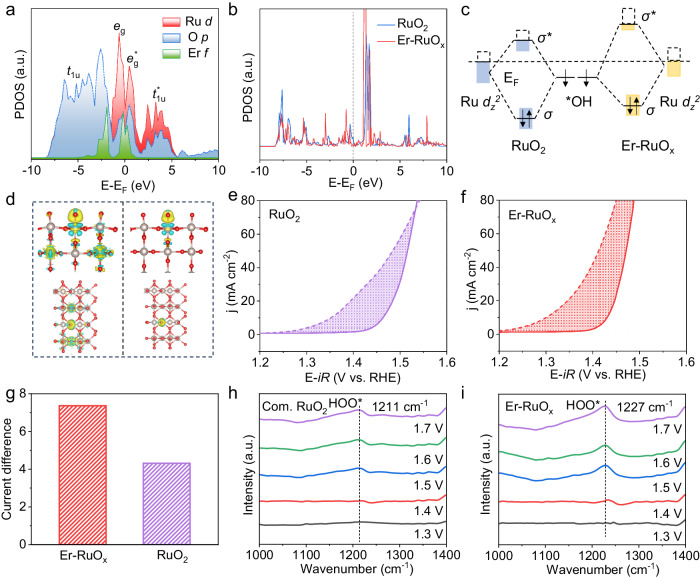
Precisely modulating the Ru-O covalency in RuO x for enhanced stability in proton exchange membrane water electrolysis is highly desired. However, transition metals with d -valence electrons, which were doped into or alloyed with RuO x , are inherently susceptible to the influence of coordination environment, making it challenging to modulate the Ru-O covalency in a precise and continuous manner. Here, we first deduce that the introduction of lanthanide with gradually changing electronic configurations can continuously modulate the Ru-O covalency owing to the shielding effect of 5 s /5 p orbitals. Theoretical calculations confirm that the durability of Ln-RuO x following a volcanic trend as a function of Ru-O covalency. Among various Ln-RuO x , Er-RuO x is identified as the optimal catalyst and possesses a stability 35.5 times higher than that of RuO 2 . Particularly, the Er-RuO x -based device requires only 1.837 V to reach 3 A cm −2 and shows a long-term stability at 500 mA cm −2 for 100 h with a degradation rate of mere 37 μV h −1 .
Overview
The claims and statistics of this paper haven’t been checked yet.
Run the check — free, no account needed. It reads the open-access text and checks the sources it cites.
Integrity signals
Registry
Cites
Statistics
Figures
Verification
Claims the paper makes
The claims and statistics of this paper haven’t been checked yet.
Run the check — free, no account needed. It reads the open-access text and checks the sources it cites.
Claims other papers make about this one
Each is checked against this paper’s own text: does it say what the citing paper says it does?
The check wasn’t confident either way, so it gives no verdict — never disputed.
In the citing paper
“metal Ru has a high charge density, leading to excessive adsorption of reaction intermediates during the HER and ORR.”
From Interface strain engineering of a Ru–RuO x /graphene aerogel composite boosts HER, OER and ORR applications (2026) · cites this paper as [17]
Experimental — accuracy not yet measured
Self-check
Percentages, sums and reported differences re-computed from the paper’s own numbers.
The self-check needs the paper’s full text.
Citations
Cites
Generalized Gradient Approximation Made Simple
Perdew, J. P., Burke, K., & Ernzerhof, M. (1996) · Physical Review Letters · doi:10.1103/physrevlett.77.3865 · Cited by 215,824
Efficient iterative schemes for ab initio total-energy calculations using a plane-wave basis set
Kresse, G., & Furthmüller, J. (1996) · Physical Review B · doi:10.1103/physrevb.54.11169 · Cited by 123,652
Combining theory and experiment in electrocatalysis: Insights into materials design
Seh, Z. W., Kibsgaard, J., Dickens, C. F., Chorkendorff, I., Nørskov, J. K., & Jaramillo, T. F. (2017) · Science · doi:10.1126/science.aad4998 · Cited by 12,114
Chen, F.-Y., Wu, Z.-Y., Adler, Z., & Wang, H. (2021) · Joule · doi:10.1016/j.joule.2021.05.005 · Cited by 1,284
Yao, Y., Hu, S., Chen, W., Huang, Z., Wei, W.-C., Yao, T., Liu, R., Zang, K., Wang, X., Wu, G., et al. (2019) · Nature Catalysis · doi:10.1038/s41929-019-0246-2 · Cited by 1,228
Wu, Z.-Y., Chen, F.-Y., Li, B., Yu, S.-W., Finfrock, Y. Z., Meira, D. M., Yan, Q.-Q., Zhu, P., Chen, M.-X., Song, T.-W., et al. (2023) · Nature Materials · doi:10.1038/s41563-022-01380-5 · Cited by 1,004
La- and Mn-doped cobalt spinel oxygen evolution catalyst for proton exchange membrane electrolysis
Chong, L., Gao, G., Wen, J., Li, H., Xu, H., Green, Z., Sugar, J. D., Kropf, A. J., Xu, W., Lin, X., et al. (2023) · Science · doi:10.1126/science.ade1499 · Cited by 837
Recent advances in proton exchange membrane water electrolysis
Liu, R., Xu, Z., Li, F., Chen, F., Yu, J., Yan, Y. P., Chen, Y., & Xia, B. Y. (2023) · Chemical Society Reviews · doi:10.1039/d2cs00681b · Cited by 737
Cao, L., Luo, Q., Chen, J., Wang, L., Lin, Y., Wang, H., Liu, X., Shen, X., Zhang, W., Liu, W., et al. (2019) · Nature Communications · doi:10.1038/s41467-019-12886-z · Cited by 709
Zagalskaya, A., & Alexandrov, V. (2020) · ACS Catalysis · doi:10.1021/acscatal.9b05544 · Cited by 684
Cited by
Sorted by citations
Items 201–300 of 369
Amorphous High-Entropy Borides Ensuring High Activity and Stability toward Efficient Water Oxidation
Wang, Z., Li, J., Li, C., Huang, G., Chen, C.-C., & Zhu, H. (2026) · ACS Sustainable Chemistry & Engineering · doi:10.1021/acssuschemeng.5c10744 · Cited by 7
A molten-salt dispersion of lanthanides at the atomic scale
Wang, H., Liu, C., Ji, Y., Zeng, H., Hu, S., Zhang, X., Zeng, Q., Li, J., Gao, Q., Zhang, Y., et al. (2026) · Nature Materials · doi:10.1038/s41563-026-02492-y · Cited by 8
Li, Y., Li, Z., Zhang, Z., Li, C., & Wang, J. (2026) · Applied Catalysis B: Environmental · doi:10.1016/j.apcatb.2026.126715 · Cited by 7
Liao, Z., Dai, Z., Jia, H., & Luo, W. (2026) · Journal of Energy Chemistry · doi:10.1016/j.jechem.2026.03.034 · Cited by 7
Guo, J., Li, P., Lv, D., Zhu, W., Shao, Q., Kang, Z., Shao, M., & Liao, F. (2026) · ACS Catalysis · doi:10.1021/acscatal.6c01207 · Cited by 7
Research advances, deactivation mechanisms, and improvement strategies of acidic OER catalysts
Ni, J., Wei, Y., Fan, M., Bautin, V. A., Li, W., & Han, C. (2026) · Journal of Energy Chemistry · doi:10.1016/j.jechem.2026.06.079 · Cited by 7
Zhang, Y., Huang, W., & Wei, H. (2024) · ChemCatChem · doi:10.1002/cctc.202401707 · Cited by 6
Xu, C., Yu, H., Huang, H., Li, S., Cao, Y., Peng, W., Li, Y., Ke, H., Xu, S., Mo, H., et al. (2025) · Angewandte Chemie · doi:10.1002/ange.202504667 · Cited by 6
Stabilization of highly active Ru sites toward acidic water oxidation by dual-atom doping
Tang, J., Zeng, Q., Jiang, Q. M., Wang, H., Hu, S., Ji, Y., Zeng, H., Liu, C., Peng, H., Xu, L., et al. (2025) · Chem Catalysis · doi:10.1016/j.checat.2025.101441 · Cited by 6
Gao, G., Hou, J., Fan, Y., Liu, Z., Qi, H., Xu, H., Huang, W., Chen, W., Yan, N., & Qu, Z. (2025) · Environmental Science & Technology · doi:10.1021/acs.est.5c04829 · Cited by 6
Li, X., Wei, Q., Wang, C., Wu, H., Gao, X., Chen, S., Li, J., Wu, X. L., Kang, Z., Wu, D., et al. (2025) · Science China Chemistry · doi:10.1007/s11426-025-2825-9 · Cited by 6
Water oxidation promoted synergistically by CeO2-shell on CoNiO2-core
Zhao, B., Irfan, R. M., Liu, C., Talib, S. H., Mahmood, A., & Niu, L. (2025) · Journal of Rare Earths · doi:10.1016/j.jre.2025.08.011 · Cited by 6
Liu, S., Liu, S., Mao, T., Yu, Q., Huang, W., Pao, C., Hu, Z., Kong, Q., Zhang, J., Huang, X., et al. (2025) · AIChE Journal · doi:10.1002/aic.70060 · Cited by 6
Zhang, H.-Z., Wang, X., Xie, Y., Li, C., Zhao, Z., Shao, P., Zhang, W.-C., Feng, S., Zhang, Y.-L., Zhao, L., et al. (2025) · Journal of Colloid and Interface Science · doi:10.1016/j.jcis.2025.139091 · Cited by 6
Ma, M., Cao, A., Liu, H., Xin, H., Kuang, Y., Chang, Z., Li, Y., Zhou, D., & Sun, X. (2025) · ACS Applied Materials & Interfaces · doi:10.1021/acsami.5c15561 · Cited by 6
Cai, H., Jiang, N., Xiong, L., Shang, F., Tang, Y., Zhang, X., Liang, C., Su, D., & Yang, S. (2025) · ACS Applied Materials & Interfaces · doi:10.1021/acsami.5c16663 · Cited by 6
Jin, J., Liu, Y., Liu, Z., Peng, X., Li, Y., Hao, L., Liu, C., Zhang, W., Fu, Y., Jiang, X., et al. (2025) · Advanced Functional Materials · doi:10.1002/adfm.202525644 · Cited by 6
Self-citationWang, X., Chen, J., Wang, H., Liu, R., Gao, F., Shen, Z., Gao, Y., Ren, X., Qi, F., Liu, Y., et al. (2025) · Applied Catalysis B: Environmental · doi:10.1016/j.apcatb.2025.126341 · Cited by 6
Self-citationWang, Z., Jiang, T., Alshehri, R. F., Ding, L., El‐Bahy, S. M., Lin, Y., Ying, P., Chen, H., Lei, H., Liu, T. X., et al. (2026) · Advanced Science · doi:10.1002/advs.202520473 · Cited by 6
Chen, X., Jia, W., Cao, X., Xu, G., Jin, T., & Jiao, L. (2026) · ACS Catalysis · doi:10.1021/acscatal.6c00022 · Cited by 6
Yao, H., Song, B., Yu, X., Cao, Q., Li, L., Huang, Y., & Guo, X. (2026) · Journal of Materials Chemistry A · doi:10.1039/d5ta10012g · Cited by 5
Self-citationFu, Y., Liu, C., Song, L., Zhao, S., Huang, M., Li, Z., Tang, H., Lu, Y., Xu, J., & Liu, Q. (2025) · Angewandte Chemie · doi:10.1002/ange.202501837 · Cited by 5
Stability of Doped Ruthenium Oxide as Oxygen Evolution Reaction Electrocatalysts
Kim, I. G., Yim, K., Yan, L., & Shao, Y. (2025) · ACS Applied Energy Materials · doi:10.1021/acsaem.5c00898 · Cited by 6
Ir atomic engineering enabling CuO nanowires for enhanced and durable alkaline oxygen evolution
Xu, X. H., Xie, R., Lin, W., Kang, L., Li, K., He, J., Wang, S., Pang, Y., Chai, G., & Wen, Z. (2025) · Journal of Energy Chemistry · doi:10.1016/j.jechem.2025.06.039 · Cited by 5
Understanding the reaction energetics of oxygen-evolving electrocatalysts
Lin, Z., Chaudhary, P., Vigil, S. A., Fratarcangeli, M., Soderstedt, C. J., Alexandrov, V., & Moreno‐Hernandez, I. A. (2025) · Energy & Environmental Science · doi:10.1039/d5ee02196k · Cited by 5
Yang, Z., Jiang, Y., Luo, Z., Zhou, X., Qian, Y., Zhu, S., Zhang, L., Zhang, Q., He, C., Ge, J., et al. (2025) · ACS Applied Materials & Interfaces · doi:10.1021/acsami.5c08709 · Cited by 5
Wu, Y., Bo, T., Li, Z., Liu, Z., Mei, L., Hu, K., Liu, Y., An, P., Zheng, L., Zeng, J., et al. (2025) · ACS Nano · doi:10.1021/acsnano.5c10140 · Cited by 5
Self-citationEfficient Hydrogen Evolution Using Pt‐Pd Catalyst with Co‐MOF as Sacrificial Template
Zhao, Q., Chen, G., Yang, J., Shen, Q., Cheng, Y., Zhang, J., Guo, Z., Ma, L., Yang, G. Y., & Zhao, Y. (2025) · Advanced Sustainable Systems · doi:10.1002/adsu.202501178 · Cited by 5
Wang, G., Shan, L., Sun, K., Liu, Y., Yang, K., Ma, Y., Zeng, L., Shi, W., Wang, T., Li, J., et al. (2025) · Nano Research Energy · doi:10.26599/nre.2025.9120208 · Cited by 6
Self-citationGong, C., Li, W., He, X., Du, X., Wang, D., Chen, H., Fang, W., Zhang, H., Zhao, L., & Chai, Y. (2026) · Acta Materialia · doi:10.1016/j.actamat.2026.121934 · Cited by 5
Self-citationSuperhydrophilic carbon-modified NiMoO4 for highly efficient overall water splitting
Guo, Y., Fan, W., Li, Y., Zhu, Y., Li, S., Gao, X., & Fan, A. (2026) · International Journal of Hydrogen Energy · doi:10.1016/j.ijhydene.2026.154163 · Cited by 5
B-site regulated Ru-based pyrochlores for acidic water oxidation
Yan, Y., Yang, Y., Yao, B., Chen, Y., Xing, H., Xu, Y., Jiao, D., 邢志财, Wang, D., & Yang, X. (2026) · 中国科学通报:英文版 · doi:10.1016/j.scib.2026.04.025 · Cited by 5
Self-citationA MOFs-derived heterostructure electrocatalyst for acidic oxygen evolution with low degradation rate
Zhang, X., Li, Y., Song, J., Liang, Y., Sun, J., Zhang, L., & Wang, J. (2026) · Nano Research Energy · doi:10.26599/nre.2026.9120228 · Cited by 5
Wu, F., Tian, F., Li, M., Qiu, L., Ren, X., He, L., Han, G., Zhang, T., Wang, X., Sheng, J., et al. (2026) · Journal of Energy Chemistry · doi:10.1016/j.jechem.2026.07.073 · Cited by 5
Zhou, F., Liu, S., Yuan, X., Shen, W., Shi, W., Xiao, K., Li, Y., Yan, C., & Qian, T. (2025) · Chemical Communications · doi:10.1039/d5cc01452b · Cited by 5
Flux Synthesis of Lattice‐Engineered Rutile Solid Solutions for Acidic Oxygen Evolution
Wang, F., Wang, W., Wang, T., Wang, X., Siniard, K. M., Fan, J., Bashir, B., Ivanov, A. S., Li, X., Li, J., et al. (2025) · Angewandte Chemie International Edition · doi:10.1002/anie.202514922 · Cited by 4
Sun, Y., Li, B., Ma, Y., Jiang, W., Chu, X., Liu, C., Lang, J., Wu, Y., & Guo, F. (2025) · Journal of Rare Earths · doi:10.1016/j.jre.2025.10.016 · Cited by 4
Du, X., Zheng, X., Lu, B., Qi, M., Zhang, L., Mushina, S., Tan, M., Mao, S., & Wang, Y. (2026) · Applied Catalysis B: Environmental · doi:10.1016/j.apcatb.2026.126598 · Cited by 5
Lattice-constant engineering of RuO 2 via Gd incorporation for active and stable water splitting
Zhu, T., Ji, S., Feng, X., Wu, Y., Yu, Z., Pi, X., Yin, S., & Xu, J. (2026) · Chemical Communications · doi:10.1039/d5cc07405c · Cited by 4
Wang, R., Kang, Q., Rui, W. A. N. G., Zong, Q., Yan, L., Wei, G., Fan, M., Gao, F., Lu, Q., & Jin, C. (2026) · Applied Catalysis B: Environmental · doi:10.1016/j.apcatb.2026.126745 · Cited by 4
In-situ engineered RuTiOx nanorods for synergistic AEM-LOM pathways enabling overall water splitting
An, B., He, H., Chen, T., Xu, Z., Liu, X., Zeng, X., Li, X., Cao, M., Shang, F., Yu, X., et al. (2026) · 中国科学通报:英文版 · doi:10.1016/j.scib.2026.04.065 · Cited by 4
Liu, Y., Deng, R., Song, Y., Tan, W., Tao, X., Luo, S., Long, D., Chen, S., & Wei, Z. (2025) · Chemical Communications · doi:10.1039/d5cc00186b · Cited by 4
Self-citationYang, Y., Wang, S., Zhang, G., Li, X., Wu, Q., Liu, H., Deng, Z., Han, X., Zhang, S., Dong, W., et al. (2025) · Angewandte Chemie · doi:10.1002/ange.202512848 · Cited by 4
Self-citationLi, J., Jiao, L., Dong, L., Hu, L., Jia, X., Chen, C., Zong, P., Zhang, Y., Sun, X., Zhai, Y., et al. (2026) · Biosensors and Bioelectronics · doi:10.1016/j.bios.2026.118435 · Cited by 4
Li, Z., Pang, H., Shao, Y., Kong, D., Zhou, H., Yang, Y., & Wang, X. (2026) · Journal of Materials Chemistry A · doi:10.1039/d5ta09524g · Cited by 4
Yao, X., Huang, L., Liu, Y., Black, R., Whittingham, A., Teimouri, Z., Higgins, D. C., Hattrick-Simpers, J. R., & Singh, C. V. (2026) · Journal of the American Chemical Society · doi:10.1021/jacs.6c07890 · Cited by 5
Self-citationSite modulation in lanthanide pyrochlores for superior acidic oxygen evolution reaction catalysis
Pang, Z., Wang, G., Chen, H., Guo, J., Wang, G., Liu, Y., & Kang, Z. (2025) · International Journal of Hydrogen Energy · doi:10.1016/j.ijhydene.2025.151011 · Cited by 4
Self-citationWang, J., Hu, Y., Cao, T., Duan, Z., Zhao, Z., Sun, Y., Gu, J., & Wang, X. (2025) · Journal of Environmental Management · doi:10.1016/j.jenvman.2025.125682 · Cited by 3
Liu, Z., Ge, J., Wang, X., Tian, H., Wang, X., Xie, G., & Ge, J. (2025) · Chemical Engineering Journal · doi:10.1016/j.cej.2025.168585 · Cited by 3
Dual Function of Mn Doping for Active and Robust Acidic Water Oxidation on RuO2
Li, D., Li, C., Cheng, S., Yin, Z., He, C., & Wang, L. (2025) · Energy & Fuels · doi:10.1021/acs.energyfuels.5c03935 · Cited by 3
Combined catalyst–pathway design for efficient and green urea synthesis
Li, Z., Xing, X., Zhang, R. Q., Zeng, X., & Chu, K. (2025) · Green Chemistry · doi:10.1039/d5gc04601g · Cited by 3
Zeng, K., Kim, I. G., Liu, F., Gao, P., Yan, L., Sivakumar, B. M., Wietsma, T., Du, Y., Zhang, Q., Yang, C., et al. (2025) · Advanced Materials · doi:10.1002/adma.202520210 · Cited by 3
Chen, B., Liu, J., Meng, H., Xiao, X., Qiang, M., Cao, R., Zhang, L., Li, Q., 史克英, Li, Z., et al. (2025) · Separation and Purification Technology · doi:10.1016/j.seppur.2025.135145 · Cited by 3
Sun, Y., Mao, Y., Hu, Y., Ran, J., Chen, K., Li, J., Shi, L., & Wang, T. (2025) · International Journal of Hydrogen Energy · doi:10.1016/j.ijhydene.2025.153258 · Cited by 3
Cao, Y., Liu, H., Li, L. T. H., Li, Z., Feng, Z., Gu, W., & Pan, H. (2026) · Carbon Neutralization · doi:10.1002/cnl2.70120 · Cited by 3
Self-citationWang, H., Wen, T., Gong, X., Ren, M., Tang, Q., Hu, A., Chen, X., & Zou, L. (2026) · Chemical Communications · doi:10.1039/d6cc00726k · Cited by 3
Zhang, W., Wang, L., Li, X., Ji, Y., Xu, G., Cao, Y., Wang, S., & Li, J. (2026) · Fuel · doi:10.1016/j.fuel.2026.139167 · Cited by 3
Zhong, S.-C., Li, J., Liu, H., Cui, Z., Tian, G.-R., Zhao, F.-C., Xiong, J.-F., Wang, L.-C., Wang, X., Wang, Y.-B., et al. (2026) · Nano Energy · doi:10.1016/j.nanoen.2026.112106 · Cited by 3
Xie, Q., Zhao, Y., Xu, Z. M., Zhang, H., Wang, Y., Zhu, L. C., Guo, Y., Lv, W., Zhang, S., & Lei, W. (2026) · Chemical Engineering Journal · doi:10.1016/j.cej.2026.178624 · Cited by 3
Mu, Y., Zhang, D., Gao, T., Wang, L., Zhang, L., Zou, X., Zheng, W., Fan, J., & Cui, X. (2025) · Angewandte Chemie · doi:10.1002/ange.202505908 · Cited by 3
Beyond chemical catalysis: laser production of clean energy
Yan, B., Cao, W., & Yang, G. (2025) · Chemical Society Reviews · doi:10.1039/d5cs00087d · Cited by 3
Modulating RuO 2 Electrocatalysis via Introducing Lanthanides for Enhanced Acidic Oxygen Evolution
Ding, Q., Xie, L., Lin, Z., Qin, Z., Li, Y., & Li, Q. (2024) · Advanced Sustainable Systems · doi:10.1002/adsu.202400747 · Cited by 3
Rapid Synthesis of Carbon-Supported Ir–Ni Bimetallic Nanoparticles for Efficient Water Oxidation
Gao, C., Wang, Y., Zhen, S., Zhan, J., Zhang, L., & Cai, B. (2025) · The Journal of Physical Chemistry C · doi:10.1021/acs.jpcc.5c03813 · Cited by 3
Sun, X., Li, X., Zong, P., Yan, D., Qin, Z., Zhang, Y., Jiao, L., Zhai, Y., & Lu, X. (2025) · Analytical Chemistry · doi:10.1021/acs.analchem.4c05534 · Cited by 2
Tuning Ru–O Coordination for Switching Redox Centers in Acidic Oxygen Evolution Electrocatalysis
Mu, Y., Fan, J., Gao, T., Wang, L., Zhang, L., Zou, X., Zheng, W., Zhang, Y., Yu, Z. G., & Cui, X. (2025) · Angewandte Chemie · doi:10.1002/ange.202504876 · Cited by 2
Wang, L., Wang, Y., Li, K., Wu, Z., & Liu, J. (2025) · Journal of Materials Chemistry A · doi:10.1039/d5ta02836a · Cited by 2
Liu, B., Zhao, Y., Wu, Y., Wen, Y., Liu, Z., Wang, P., Shu, J., & Yi, T. (2025) · Catalysis Reviews · doi:10.1080/01614940.2025.2556094 · Cited by 2
Xue, M., Ding, Y., Xu, Z., Guo, W. G., Gu, Y., Liu, X., Li, S., Li, Y., Cao, H., Cao, Y., et al. (2025) · AIChE Journal · doi:10.1002/aic.70146 · Cited by 2
Liu, H., Jiang, Y., Jiang, K., He, Z.-K., Zhong, Z., Gu, C., & Du, Y. (2025) · Advanced Functional Materials · doi:10.1002/adfm.202525512 · Cited by 2
Zhao, B., Irfan, R. M., Mahmood, A., Talib, S. H., Liu, C., & Niu, L. (2025) · Chemical Engineering Journal · doi:10.1016/j.cej.2025.171742 · Cited by 2
Lattice oxygen regeneration achieved on Ho-doped CoFeO for enhanced oxygen evolution performance
Li, X., Li, J., Han, X., Wu, D., Wang, T., Shi, W., Kang, Z., Tian, X., Yang, W., & Yuan, Y. (2025) · Chemical Engineering Journal · doi:10.1016/j.cej.2025.169831 · Cited by 2
Zhu, J., Xia, J., & Luo, W. (2025) · Chinese Journal of Structural Chemistry · doi:10.1016/j.cjsc.2025.100857 · Cited by 2
Lanthanide Nanotheranostics in Radiotherapy
Han, S., Liu, Y., Cai, T., Liu, Y., & Ge‐Zhang, S. (2025) · International Journal of Molecular Sciences · doi:10.3390/ijms27010426 · Cited by 2
Self-citationCoupled sulfur vacancies enhance oxygen evolution reaction in monolayer FeNiP2S6-x
Wang, K., Wei, Q., Guan, R., Zhang, Z., Zhang, J., Ren, H., Wei, W., Yan, Y., Song, H., Han, J., et al. (2026) · Acta Materialia · doi:10.1016/j.actamat.2025.121892 · Cited by 2
Wang, L., López-Estrada, O., Lu, S., Du, C., Soni, A., Wang, X., Wang, M., Wang, H., Singh, Z., Tirado, A. M., et al. (2026) · ACS Catalysis · doi:10.1021/acscatal.5c06756 · Cited by 2
Zhu, C., Lu, J., Wang, C., Xia, M., Hu, S., & Cao, Y. (2026) · Chemical Communications · doi:10.1039/d5cc06127j · Cited by 2
Yu, D., Liu, B., Li, D.-M., Yu, J., Lan, X., Liu, S., Li, Z., Gao, P., Zhang, Y., & Zhao, H. Y. (2026) · Chemical Science · doi:10.1039/d6sc01575a · Cited by 2
Controllable oxygen vacancy induced Ru–O constraint ability for enhanced water oxidation
Yu, Y., Huang, G., Wang, W., Zhou, Y., Bai, Y., Wen, H., Liang, Y., Su, F., Sun, H., Gao, H., et al. (2026) · Nano Materials Science · doi:10.1016/j.nanoms.2026.03.008 · Cited by 2
Li, C.-H., Yuan, C., Wang, L., Liu, D., Zhang, Y., Zhang, X., Hui, K. N., 叶树峰, & Chen, Y. (2026) · Journal of Energy Chemistry · doi:10.1016/j.jechem.2026.04.035 · Cited by 2
Han, S., Liu, Y., Wang, X., Zeng, X., Chen, J. F., & Cao, D. (2026) · Advanced Functional Materials · doi:10.1002/adfm.75629 · Cited by 2
Self-citationPeng, Q., Fang, S. R., Lin, H., Huang, Y., Lin, M., Fu, H., Mao, X., Mao, F., Liu, P., & Yang, H. G. (2026) · Chinese Chemical Letters · doi:10.1016/j.cclet.2026.112919 · Cited by 2
Doping strategies for RuO2 catalysts to boost acidic oxygen evolution performance
Lu, Q., Zou, X., An, L., & Wang, Y. (2026) · Journal of Energy Chemistry · doi:10.1016/j.jechem.2026.06.006 · Cited by 2
Sun, H.-Y., Li, C.-X., Xu, N., Chai, Y., & Dong, B. (2026) · Nanoscale · doi:10.1039/d6nr01469k · Cited by 2
Turing-type high-entropy oxide nanosheets for efficient seawater electrolysis
Liu, Y., 郝立宾, Li, Y., Jin, J., Chen, L., Xue, L., Hou, Z. X., Zhang, W., Wang, X., Xiong, P., et al. (2026) · Science Advances · doi:10.1126/sciadv.aeb2204 · Cited by 2
Self-citationLi, Y., Xu, J., Lan, F., Wang, Y., Jiang, H., Wu, X., Huang, Y., Li, R., Jiang, Q., Gao, D., et al. (2024) · Angewandte Chemie · doi:10.1002/ange.202420481 · Cited by 2
Boosting oxygen evolution of LiCoO2 electrocatalysts via lithium defect
Li, H., Li, M., Liao, L., Yang, H., Xiang, K., Luo, G., & Xie, M. (2024) · Materials Today Catalysis · doi:10.1016/j.mtcata.2024.100087 · Cited by 3
Yu, Y., Zhang, G., Wang, R., An, P., Chu, S., Yue, L., Sui, M., & Dong, J. (2025) · Chemical Communications · doi:10.1039/d5cc04003e · Cited by 2
Self-citationZhu, W., Ma, M., Gao, D., Chen, J., Huang, H., Feng, K., Wang, Q., Wu, J., Li, P., Guo, J., et al. (2025) · Angewandte Chemie · doi:10.1002/ange.202423353 · Cited by 1
Self-citationZhou, Z., Zhu, M., Song, C., Tang, M., Li, S., Meng, X., Sun, Y., & Dai, Y. (2025) · Nanoscale · doi:10.1039/d5nr00898k · Cited by 1
Electrospinning-controlled calcination conditions fabrication of RuO2/Ru nanofibers for acidic OER
Ni, J., Han, Y., Xie, X., Yang, C., & Geng, S. (2025) · Molecular Catalysis · doi:10.1016/j.mcat.2025.115418 · Cited by 1
Self-citationLi, J., Wu, G., Shi, Y., Xiao, H., Jin, Q., Lv, M., & Hong, X. (2025) · Nano Research · doi:10.26599/nr.2025.94907956 · Cited by 1
Tao, J., Fang, B., Fang, Z., Lin, G., Ji, Z., Gao, C., Gao, R., & Qiu, H. (2025) · Angewandte Chemie · doi:10.1002/ange.202512348 · Cited by 1
Wang, K., Luo, K., Liang, X., Liu, J., Ran, F., Wang, K., He, J.-Y., Li, Y., & Sun, W. (2025) · International Journal of Hydrogen Energy · doi:10.1016/j.ijhydene.2025.151186 · Cited by 2
Chen, H., Jiang, Y. Y., Wu, H. B., Yuan, W., & Wang, Y. (2025) · Advanced Materials · doi:10.1002/adma.202506352 · Cited by 1
Boosting Acidic OER Performance Via Transition Metal Doping in Iridium/Ruthenium Oxides
Li, W., Du, B., Yan, Z., Fan, Z., Ci, W., Huang, Z., Zhang, B., & Ren, X. (2025) · Chemistry - An Asian Journal · doi:10.1002/asia.70312 · Cited by 1
Wang, Y., Que, X., Hu, T., Zhang, Z., Peng, J., Wang, Y., Li, J., Xu, L. F., & Zhai, M. (2025) · Chemical Engineering Journal · doi:10.1016/j.cej.2025.168604 · Cited by 1
Tang, T., Cao, Y., Li, M., Cui, S., Wu, Y., Yu, Z., Cui, W., & Zhao, H. (2025) · Chemical Engineering Science · doi:10.1016/j.ces.2025.122672 · Cited by 1
Flux Synthesis of Lattice‐Engineered Rutile Solid Solutions for Acidic Oxygen Evolution
Wang, F., Wang, W., Wang, T., Wang, X., Siniard, K. M., Fan, J., Bashir, B., Ivanov, A. S., Li, X., Li, J., et al. (2025) · Angewandte Chemie · doi:10.1002/ange.202514922 · Cited by 1
Advances in orbital hybridization for improving oxygen evolution reaction
Li, L., Bai, M., Yuan, W., Du, B., & Chu, X. (2025) · Fuel · doi:10.1016/j.fuel.2025.137875 · Cited by 1
Self-citationVisual electron orbital engineering enables industrially durable acidic OER on Ir Co0.3-Ru0.7O2
Wu, H., Cui, P., Wu, L., Su, H., Gao, Q., Lu, Z., Zhang, Q., Liu, S., Cang, R., Ma, X., et al. (2025) · Journal of Colloid and Interface Science · doi:10.1016/j.jcis.2025.139654 · Cited by 1
Self-citation
Metadata
- Authors
- Li, L., Zhang, G., Zhou, C., Lv, F., Tan, Y., Han, Y., Luo, H., Wang, D., Liu, Y., Shang, C., Zeng, L., Huang, Q., Zeng, R., Ye, N., Luo, M., & Guo, S.
- Affiliations
- Peking University (CN)
- Kunming University of Science and Technology (CN)
- Corresponding author
- Guo, Shaojun
- ORCID
- Venue
- Nature Communications
- Published
- 2024-06-11
- Volume
- 15
- Issue
- 1
- Pages
- 4974-4974
- ISSN
- 2041-1723 (ISSN-L)
- PMC
- PMC11166638
- OpenAlex
- W4399539823
- Cited by
- 368
- References
- 37
- Citations by year
- 2026: 121 · 2025: 206 · 2024: 41
- FWCI
- 24.53
- Type
- journal article
- Language
- en
- Open access
- gold
- doi.org
- Locations
- Nature Communications (publishedVersion, cc-by)
- PubMed Central (publishedVersion, cc-by)
- PubMed (publishedVersion)
- RePEc: Research Papers in Economics (submittedVersion)
- DOAJ (DOAJ: Directory of Open Access Journals) (submittedVersion)
- Funders
- Salt Science Research Foundation (BL14W1)
- National Natural Science Foundation of China (52261135633, 52303363, 22105007, 22309004, 52333010, 22205010, 52025133)
- China Postdoctoral Science Foundation (2022M710187, 2020M670018, 2023M730051, 2023M730029, 2022M720225)
- China National Petroleum Corporation (2021DQ02-1002)
- Peking University (2021DQ02-1002)
- National Postdoctoral Program for Innovative Talents (BX20220009)
- Beijing Synchrotron Radiation Facility (BL14W1)
- Topics
- Physical Sciences › Energy › Renewable Energy, Sustainability and the Environment › Electrocatalysts for Energy Conversion
- Physical Sciences › Engineering › Electrical and Electronic Engineering › Fuel Cells and Related Materials
- Physical Sciences › Energy › Renewable Energy, Sustainability and the Environment › CO2 Reduction Techniques and Catalysts
- Keywords
- lanthanide doping, acidic oxygen evolution reaction, proton exchange membrane water electrolysis, catalyst stability, coordination environment, volcano plot, electrocatalyst degradation
About these checks
Registry, retraction, Cites and statistics results are computed, not judged, with one exception: a printed reference that no index lists is read once by a model before it counts as a citation error. Claims are extracted by a model and kept only when their quote appears verbatim in the text; each cited source is then checked, with a model’s help, for whether it says what the claim relies on. Those verdicts can be wrong — read the claim’s quote and the cited source before relying on one.
Statistics and arithmetic are recomputed, not judged.
Confidence bands are shown only for fields calibrated on our annotated test set. None is calibrated yet, so no band is shown.
What counts as a claim ›How we measure confidence ›How we check this ›
Are you an author, or do you see a problem with this page? Request a review
