

The DOI matches its Crossref record; 5 of the 5 references it cites were found in a registry or an index.
Developmental hematopoietic stem cell variation explains clonal hematopoiesis later in life
Published version of a preprint
Abstract
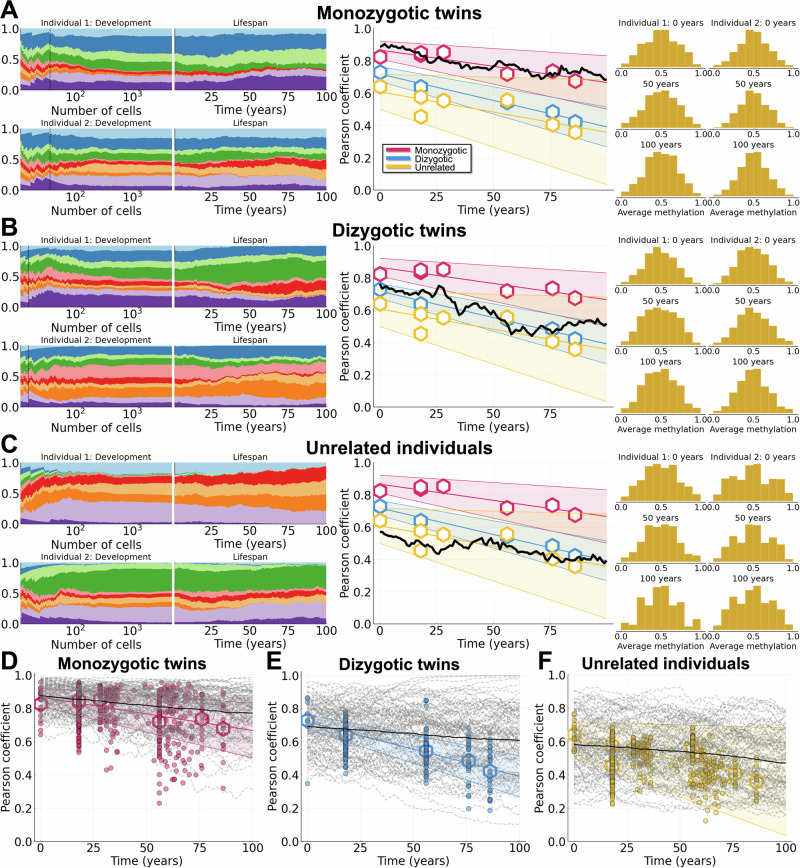
Clonal hematopoiesis becomes increasingly common with age, but its cause is enigmatic because driver mutations are often absent. Serial observations infer weak selection indicating variants are acquired much earlier in life with unexplained initial growth spurts. Here we use fluctuating CpG methylation as a lineage marker to track stem cell clonal dynamics of hematopoiesis. We show, via the shared prenatal circulation of monozygotic twins, that weak selection conferred by stem cell variation created before birth can reliably yield clonal hematopoiesis later in life. Theory indicates weak selection will lead to dominance given enough time and large enough population sizes. Human hematopoiesis satisfies both these conditions. Stochastic loss of weakly selected variants is naturally prevented by the expansion of stem cell lineages during development. The dominance of stem cell clones created before birth is supported by blood fluctuating CpG methylation patterns that exhibit low correlation between unrelated individuals but are highly correlated between many elderly monozygotic twins. Therefore, clonal hematopoiesis driven by weak selection in later life appears to reflect variation created before birth.
Overview
The claims and statistics of this paper haven’t been checked yet.
Run the check — free, no account needed. It reads the open-access text and checks the sources it cites.
Integrity signals
Registry
Cites
Statistics
Figures
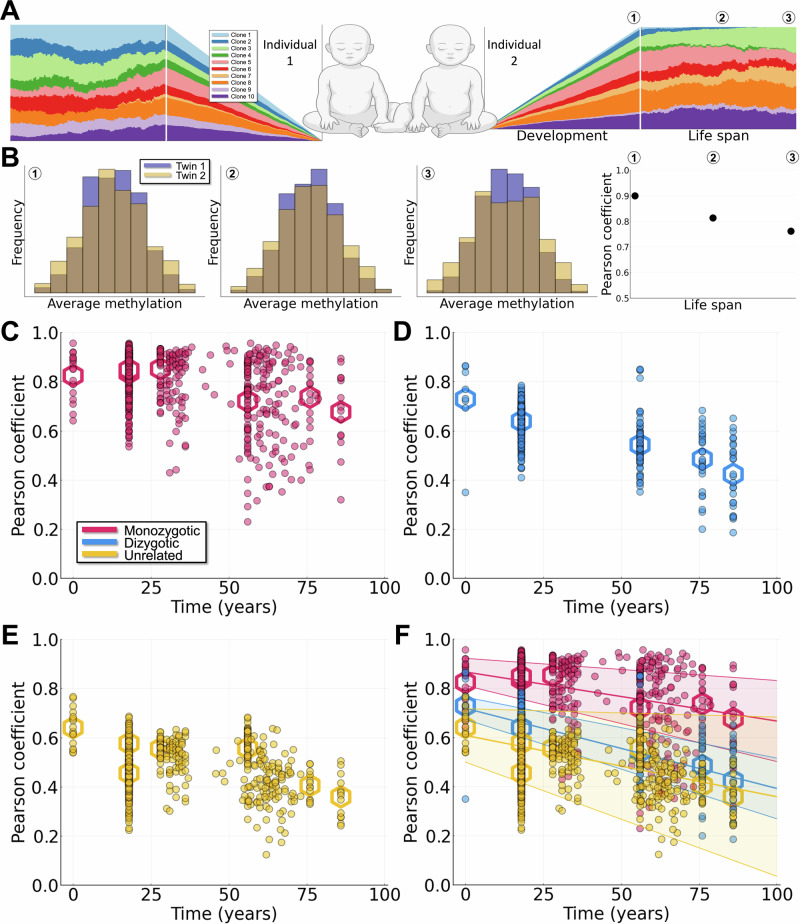
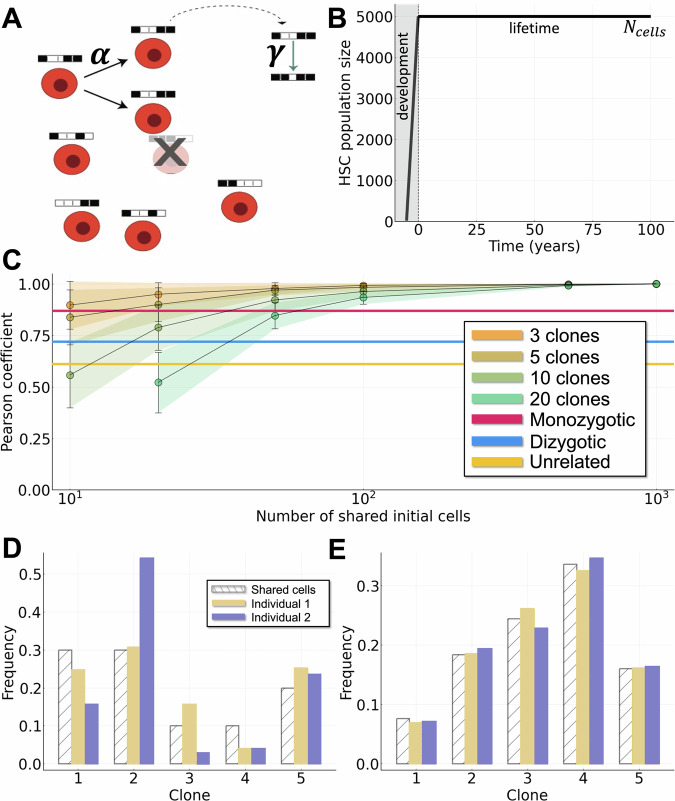
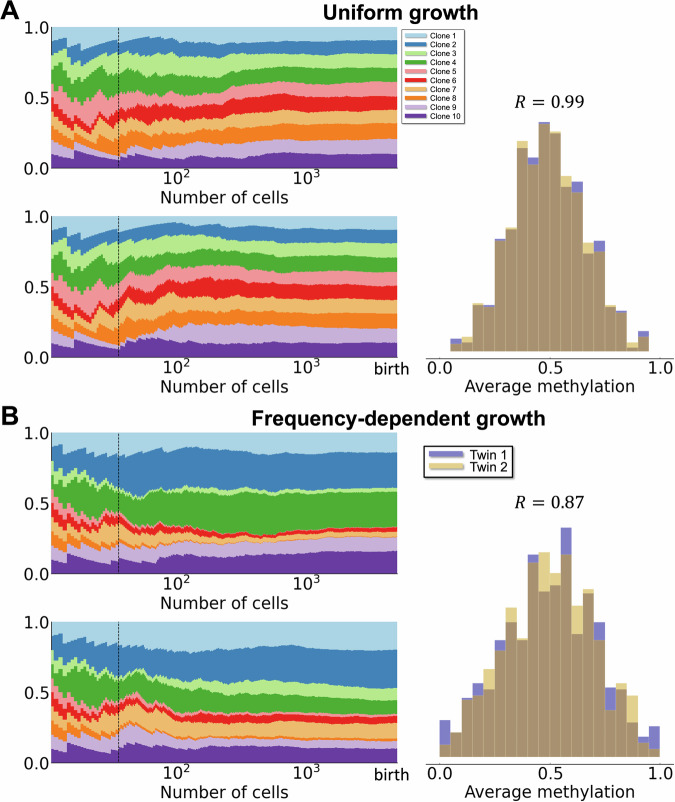
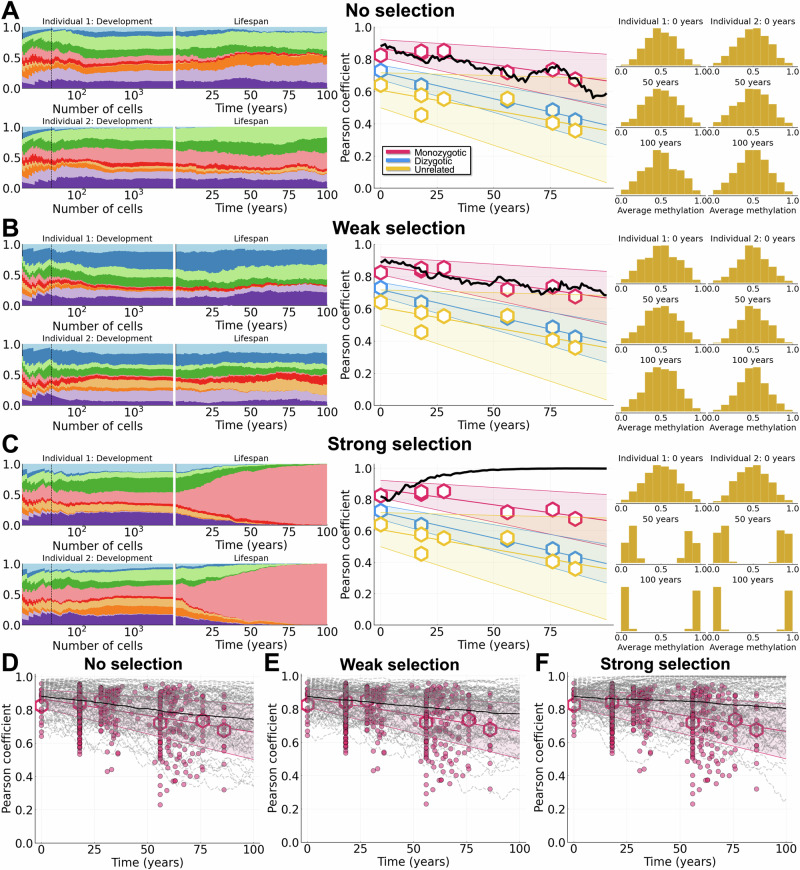
Verification
Claims the paper makes
The claims and statistics of this paper haven’t been checked yet.
Run the check — free, no account needed. It reads the open-access text and checks the sources it cites.
Claims other papers make about this one
Each is checked against this paper’s own text: does it say what the citing paper says it does?
In the citing paper
“Consistent with this idea, a recent study of bulk methylome profiles from blood cells in monozygotic twins suggested that clone-associated variation of the methylome may be established during embryonic development48.”
From Clonal tracing with somatic epimutations reveals dynamics of blood ageing (2025) · cites this paper as [48]
Self-check
Percentages, sums and reported differences re-computed from the paper’s own numbers.
The self-check needs the paper’s full text.
Citations
Cites
A Mathematical Theory of Natural and Artificial Selection, Part V: Selection and Mutation
Haldane, J. B. S. (1927) · Mathematical Proceedings of the Cambridge Philosophical Society · doi:10.1017/s0305004100015644 · Cited by 1,326
The evolutionary dynamics and fitness landscape of clonal hematopoiesis
Watson, C. J., Papula, A. L., Poon, G. Y. P., Wong, W. H., Young, A. L., Druley, T. E., Fisher, D. S., & Blundell, J. R. (2020) · Science · doi:10.1126/science.aay9333 · Cited by 444
The longitudinal dynamics and natural history of clonal haematopoiesis
Fabre, M. A., de Almeida, J. G., Fiorillo, E., Mitchell, E., Damaskou, A., Rak, J., Orrù, V., Marongiu, M., Chapman, M. S., Vijayabaskar, M. S., et al. (2022) · Nature · doi:10.1038/s41586-022-04785-z · Cited by 374
Tang, D., Tao, S., Chen, Z., Koliesnik, I. O., Calmes, P. G., Hoerr, V., Han, B., Gebert, N., Zörnig, M., Löffler, B., et al. (2016) · Journal of Experimental Medicine · doi:10.1084/jem.20151100 · Cited by 133
Kandaswamy, R., Hannon, E., Arseneault, L., Mansell, G., Sugden, K., Williams, B., Burrage, J., Staley, J. R., Pishva, E., Dahir, A., et al. (2021) · Epigenetics · doi:10.1080/15592294.2020.1853317 · Cited by 36
Research works printed but not linked: 72
- Haas, S., Trumpp, A. & Milsom, M. D. Causes and Consequences of Hematopoietic Stem Cell Heterogeneity. Cell Stem Cell 22, 627–638 (2018). · DOI
- Zink, F. et al. Clonal hematopoiesis, with and without candidate driver mutations, is common in the elderly. Blood 130, 742–752 (2017). · DOI · Paper page
- Robertson, N. A. et al. Longitudinal dynamics of clonal hematopoiesis identifies gene-specific fitness effects. Nat. Med. 28, 1439–1446 (2022). · DOI · Paper page
- Uddin, M. M. et al. Long-term longitudinal analysis of 4,187 participants reveals insights into determinants of clonal hematopoiesis. Nat. Commun. 15, 7858 (2024). · DOI
- Fabre, M. A. & Vassiliou, G. S. The lifelong natural history of clonal hematopoiesis and its links to myeloid neoplasia. Blood 143, 573–581 (2024). · DOI
- Ahmad, H., Jahn, N. & Jaiswal, S. Clonal Hematopoiesis and Its Impact on Human Health. Annu. Rev. Med. 74, 249–260 (2023). · DOI · Paper page
- MacLean, A. L., Lo Celso, C. & Stumpf, M. P. H. Concise review: stem cell population biology: insights from hematopoiesis. Stem Cells (Dayt., Ohio) 35, 80–88 (2017). · DOI
- Greaves, M. & Maley, C. C. Clonal evolution in cancer. Nature 481, 306–313 (2012). · DOI · Paper page
- Wu, W.-C. et al. Circulating hematopoietic stem and progenitor cells are myeloid-biased in cancer patients. Proc. Natl. Acad. Sci. 111, 4221–4226 (2014). · DOI
- Stadler, T., Pybus, O. G. & Stumpf, M. P. H. Phylodynamics for cell biologists. Science 371, eaah6266 (2021). · DOI
- Arends, C. M. & Jaiswal, S. Dynamics of clonal hematopoiesis and risk of hematologic malignancy. Int. J. Hematol. https://doi.org/10.1007/s12185-024-03829-6 (2024). · DOI
- Uddin, Md. M. et al. Clonal hematopoiesis of indeterminate potential, DNA methylation, and risk for coronary artery disease. Nat. Commun. 13, 5350 (2022). · DOI
- Mitchell, E. et al. Clonal dynamics of haematopoiesis across the human lifespan. Nature 606, 343–350 (2022). · DOI · Paper page
- Stacey, S. N. et al. Genetics and epidemiology of mutational barcode-defined clonal hematopoiesis. Nat. Genet. https://www.nature.com/articles/s41588-023-01555-z (2023).
- Weinstock, J. S. et al. Aberrant activation of TCL1A promotes stem cell expansion in clonal haematopoiesis. Nature 616, 755–763 (2023). · DOI · Paper page
- Kimura, M. On the probability of fixation of mutant genes in a population. Genetics 47, 713–719 (1962). · DOI
- Johnson, B., Shuai, Y., Schweinsberg, J. & Curtius, K. clonerate: fast estimation of single-cell clonal dynamics using coalescent theory. Bioinformatics 39, btad561 (2023). · DOI
- Fabre, M. A. et al. Concordance for clonal hematopoiesis is limited in elderly twins. Blood 135, 269–273 (2020). · DOI
- Ghersi, J. J. et al. Haematopoietic stem and progenitor cell heterogeneity is inherited from the embryonic endothelium. Nat. Cell Biol. 25, 1135–1145 (2023). · DOI · Paper page
- Wright, S. Evolution in Mendelian populations. Genetics 16, 97 (1931). · DOI
- Fisher, R. A. The evolution of dominance in certain polymorphic species. Am. Naturalist 64, 385–406 (1930). · DOI
- Moran, P. A. P. Random processes in genetics. Math. Proc. Camb. Philos. Soc. 54, 60–71 (1958). · DOI
- Levin, S. A. Dispersion and Population Interactions. Am. Naturalist 108, 207–228 (1974). · DOI
- Levin, S. A. & Powell, T. M.Patch Dynamics, vol. 96 of Lecture Notes in Biomathematics (Springer-Verlag Berlin Heidelberg, https://doi.org/10.1007/978-3-642-50155-5 1993). · DOI
- Otto, S. P. & Whitlock, M. C. The probability of fixation in populations of changing size. Genetics 146, 723–733 (1997). · DOI
- Patwa, Z. & Wahl, L. The fixation probability of beneficial mutations. J. R. Soc. Interface 5, 1279–1289 (2008). · DOI
- Nicholson, A. M. et al. Fixation and spread of somatic mutations in adult human colonic epithelium. Cell Stem Cell 22, 909–918.e8 (2018). · DOI
- Cosgrove, J., Hustin, L. S. P., de Boer, R. J. & Perié, L. Hematopoiesis in numbers. Trends Immunol. 42, 1100–1112 (2021). · DOI
- Marceau, K. et al. The prenatal environment in twin studies: a review on chorionicity. Behav. Genet. 46, 286–303 (2016). · DOI
- van Beijsterveldt, C. E. M. et al. Chorionicity and heritability estimates from twin studies: the prenatal environment of twins and their resemblance across a large number of traits. Behav. Genet. 46, 304–314 (2016). · DOI
- Hansen, J. W. et al. Clonal hematopoiesis in elderly twins: concordance, discordance, and mortality. Blood 135, 261–268 (2020). · DOI
- Trejo, V. et al. X Chromosome inactivation patterns correlate with fetal-placental anatomy in monozygotic twin pairs: implications for immune relatedness and concordance for autoimmunity. Mol. Med. 1, 62–70 (1994). · DOI
- Kristiansen, M. et al. Twin study of genetic and aging effects on X chromosome inactivation. Eur. J. Hum. Genet. 13, 599–606 (2005). · DOI
- Gabbutt, C. et al. Fluctuating methylation clocks for cell lineage tracing at high temporal resolution in human tissues. Nat. Biotechnol. 40, 720–730 (2022). · DOI · Paper page
- Müllers, S. M., McAuliffe, F. & Malone, F. D. 44 - Multiple Pregnancy. In Pandya, P. P., Oepkes, D., Sebire, N. J. & Wapner, R. J. (eds.) Fetal Medicine (Third Edition), 532–553.e6 (Elsevier, London, 2020). https://www.sciencedirect.com/science/article/pii/B9780702069567000440 · DOI
- Wenstrom, K. D., Tessen, J. A., Zlatnik, F. J. & Sipes, S. L. Frequency, distribution, and theoretical mechanisms of hematologic and weight discordance in monochorionic twins. Obstet. Gynecol. 80, 257 (1992).
- Park, S. et al. Clonal dynamics in early human embryogenesis inferred from somatic mutation. Nature 597, 393–397 (2021). · DOI
- Svensson, E. I. & Connallon, T. How frequency-dependent selection affects population fitness, maladaptation and evolutionary rescue. Evolut. Appl. 12, 1243–1258 (2019). · DOI
- Waxman, D. A unified treatment of the probability of fixation when population size and the strength of selection change over time. Genetics 188, 907–913 (2011). · DOI
- Lo Celso, C. & Scadden, D. T. The haematopoietic stem cell niche at a glance. J. Cell Sci. 124, 3529–3535 (2011). · DOI
- Paul, F. et al. Transcriptional heterogeneity and lineage commitment in myeloid progenitors. Cell 163, 1663–1677 (2015). · DOI · Paper page
- Rodriguez-Fraticelli, A. E. et al. Single-cell lineage tracing unveils a role for TCF15 in haematopoiesis. Nature 583, 585–589 (2020). · DOI · Paper page
- Ranzoni, A. M. et al. Integrative Single-Cell RNA-Seq and ATAC-Seq analysis of human developmental hematopoiesis. Cell Stem Cell 28, 472–487.e7 (2021). · DOI · Paper page
- Pei, W. et al. Resolving Fates and Single-Cell Transcriptomes of Hematopoietic Stem Cell Clones by PolyloxExpress Barcoding. Cell Stem Cell 27, 383–395.e8 (2020). · DOI · Paper page
- Sun, J. et al. Clonal dynamics of native haematopoiesis. Nature 514, 322–327 (2014). · DOI · Paper page
- Haltalli, M. L. R. et al. Manipulating niche composition limits damage to haematopoietic stem cells during Plasmodium infection. Nat. Cell Biol. 22, 1399–1410 (2020). · DOI
- Kessler, M. D. et al. Common and rare variant associations with clonal haematopoiesis phenotypes. Nature 612, 301–309 (2022). · DOI · Paper page
- Bao, E. L. et al. Inherited myeloproliferative neoplasm risk affects haematopoietic stem cells. Nature 586, 769–775 (2020). · DOI
- Brown, D. W. et al. Shared and distinct genetic etiologies for different types of clonal hematopoiesis. Nat. Commun. 14, 5536 (2023). · DOI
- Maley, C. C. et al. Classifying the evolutionary and ecological features of neoplasms. Nat. Rev. Cancer 17, 605–619 (2017). · DOI
- Weng, C. et al. Deciphering cell states and genealogies of human haematopoiesis. Nature 627, 389–398 (2024). · DOI · Paper page
- Watson, C. J. et al. Evolutionary dynamics in the decades preceding acute myeloid leukaemia. https://www.biorxiv.org/content/10.1101/2024.07.05.602251v1 (2024). · DOI
- Christie, M. R. & McNickle, G. G. Negative frequency dependent selection unites ecology and evolution. Ecol. Evolution 13, e10327 (2023). · DOI
- Barrett, T. et al. NCBI GEO: archive for functional genomics data sets-update. Nucleic Acids Res. 41, D991–D995 (2013). · DOI · Paper page
- K Mogensen, P. & N Riseth, A. Optim: A mathematical optimization package for Julia. J. Open Source Softw. 3, 615 (2018). · DOI
- Pearson, K. & Galton, F. VII. Note on regression and inheritance in the case of two parents. Proc. R. Soc. Lond. 58, 240–242 (1997).
- Cedar, H. & Bergman, Y. Programming of DNA methylation patterns. Annu. Rev. Biochem. 81, 97–117 (2012). · DOI
- Besançon, M. et al. Distributions.jl: Definition and modeling of probability distributions in the juliastats ecosystem. J. Stat. Softw. 98, 1–30 (2021). · DOI
- Kousathanas, A. & Keightley, P. D. A comparison of models to infer the distribution of fitness effects of new mutations. Genetics 193, 1197–1208 (2013). · DOI
- Kim, B. Y., Huber, C. D. & Lohmueller, K. E. Inference of the distribution of selection coefficients for new nonsynonymous mutations using large samples. Genetics 206, 345–361 (2017). · DOI
- Huber, C. D., Kim, B. Y., Marsden, C. D. & Lohmueller, K. E. Determining the factors driving selective effects of new nonsynonymous mutations. Proc. Natl. Acad. Sci. USA 114, 4465–4470 (2017). · DOI
- Bezanson, J., Edelman, A., Karpinski, S. & Shah, V. B. Julia: a fresh approach to numerical computing. SIAM Rev. 59, 65–98 (2017). · DOI · Paper page
- Roesch, E. et al. Julia for biologists. Nat. Methods 20, 655–664 (2023). · DOI
- Gordon, L. et al. Neonatal DNA methylation profile in human twins is specified by a complex interplay between intrauterine environmental and genetic factors, subject to tissue-specific influence. Genome Res. 22, 1395–1406 (2012). · DOI
- Hannon, E. et al. Characterizing genetic and environmental influences on variable DNA methylation using monozygotic and dizygotic twins. PLoS Genet. 14, e1007544 (2018). · DOI
- Ollikainen, M. et al. Genome-wide blood DNA methylation alterations at regulatory elements and heterochromatic regions in monozygotic twins discordant for obesity and liver fat. Clin. Epigenetics 7, 39 (2015). · DOI
- Tan, Q. et al. Epigenetic signature of birth weight discordance in adult twins. BMC Genomics 15, 1062 (2014). · DOI
- Roos, L. et al. Integrative DNA methylome analysis of pan-cancer biomarkers in cancer discordant monozygotic twin-pairs. Clin. Epigenetics 8, 7 (2016). · DOI
- Li, S. et al. Genetic and environmental causes of variation in the difference between biological age based on DNA methylation and chronological age for middle-aged women. Twin Res. Hum. Genet.: Off. J. Int. Soc. Twin Stud. 18, 720–726 (2015). · DOI
- Tan, Q. et al. Epigenetic drift in the aging genome: a ten-year follow-up in an elderly twin cohort. Int. J. Epidemiol. 45, 1146–1158 (2016).
- Ushijima, T. et al. Fidelity of the methylation pattern and its variation in the genome. Genome Res. 13, 868–874 (2003). · DOI
- Crofts, S. J. C., Latorre-Crespo, E. & Chandra, T. DNA methylation rates scale with maximum lifespan across mammals. https://www.biorxiv.org/content/10.1101/2023.05.15.540689v1 (2023). · DOI
Cited by
Clonal tracing with somatic epimutations reveals dynamics of blood ageing
Scherer, M., Singh, I., Braun, M. M., Szu-Tu, C., Sanchez Sanchez, P., Lindenhofer, D., Jakobsen, N. A., Körber, V., Kardorff, M., Nitsch, L., et al. (2025) · Nature · doi:10.1038/s41586-025-09041-8 · Cited by 89
Metadata
- Authors
- Kreger, J., Mooney, J. A., Shibata, D., & MacLean, A. L.
- Venue
- Nature Communications
- Published
- 2024-11-26
- Volume
- 15
- Issue
- 1
- ISSN
- 2041-1723
- PMC
- PMC11599844
- Cited by
- 12
- References
- 5
- Language
- en
- Funders
- U.S. Department of Health & Human Services | National Institutes of Health (R35GM143019)
About these checks
Registry, retraction, Cites and statistics results are computed, not judged, with one exception: a printed reference that no index lists is read once by a model before it counts as a citation error. Claims are extracted by a model and kept only when their quote appears verbatim in the text; each cited source is then checked, with a model’s help, for whether it says what the claim relies on. Those verdicts can be wrong — read the claim’s quote and the cited source before relying on one.
Statistics and arithmetic are recomputed, not judged.
Confidence bands are shown only for fields calibrated on our annotated test set. None is calibrated yet, so no band is shown.
What counts as a claim ›How we measure confidence ›How we check this ›
Are you an author, or do you see a problem with this page? Request a review
