Cited by 123Neuroinflammation and Neurodegeneration MechanismsAlzheimer's disease research and treatmentsNeurological Disease Mechanisms and Treatments

The DOI matches its Crossref record; 76 of the 76 references it cites were found in a registry or an index.

Homeostatic Microglia Initially Seed and Activated Microglia Later Reshape Amyloid Plaques in Alzheimer's Disease

Open access

Published version of a preprint

Abstract

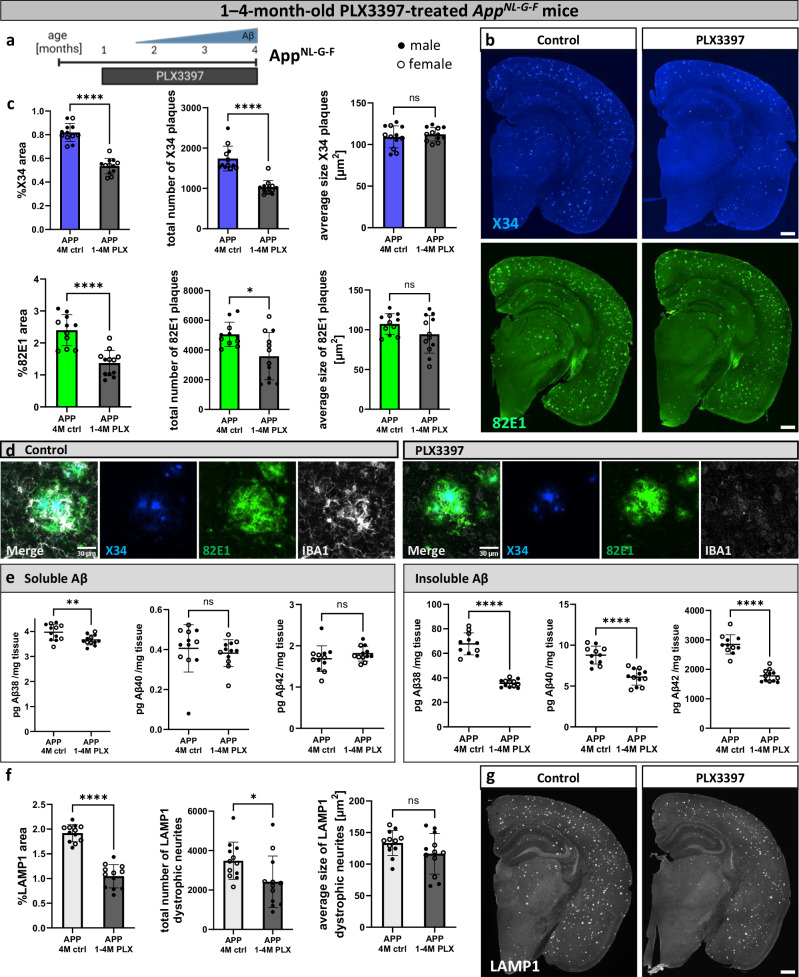
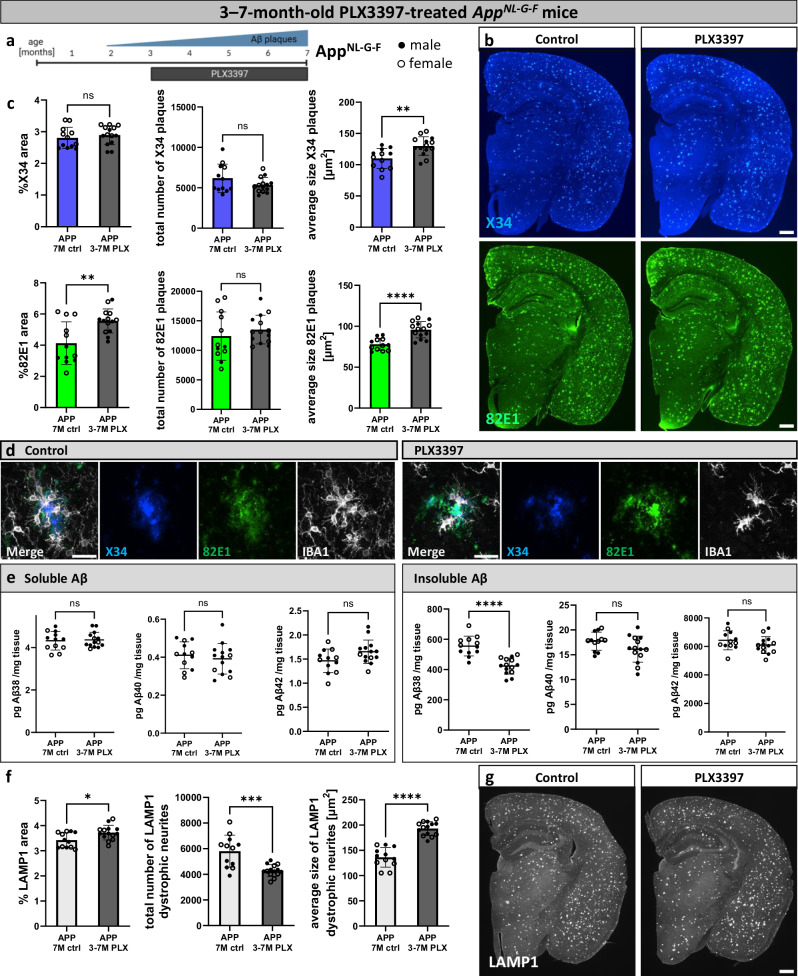
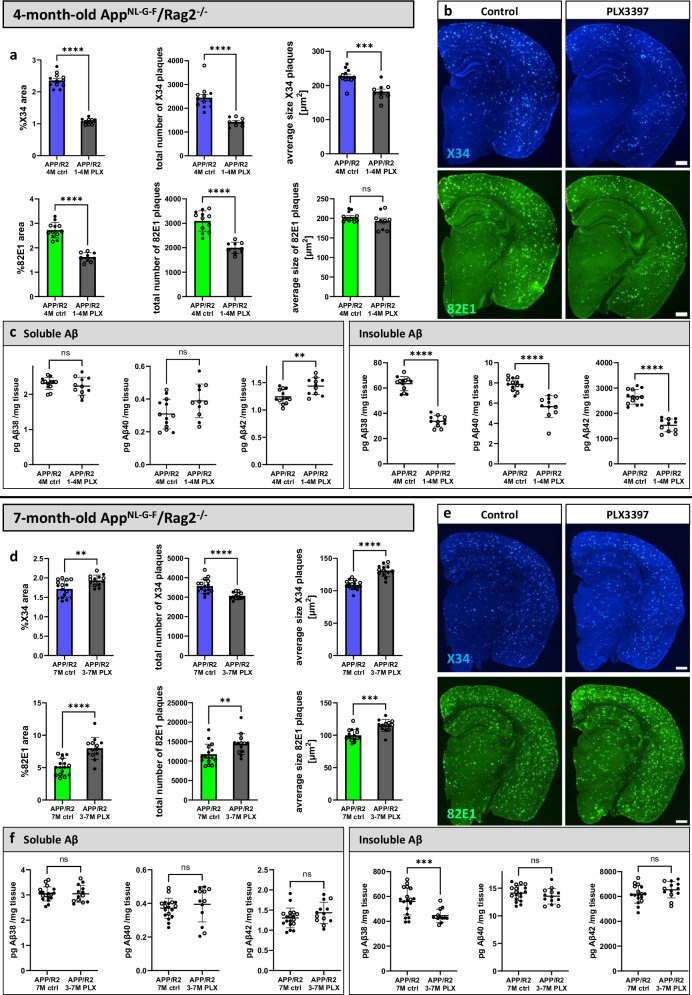
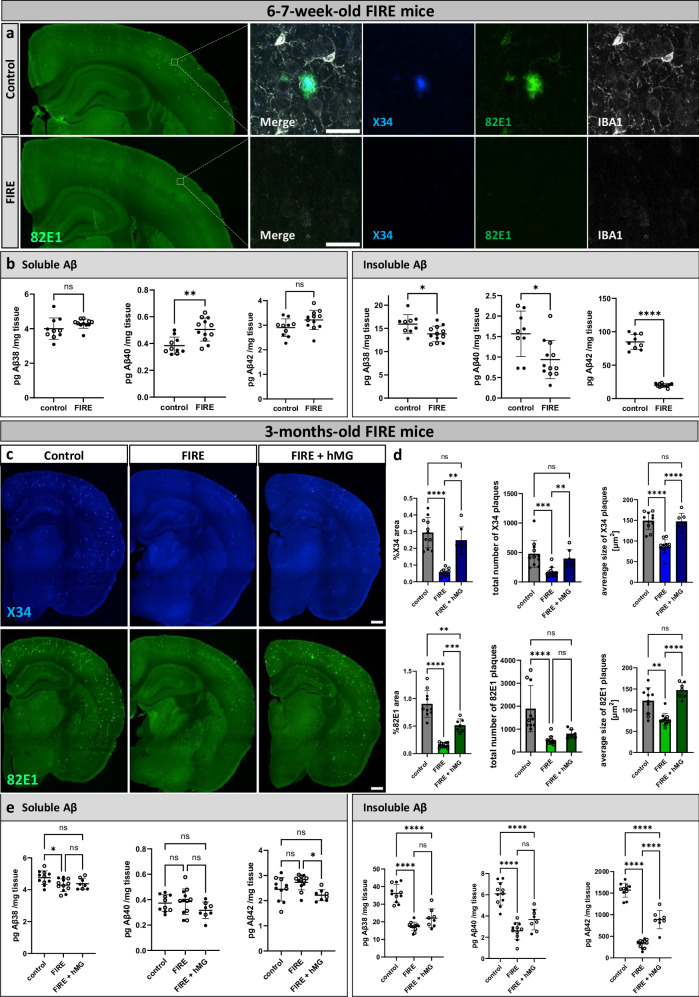
The role of microglia in the amyloid cascade of Alzheimer’s disease (AD) is debated due to conflicting findings. Using a genetic and a pharmacological approach we demonstrate that depletion of microglia before amyloid-β (Aβ) plaque deposition, leads to a reduction in plaque numbers and neuritic dystrophy, confirming their role in plaque initiation. Transplanting human microglia restores Aβ plaque formation. While microglia depletion reduces insoluble Aβ levels, soluble Aβ concentrations stay consistent, challenging the view that microglia clear Aβ. In later stages, microglial depletion decreases plaque compaction and increases neuritic dystrophy, suggesting a protective role. Human microglia with the TREM2 R47H/R47H mutation exacerbate plaque pathology, emphasizing the importance of non-reactive microglia in the initiation of the amyloid cascade. Adaptive immune depletion ( Rag2 -/- ) does not affect microglia’s impact on plaque formation. These findings clarify conflicting reports, identifying microglia as key drivers of amyloid pathology, and raise questions about optimal therapeutic strategies for AD.

Overview

The claims and statistics of this paper haven’t been checked yet.

Run the check — free, no account needed. It reads the open-access text and checks the sources it cites.

A few free checks a day · papers already verified open instantly · results are public

Integrity signals

Registry

Crossref · 10.1038/s41467-024-54779-w

Cites

76 of 76 references verified0 citation errors · 0 not checkable

Statistics

Figures

Fig. 1 Microglia seed early amyloid plaques. a Treatment scheme. AppNL-G-F mice (APP) were fed PLX3397 from 1 month until analysis at 4 months of age (1−4 M PLX) or a control diet (4 M ctrl). Created in BioRender. Cherretté, E. (2024) https://BioRender.com/u17o338. b Representative confocal images of amyloid plaques in the brain, stained with X34 (fibrillar plaques) or 82E1 (total Aβ). c Quantification of amyloid plaques in the whole brain (%X34 area: two-tailed t-test, n(ctrl) = 12, n(PLX) = 12, p = 0.0000000016; total number of X34 plaques: two-tailed Mann-Whitney test, n(ctrl) = 12, n(PLX) = 12), p = 0.000002; average size X34 plaques: two-tailed t-test, n(ctrl) = 12, n(PLX) = 12, p = 0.5098; %82E1 area: two-tailed d t-test, n(ctrl) = 11, n(PLX) = 12, p = 0.000015; total number of 82E1 plaques: two-tailed t-test with Welch’s correction, n(ctrl) = 11, n(PLX) = 12), p = 0.012; average size 82E1 plaques: two-tailed t-test, n(ctrl) = 11, n(PLX) = 12, p = 0.1225). d Higher magnification images of amyloid plaques and microglia in control and PLX3397-treated mice. e ELISA of amyloid levels in soluble and insoluble cortex extracts (sol. Aβ38: two-tailed t-test, n(ctrl) = 12, n(PLX) = 12), p = 0.0098; sol. Aβ40: two-tailed Mann-Whitney test, n(ctrl) = 12, n(PLX) = 12), p = 0.1725; sol. Aβ42: two-tailed t-test, n(ctrl) = 12, n(PLX) = 12), p = 0.2571; insol. Aβ38: two-tailed t-test with Welch’s correction, n(ctrl) = 11, n(PLX) = 12, p = 0.00000009; insol. Aβ40: two-tailed t-test, n(ctrl) = 11, n(PLX) = 12, p = 0.000004; insol. Aβ42: two-tailed t-test, n(ctrl) = 11, n(PLX) = 12, p = 0.000000005). f Quantifications of dystrophic neurites around amyloid plaques (%LAMP1 area: two-tailed t-test, n(ctrl) = 12, n(PLX) = 12, p = 0.0000000007; total number of LAMP1 dystrophic neurites: two-tailed t-test, n(ctrl) = 12, n(PLX) = 12, p = 0.0317; average size of LAMP1 dystrophic neurites: two-tailed t-test, n(ctrl) = 12, n(PLX) = 12, p = 0.1321). g Representative images of LAMP1+ dystrophic neurites in the brain. White dots represent female mice and black dots represent male mice. Scale bars 500 μm (b, g), 30 μm (d). All data is presented as mean ± SD. *p ≤ 0.05; **p ≤ 0.01; ***p ≤ 0.001; ****p ≤ 0.0001. Source data are provided as a Source Data file.
Fig. 1 Microglia seed early amyloid plaques. a Treatment scheme. AppNL-G-F mice (APP) were fed PLX3397 from 1 month until analysis at 4 months of age (1−4 M PLX) or a control diet (4 M ctrl). Created in BioRender. Cherretté, E. (2024) https://BioRender.com/u17o338. b Representative confocal images of amyloid plaques in the brain, stained with X34 (fibrillar plaques) or 82E1 (total Aβ). c Quantification of amyloid plaques in the whole brain (%X34 area: two-tailed t-test, n(ctrl) = 12, n(PLX) = 12, p = 0.0000000016; total number of X34 plaques: two-tailed Mann-Whitney test, n(ctrl) = 12, n(PLX) = 12), p = 0.000002; average size X34 plaques: two-tailed t-test, n(ctrl) = 12, n(PLX) = 12, p = 0.5098; %82E1 area: two-tailed d t-test, n(ctrl) = 11, n(PLX) = 12, p = 0.000015; total number of 82E1 plaques: two-tailed t-test with Welch’s correction, n(ctrl) = 11, n(PLX) = 12), p = 0.012; average size 82E1 plaques: two-tailed t-test, n(ctrl) = 11, n(PLX) = 12, p = 0.1225). d Higher magnification images of amyloid plaques and microglia in control and PLX3397-treated mice. e ELISA of amyloid levels in soluble and insoluble cortex extracts (sol. Aβ38: two-tailed t-test, n(ctrl) = 12, n(PLX) = 12), p = 0.0098; sol. Aβ40: two-tailed Mann-Whitney test, n(ctrl) = 12, n(PLX) = 12), p = 0.1725; sol. Aβ42: two-tailed t-test, n(ctrl) = 12, n(PLX) = 12), p = 0.2571; insol. Aβ38: two-tailed t-test with Welch’s correction, n(ctrl) = 11, n(PLX) = 12, p = 0.00000009; insol. Aβ40: two-tailed t-test, n(ctrl) = 11, n(PLX) = 12, p = 0.000004; insol. Aβ42: two-tailed t-test, n(ctrl) = 11, n(PLX) = 12, p = 0.000000005). f Quantifications of dystrophic neurites around amyloid plaques (%LAMP1 area: two-tailed t-test, n(ctrl) = 12, n(PLX) = 12, p = 0.0000000007; total number of LAMP1 dystrophic neurites: two-tailed t-test, n(ctrl) = 12, n(PLX) = 12, p = 0.0317; average size of LAMP1 dystrophic neurites: two-tailed t-test, n(ctrl) = 12, n(PLX) = 12, p = 0.1321). g Representative images of LAMP1+ dystrophic neurites in the brain. White dots represent female mice and black dots represent male mice. Scale bars 500 μm (b, g), 30 μm (d). All data is presented as mean ± SD. *p ≤ 0.05; **p ≤ 0.01; ***p ≤ 0.001; ****p ≤ 0.0001. Source data are provided as a Source Data file.CC BY · PubMed Central
Fig. 2 Microglia compact late amyloid plaques. a Treatment scheme. AppNL-G-F mice (APP) were fed PLX3397 from 3 months until analysis at 7 months of age (3−7 M PLX) or control diet (7 M ctrl). Created in BioRender. Cherretté, E. (2024) https://BioRender.com/u17o338. b Amyloid plaques in the brain, stained with X34 (fibrillar plaques) and 82E1 (total Aβ). c Image quantifications of amyloid plaques in the whole brain (%X34 area: two-tailed t-test, n(ctrl) = 12, n(PLX) = 14, p = 0.4926; total number of X34 plaques: two-tailed t-test with Welch’s correction, n(ctrl) = 12, n(PLX) = 14, p = 0.1575; average size X34 plaques: two-tailed t-test, n(ctrl) = 12, n(PLX) = 14, p = 0.0034; %82E1 area: two-tailed t-test, n(ctrl) = 12, n(PLX) = 14, p = 0.0027; total number of 82E1 plaques: two-tailed t-test, n(ctrl) = 12, n(PLX) = 14, p = 0.4042; average size 82E1 plaques: two-tailed t-test, n(ctrl) = 12, n(PLX) = 14, p = 0.00003). d Higher magnification images of amyloid plaques and microglia in control and PLX3397-treated mice. e ELISA of amyloid levels in soluble and insoluble cortex extracts (sol. Aβ38: two-tailed t-test, n(ctrl) = 12, n(PLX) = 14, p = 0.7964; sol. Aβ40: two-tailed t-test, n(ctrl) = 12, n(PLX) = 14, p = 0.5302; sol. Aβ42: two-tailed t-test, n(ctrl) = 12, n(PLX) = 14, p = 0.0638; insol. Aβ38: two-tailed t-test, n(ctrl) = 12, n(PLX) = 14, p = 0.000008; insol. Aβ40: two-tailed t-test, n(ctrl) = 12, n(PLX) = 14, p = 0.0887; insol. Aβ42: two-tailed t-test, n(ctrl) = 12, n(PLX) = 14, p = 0.1904). f Quantifications of dystrophic neurites around amyloid plaques (%LAMP1 area: two-tailed t-test, n(ctrl) = 12, n(PLX) = 14, p = 0.0172; total number of LAMP1 dystrophic neurites: two-tailed t-test, n(ctrl) = 12, n(PLX) = 14, p = 0.0003; average size of LAMP1 dystrophic neurites: two-tailed t-test, n(ctrl) = 12, n(PLX) = 14, p = 0.000000006). g LAMP1+ dystrophic neurites in the brain. White dots represent female mice and black dots represent male mice. Scale bars 500 μm (b, g), 30 μm (d). All data is presented as mean ± SD. *p ≤ 0.05; **p ≤ 0.01; ***p ≤ 0.001; ****p ≤ 0.0001. Source data are provided as a Source Data file.
Fig. 2 Microglia compact late amyloid plaques. a Treatment scheme. AppNL-G-F mice (APP) were fed PLX3397 from 3 months until analysis at 7 months of age (3−7 M PLX) or control diet (7 M ctrl). Created in BioRender. Cherretté, E. (2024) https://BioRender.com/u17o338. b Amyloid plaques in the brain, stained with X34 (fibrillar plaques) and 82E1 (total Aβ). c Image quantifications of amyloid plaques in the whole brain (%X34 area: two-tailed t-test, n(ctrl) = 12, n(PLX) = 14, p = 0.4926; total number of X34 plaques: two-tailed t-test with Welch’s correction, n(ctrl) = 12, n(PLX) = 14, p = 0.1575; average size X34 plaques: two-tailed t-test, n(ctrl) = 12, n(PLX) = 14, p = 0.0034; %82E1 area: two-tailed t-test, n(ctrl) = 12, n(PLX) = 14, p = 0.0027; total number of 82E1 plaques: two-tailed t-test, n(ctrl) = 12, n(PLX) = 14, p = 0.4042; average size 82E1 plaques: two-tailed t-test, n(ctrl) = 12, n(PLX) = 14, p = 0.00003). d Higher magnification images of amyloid plaques and microglia in control and PLX3397-treated mice. e ELISA of amyloid levels in soluble and insoluble cortex extracts (sol. Aβ38: two-tailed t-test, n(ctrl) = 12, n(PLX) = 14, p = 0.7964; sol. Aβ40: two-tailed t-test, n(ctrl) = 12, n(PLX) = 14, p = 0.5302; sol. Aβ42: two-tailed t-test, n(ctrl) = 12, n(PLX) = 14, p = 0.0638; insol. Aβ38: two-tailed t-test, n(ctrl) = 12, n(PLX) = 14, p = 0.000008; insol. Aβ40: two-tailed t-test, n(ctrl) = 12, n(PLX) = 14, p = 0.0887; insol. Aβ42: two-tailed t-test, n(ctrl) = 12, n(PLX) = 14, p = 0.1904). f Quantifications of dystrophic neurites around amyloid plaques (%LAMP1 area: two-tailed t-test, n(ctrl) = 12, n(PLX) = 14, p = 0.0172; total number of LAMP1 dystrophic neurites: two-tailed t-test, n(ctrl) = 12, n(PLX) = 14, p = 0.0003; average size of LAMP1 dystrophic neurites: two-tailed t-test, n(ctrl) = 12, n(PLX) = 14, p = 0.000000006). g LAMP1+ dystrophic neurites in the brain. White dots represent female mice and black dots represent male mice. Scale bars 500 μm (b, g), 30 μm (d). All data is presented as mean ± SD. *p ≤ 0.05; **p ≤ 0.01; ***p ≤ 0.001; ****p ≤ 0.0001. Source data are provided as a Source Data file.CC BY · PubMed Central
Fig. 3 The adaptive immune system does not alter microglia-mediated modulation of amyloid plaques. a−c Immunodeficient AppNL-G-F/Rag2-/- mice (APP/R2) were fed PLX3397 from 1 month until analysis at 4 months of age (1−4 M PLX) or control diet (4 M ctrl). a Quantifications of amyloid plaques in the whole brain (%X34 area: two-tailed t-test with Welch’s correction, n(ctrl) = 12, n(PLX) = 9, p = 0.000000000005; total number of X34 plaques: two-tailed Mann-Whitney test, n(ctrl) = 12, n(PLX) = 9, p = 0.000007; average size X34 plaques: two-tailed t-test, n(ctrl) = 12, n(PLX) = 9, p = 0.0002; %82E1 area: two-tailed t-test, n(ctrl) = 12, n(PLX) = 9, p = 0.00000002; total number of 82E1 plaques: two-tailed t-test, n(ctrl) = 12, n(PLX) = 9, p = 0.0000009; average size 82E1 plaques: two-tailed t-test, n(ctrl) = 12, n(PLX) = 9, p = 0.0926). b Representative images of amyloid plaques stained with X34 and 82E1. c Aβ ELISA of soluble and insoluble cortex extracts (sol. Aβ38: two-tailed t-test, n(ctrl) = 13, n(PLX) = 11, p = 0.3824; sol. Aβ40: two-tailed t-test, n(ctrl) = 13, n(PLX) = 11, p = 0.0558; sol. Aβ42: two-tailed t-test, n(ctrl) = 13, n(PLX) = 11, p = 0.0029; insol. Aβ38: two-tailed t-test, n(ctrl) = 13, n(PLX) = 11, p = 0.000000000001; insol. Aβ40: two-tailed Mann-Whitney test, n(ctrl) = 13, n(PLX) = 11, p = 0.000002; insol. Aβ42: two-tailed t-test, n(ctrl) = 13, n(PLX) = 11, p = 0.000000001). d−f Immunodeficient AppNL-G-F/Rag2-/- mice (APP/R2) were treated with PLX3397 from 3 months until analysis at 7 months of age (3−7 M PLX) or control diet (7 M ctrl). d Image quantifications of amyloid plaques (%X34 area: two-tailed t-test, n(ctrl) = 16, n(PLX) = 13, p = 0.0036; total number of X34 plaques: two-tailed t-test with Welch’s correction, n(ctrl) = 16, n(PLX) = 13, p = 0.00009; average size X34 plaques: two-tailed t-test, n(ctrl) = 16, n(PLX) = 13, p = 0.00000004; %82E1 area: two-tailed t-test, n(ctrl) = 16, n(PLX) = 13, p = 0.00002; total number of 82E1 plaques: two-tailed Mann-Whitney test, n(ctrl) = 16, n(PLX) = 13, p = 0.0056; average size 82E1 plaques: two-tailed t-test, n(ctrl) = 16, n(PLX) = 13, p = 0.0001). e Representative images of amyloid plaques stained with X34 and 82E1. f Aβ ELISA of soluble and insoluble cortex extracts (sol. Aβ38: two-tailed d t-test, n(ctrl) = 18, n(PLX) = 13, p = 0.9646; sol. Aβ40: two-tailed t-test with Welch’s correction, n(ctrl) = 18, n(PLX) = 13, p = 0.4748; sol. Aβ42: two-tailed t-test, n(ctrl) = 18, n(PLX) = 13, p = 0.1756; insol. Aβ38: two-tailed t-test with Welch’s correction, n(ctrl) = 18, n(PLX) = 13, p = 0.0006; insol. Aβ40: two-tailed t-test, n(ctrl) = 18, n(PLX) = 13, p = 0.2682; insol. Aβ42: two-tailed t-test, n(ctrl) = 17, n(PLX) = 13, p = 0.1715). White dots represent female and black dots represent male mice. Scale bars 500 μm (b, e). All data is presented as mean ± SD. *p ≤ 0.05; **p ≤ 0.01; ***p ≤ 0.001; ****p ≤ 0.0001. Source data are provided as a Source Data file.
Fig. 3 The adaptive immune system does not alter microglia-mediated modulation of amyloid plaques. a−c Immunodeficient AppNL-G-F/Rag2-/- mice (APP/R2) were fed PLX3397 from 1 month until analysis at 4 months of age (1−4 M PLX) or control diet (4 M ctrl). a Quantifications of amyloid plaques in the whole brain (%X34 area: two-tailed t-test with Welch’s correction, n(ctrl) = 12, n(PLX) = 9, p = 0.000000000005; total number of X34 plaques: two-tailed Mann-Whitney test, n(ctrl) = 12, n(PLX) = 9, p = 0.000007; average size X34 plaques: two-tailed t-test, n(ctrl) = 12, n(PLX) = 9, p = 0.0002; %82E1 area: two-tailed t-test, n(ctrl) = 12, n(PLX) = 9, p = 0.00000002; total number of 82E1 plaques: two-tailed t-test, n(ctrl) = 12, n(PLX) = 9, p = 0.0000009; average size 82E1 plaques: two-tailed t-test, n(ctrl) = 12, n(PLX) = 9, p = 0.0926). b Representative images of amyloid plaques stained with X34 and 82E1. c Aβ ELISA of soluble and insoluble cortex extracts (sol. Aβ38: two-tailed t-test, n(ctrl) = 13, n(PLX) = 11, p = 0.3824; sol. Aβ40: two-tailed t-test, n(ctrl) = 13, n(PLX) = 11, p = 0.0558; sol. Aβ42: two-tailed t-test, n(ctrl) = 13, n(PLX) = 11, p = 0.0029; insol. Aβ38: two-tailed t-test, n(ctrl) = 13, n(PLX) = 11, p = 0.000000000001; insol. Aβ40: two-tailed Mann-Whitney test, n(ctrl) = 13, n(PLX) = 11, p = 0.000002; insol. Aβ42: two-tailed t-test, n(ctrl) = 13, n(PLX) = 11, p = 0.000000001). d−f Immunodeficient AppNL-G-F/Rag2-/- mice (APP/R2) were treated with PLX3397 from 3 months until analysis at 7 months of age (3−7 M PLX) or control diet (7 M ctrl). d Image quantifications of amyloid plaques (%X34 area: two-tailed t-test, n(ctrl) = 16, n(PLX) = 13, p = 0.0036; total number of X34 plaques: two-tailed t-test with Welch’s correction, n(ctrl) = 16, n(PLX) = 13, p = 0.00009; average size X34 plaques: two-tailed t-test, n(ctrl) = 16, n(PLX) = 13, p = 0.00000004; %82E1 area: two-tailed t-test, n(ctrl) = 16, n(PLX) = 13, p = 0.00002; total number of 82E1 plaques: two-tailed Mann-Whitney test, n(ctrl) = 16, n(PLX) = 13, p = 0.0056; average size 82E1 plaques: two-tailed t-test, n(ctrl) = 16, n(PLX) = 13, p = 0.0001). e Representative images of amyloid plaques stained with X34 and 82E1. f Aβ ELISA of soluble and insoluble cortex extracts (sol. Aβ38: two-tailed d t-test, n(ctrl) = 18, n(PLX) = 13, p = 0.9646; sol. Aβ40: two-tailed t-test with Welch’s correction, n(ctrl) = 18, n(PLX) = 13, p = 0.4748; sol. Aβ42: two-tailed t-test, n(ctrl) = 18, n(PLX) = 13, p = 0.1756; insol. Aβ38: two-tailed t-test with Welch’s correction, n(ctrl) = 18, n(PLX) = 13, p = 0.0006; insol. Aβ40: two-tailed t-test, n(ctrl) = 18, n(PLX) = 13, p = 0.2682; insol. Aβ42: two-tailed t-test, n(ctrl) = 17, n(PLX) = 13, p = 0.1715). White dots represent female and black dots represent male mice. Scale bars 500 μm (b, e). All data is presented as mean ± SD. *p ≤ 0.05; **p ≤ 0.01; ***p ≤ 0.001; ****p ≤ 0.0001. Source data are provided as a Source Data file.CC BY · PubMed Central
Fig. 4 Genetic depletion of microglia delays amyloid plaque deposition and is reversed by xenotransplantation of human microglia. a Overview and higher magnification images of amyloid plaques in the brain and microglia in 6−7-week-old control mice (AppNL-G-F; Rag2−/−; IL2rg−/−; hCSF1KI, with mouse microglia) and FIRE mice (AppNL-G-F; Rag2−/−; IL2rg−/−; hCSF1KI; Csf1rΔFIRE/ΔFIRE, no microglia). b Aβ ELISA of soluble and insoluble cortex extracts in 6−7-week-old control and FIRE mice (sol. Aβ38: two-tailed t-test with Welch’s correction, n(ctrl) = 10, n(FIRE) = 11, p = 0.1936; sol. Aβ40: two-tailed t-test, n(ctrl) = 10, n(FIRE) = 12, p = 0.0016; sol. Aβ42: two-tailed t-test, n(ctrl) = 10, n(FIRE) = 12, p = 0.0665; insol. Aβ38: two-tailed t-test, n(ctrl) = 9, n(FIRE) = 12, p = 0.017; insol. Aβ40: two-tailed t-test, n(ctrl) = 9, n(FIRE) = 12, p = 0.0107; insol. Aβ42: two-tailed t-test with Welch’s correction, n(ctrl) = 9, n(FIRE) = 12, p = 0.00000007). c Representative images of amyloid plaques in the brains of 3-month-old control mice, FIRE mice, and FIRE mice xenografted with human microglia (FIRE + hMG), stained with X34 (fibrillar plaques) and 82E1 (total Aβ). d Quantifications of amyloid plaques in the whole brain (%X34 area: one-way Welch’s ANOVA test, n(ctrl) = 11, n(FIRE) = 12, n(FIRE +hMG) = 7, p = 0.000002; total number of X34 plaques: one-way Kruskal-Wallis test, n(ctrl) = 11, n(FIRE) = 12, n(FIRE +hMG) = 7, p = 0.0001; average size X34 plaques: one-way ANOVA, n(ctrl) = 11, n(FIRE) = 12, n(FIRE +hMG) = 7, p = 0.00000002; %82E1 area: one-way Welch’s ANOVA test, n(ctrl) = 10, n(FIRE) = 12, n(FIRE +hMG) = 7, p = 0.0000002; total number of 82E1 plaques: one-way Kruskal-Wallis test, n(ctrl) = 10, n(FIRE) = 12, n(FIRE +hMG) = 7, p = 0.00002; average size 82E1 plaques: one-way Welch’s ANOVA test, n(ctrl) = 10, n(FIRE) = 12, n(FIRE +hMG) = 7, p = 0.000009). e Aβ ELISA of soluble and insoluble cortex extracts (sol. Aβ38: one-way ANOVA, n(ctrl) = 11, n(FIRE) = 12, n(FIRE +hMG) = 8, p = 0.0237; sol. Aβ40: one-way ANOVA, n(ctrl) = 10, n(FIRE) = 12, n(FIRE +hMG) = 8, p = 0.1868; sol. Aβ42: one-way ANOVA, n(ctrl) = 11, n(FIRE) = 12, n(FIRE +hMG) = 8, p = 0.0125; insol. Aβ38: one-way ANOVA, n(ctrl) = 11, n(FIRE) = 12, n(FIRE +hMG) = 8, p = 0.0000000001; insol. Aβ40: one-way ANOVA, n(ctrl) = 11, n(FIRE) = 11, n(FIRE +hMG) = 8, p = 0.00000001; insol. Aβ42: one-way ANOVA, n(ctrl) = 11, n(FIRE) = 12, n(FIRE +hMG) = 8, p < 0.000000000000001). White dots represent female mice and black dots represent male mice. Scale bars 500 μm (a, c) and 30 μm (a). All data are presented as mean ± SD. *p ≤ 0.05; **p ≤ 0.01; ***p ≤ 0.001; ****p ≤ 0.0001. Source data are provided as a Source Data file.
Fig. 4 Genetic depletion of microglia delays amyloid plaque deposition and is reversed by xenotransplantation of human microglia. a Overview and higher magnification images of amyloid plaques in the brain and microglia in 6−7-week-old control mice (AppNL-G-F; Rag2−/−; IL2rg−/−; hCSF1KI, with mouse microglia) and FIRE mice (AppNL-G-F; Rag2−/−; IL2rg−/−; hCSF1KI; Csf1rΔFIRE/ΔFIRE, no microglia). b Aβ ELISA of soluble and insoluble cortex extracts in 6−7-week-old control and FIRE mice (sol. Aβ38: two-tailed t-test with Welch’s correction, n(ctrl) = 10, n(FIRE) = 11, p = 0.1936; sol. Aβ40: two-tailed t-test, n(ctrl) = 10, n(FIRE) = 12, p = 0.0016; sol. Aβ42: two-tailed t-test, n(ctrl) = 10, n(FIRE) = 12, p = 0.0665; insol. Aβ38: two-tailed t-test, n(ctrl) = 9, n(FIRE) = 12, p = 0.017; insol. Aβ40: two-tailed t-test, n(ctrl) = 9, n(FIRE) = 12, p = 0.0107; insol. Aβ42: two-tailed t-test with Welch’s correction, n(ctrl) = 9, n(FIRE) = 12, p = 0.00000007). c Representative images of amyloid plaques in the brains of 3-month-old control mice, FIRE mice, and FIRE mice xenografted with human microglia (FIRE + hMG), stained with X34 (fibrillar plaques) and 82E1 (total Aβ). d Quantifications of amyloid plaques in the whole brain (%X34 area: one-way Welch’s ANOVA test, n(ctrl) = 11, n(FIRE) = 12, n(FIRE +hMG) = 7, p = 0.000002; total number of X34 plaques: one-way Kruskal-Wallis test, n(ctrl) = 11, n(FIRE) = 12, n(FIRE +hMG) = 7, p = 0.0001; average size X34 plaques: one-way ANOVA, n(ctrl) = 11, n(FIRE) = 12, n(FIRE +hMG) = 7, p = 0.00000002; %82E1 area: one-way Welch’s ANOVA test, n(ctrl) = 10, n(FIRE) = 12, n(FIRE +hMG) = 7, p = 0.0000002; total number of 82E1 plaques: one-way Kruskal-Wallis test, n(ctrl) = 10, n(FIRE) = 12, n(FIRE +hMG) = 7, p = 0.00002; average size 82E1 plaques: one-way Welch’s ANOVA test, n(ctrl) = 10, n(FIRE) = 12, n(FIRE +hMG) = 7, p = 0.000009). e Aβ ELISA of soluble and insoluble cortex extracts (sol. Aβ38: one-way ANOVA, n(ctrl) = 11, n(FIRE) = 12, n(FIRE +hMG) = 8, p = 0.0237; sol. Aβ40: one-way ANOVA, n(ctrl) = 10, n(FIRE) = 12, n(FIRE +hMG) = 8, p = 0.1868; sol. Aβ42: one-way ANOVA, n(ctrl) = 11, n(FIRE) = 12, n(FIRE +hMG) = 8, p = 0.0125; insol. Aβ38: one-way ANOVA, n(ctrl) = 11, n(FIRE) = 12, n(FIRE +hMG) = 8, p = 0.0000000001; insol. Aβ40: one-way ANOVA, n(ctrl) = 11, n(FIRE) = 11, n(FIRE +hMG) = 8, p = 0.00000001; insol. Aβ42: one-way ANOVA, n(ctrl) = 11, n(FIRE) = 12, n(FIRE +hMG) = 8, p < 0.000000000000001). White dots represent female mice and black dots represent male mice. Scale bars 500 μm (a, c) and 30 μm (a). All data are presented as mean ± SD. *p ≤ 0.05; **p ≤ 0.01; ***p ≤ 0.001; ****p ≤ 0.0001. Source data are provided as a Source Data file.CC BY · PubMed Central
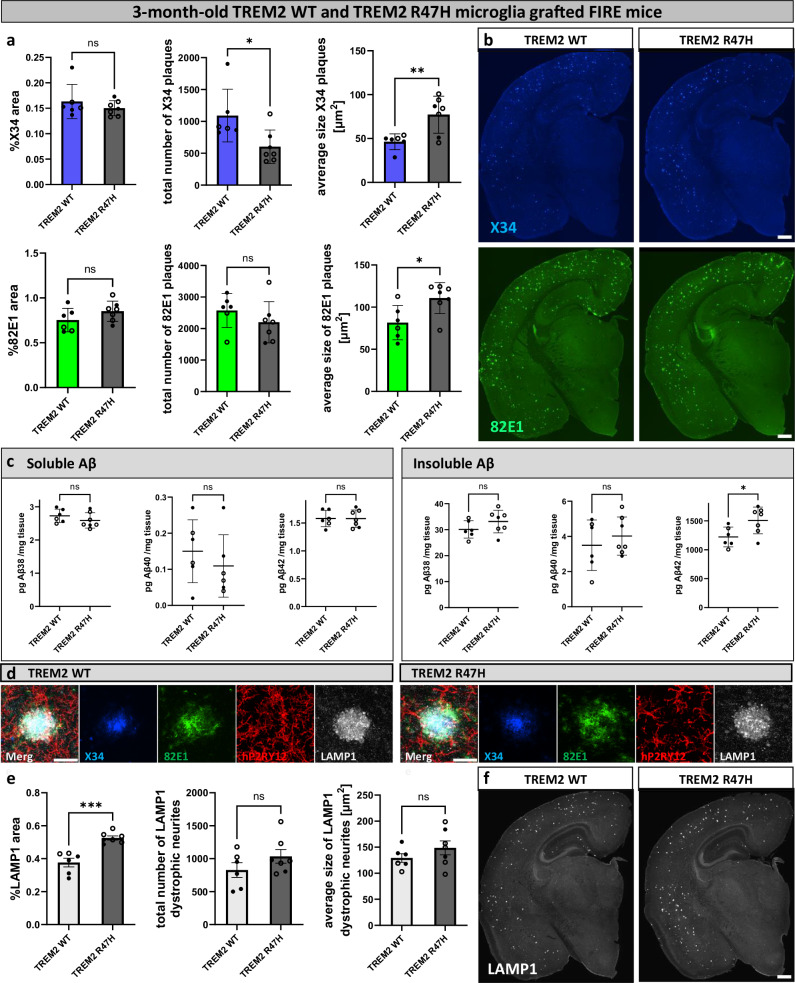
Fig. 5 Xenotransplanted TREM2R47H/R47H microglia exacerbate amyloid and dystrophic neurite pathology in FIRE mice. FIRE mice (AppNL-G-F; Rag2−/−; IL2rg−/−; hCSF1KI; Csf1rΔFIRE/ΔFIRE) were xenotransplanted with human WT microglia (TREM2 WT) and human microglia harboring the TREM2R47H/R47H risk gene (TREM2 R47H) at P4 and analyzed at 3 months of age. a Image quantification of X34+ and 82E1+ amyloid plaques in the whole brain (%X34 area: two-tailed Mann-Whitney test, n(TREM2 WT) = 6, n(TREM2 R47H) = 7, p = 0.6282; total number of X34 plaques: two-tailed Mann-Whitney test, n(TREM2 WT) = 6, n(TREM2 R47H) = 7, p = 0.014; average size X34 plaques: two-tailed t-test, n(TREM2 WT) = 6, n(TREM2 R47H) = 7, p = 0.0072; %82E1 area: two-tailed t-test, n(TREM2 WT) = 6, n(TREM2 R47H) = 7, p = 0.1734; total number of 82E1 plaques: two-tailed t-test, n(TREM2 WT) = 6, n(TREM2 R47H) = 7, p = 0.2909; average size 82E1 plaques: two-tailed t-test, n(TREM2 WT) = 6, n(TREM2 R47H) = 7, p = 0.0201). b Representative images of amyloid plaques in the brain stained with X34 (fibrillar plaques) and 82E1 (total Aβ). c ELISA of amyloid levels in soluble and insoluble cortex extracts (sol. Aβ38: two-tailed t-test, n(TREM2 WT) = 6, n(TREM2 R47H) = 7, p = 0.2712; sol. Aβ40: two-tailed t-test, n(TREM2 WT) = 6, n(TREM2 R47H) = 6, p = 0.434; sol. Aβ42: two-tailed t-test, n(TREM2 WT) = 6, n(TREM2 R47H) = 7, p = 0.9832; insol. Aβ38: two-tailed t-test, n(TREM2 WT) = 6, n(TREM2 R47H) = 7, p = 0.1897; insol. Aβ40: two-tailed t-test, n(TREM2 WT) = 6, n(TREM2 R47H) = 7, p = 0.4699; insol. Aβ42: two-tailed t-test, n(TREM2 WT) = 6, n(TREM2 R47H) = 7, p = 0.0295). d Zoom in on plaques, dystrophic neurites, and human microglia staining in 3-month-old xenografted FIRE mice. e Quantification of LAMP1+ dystrophic neurites in the whole brain (%LAMP1 area: two-tailed t-test, n(TREM2 WT) = 6, n(TREM2 R47H) = 7, p = 0.0002; total number of LAMP1 dystrophic neurites: two-tailed t-test, n(TREM2 WT) = 6, n(TREM2 R47H) = 7, p = 0.2023; average size of LAMP1 dystrophic neurites: two-tailed t-test, n(TREM2 WT) = 6, n(TREM2 R47H) = 7, p = 0.2574). f Representative images of LAMP1+ dystrophic neurites in the whole brain. White dots represent female mice and black dots represent male mice. Scale bars 500 μm (b, f), 30 μm (d). All data is presented as mean ± SD. *p ≤ 0.05; **p ≤ 0.01; ***p ≤ 0.001; ****p ≤ 0.0001. Source data are provided as a Source Data file.
Fig. 5 Xenotransplanted TREM2R47H/R47H microglia exacerbate amyloid and dystrophic neurite pathology in FIRE mice. FIRE mice (AppNL-G-F; Rag2−/−; IL2rg−/−; hCSF1KI; Csf1rΔFIRE/ΔFIRE) were xenotransplanted with human WT microglia (TREM2 WT) and human microglia harboring the TREM2R47H/R47H risk gene (TREM2 R47H) at P4 and analyzed at 3 months of age. a Image quantification of X34+ and 82E1+ amyloid plaques in the whole brain (%X34 area: two-tailed Mann-Whitney test, n(TREM2 WT) = 6, n(TREM2 R47H) = 7, p = 0.6282; total number of X34 plaques: two-tailed Mann-Whitney test, n(TREM2 WT) = 6, n(TREM2 R47H) = 7, p = 0.014; average size X34 plaques: two-tailed t-test, n(TREM2 WT) = 6, n(TREM2 R47H) = 7, p = 0.0072; %82E1 area: two-tailed t-test, n(TREM2 WT) = 6, n(TREM2 R47H) = 7, p = 0.1734; total number of 82E1 plaques: two-tailed t-test, n(TREM2 WT) = 6, n(TREM2 R47H) = 7, p = 0.2909; average size 82E1 plaques: two-tailed t-test, n(TREM2 WT) = 6, n(TREM2 R47H) = 7, p = 0.0201). b Representative images of amyloid plaques in the brain stained with X34 (fibrillar plaques) and 82E1 (total Aβ). c ELISA of amyloid levels in soluble and insoluble cortex extracts (sol. Aβ38: two-tailed t-test, n(TREM2 WT) = 6, n(TREM2 R47H) = 7, p = 0.2712; sol. Aβ40: two-tailed t-test, n(TREM2 WT) = 6, n(TREM2 R47H) = 6, p = 0.434; sol. Aβ42: two-tailed t-test, n(TREM2 WT) = 6, n(TREM2 R47H) = 7, p = 0.9832; insol. Aβ38: two-tailed t-test, n(TREM2 WT) = 6, n(TREM2 R47H) = 7, p = 0.1897; insol. Aβ40: two-tailed t-test, n(TREM2 WT) = 6, n(TREM2 R47H) = 7, p = 0.4699; insol. Aβ42: two-tailed t-test, n(TREM2 WT) = 6, n(TREM2 R47H) = 7, p = 0.0295). d Zoom in on plaques, dystrophic neurites, and human microglia staining in 3-month-old xenografted FIRE mice. e Quantification of LAMP1+ dystrophic neurites in the whole brain (%LAMP1 area: two-tailed t-test, n(TREM2 WT) = 6, n(TREM2 R47H) = 7, p = 0.0002; total number of LAMP1 dystrophic neurites: two-tailed t-test, n(TREM2 WT) = 6, n(TREM2 R47H) = 7, p = 0.2023; average size of LAMP1 dystrophic neurites: two-tailed t-test, n(TREM2 WT) = 6, n(TREM2 R47H) = 7, p = 0.2574). f Representative images of LAMP1+ dystrophic neurites in the whole brain. White dots represent female mice and black dots represent male mice. Scale bars 500 μm (b, f), 30 μm (d). All data is presented as mean ± SD. *p ≤ 0.05; **p ≤ 0.01; ***p ≤ 0.001; ****p ≤ 0.0001. Source data are provided as a Source Data file.CC BY · PubMed Central

Verification

Claims the paper makes

The claims and statistics of this paper haven’t been checked yet.

Run the check — free, no account needed. It reads the open-access text and checks the sources it cites.

A few free checks a day · papers already verified open instantly · results are public

Claims other papers make about this one

Each is checked against this paper’s own text: does it say what the citing paper says it does?

Self-check

Percentages, sums and reported differences re-computed from the paper’s own numbers.

The self-check needs the paper’s full text.

Citations

Cites

Show all 76 references

Research works printed but not linked: 1

  1. Mancuso, R. et al. Xenografted human microglia display diverse transcriptomic states in response to Alzheimer’s disease-related amyloid-β pathology. Nat. Neurosci. 27, 886–900 (2024). · DOI · Paper page

Cited by

Sorted by citations

See all 123

Metadata

Authors
Baligács, N., Albertini, G., Borrie, S. C., Serneels, L., Pridans, C., Balusu, S., & De Strooper, B.
Affiliations
  • Vlaams Instituut voor Biotechnologie (BE)
  • Centre for Inflammation Research (GB)
Venue
Nature Communications
Published
2024-12-05
Volume
15
Issue
1
Pages
10634-10634
ISSN
2041-1723 (ISSN-L)
OpenAlex
W4405035908
Cited by
123
References
76
Citations by year
2026: 66 · 2025: 57
FWCI
19.19
Type
journal article
Language
en
Open access
Locations
  • Nature Communications (publishedVersion, cc-by)
  • bioRxiv (Cold Spring Harbor Laboratory) (acceptedVersion)
  • PubMed Central (publishedVersion, cc-by)
  • PubMed (publishedVersion)
  • UCL Discovery (University College London) (submittedVersion, cc-by)
  • Lirias (KU Leuven) (submittedVersion, cc-by)
  • RePEc: Research Papers in Economics (submittedVersion)
  • DOAJ (DOAJ: Directory of Open Access Journals) (submittedVersion, cc-by-sa)
  • Edinburgh Research Explorer (University of Edinburgh) (submittedVersion, other-oa)
Funders
  • Alzheimer's Association
  • Queen Elisabeth Medical Foundation
  • European Commission (HORIZON2020, ERC-834682 CELLPHASE_AD, 834682)
  • Fonds Wetenschappelijk Onderzoek (11PSA24N)
  • KU Leuven
  • Vlaams Instituut voor Biotechnologie
  • Vlaamse regering
  • Fondation pour la Recherche sur Alzheimer
  • Fondation Médicale Reine Elisabeth
  • Medical Research Council (MR/Y014847/1)
Topics
  • Life Sciences › Neuroscience › Neurology › Neuroinflammation and Neurodegeneration Mechanisms
  • Life Sciences › Neuroscience › Cellular and Molecular Neuroscience › Alzheimer's disease research and treatments
  • Life Sciences › Neuroscience › Neurology › Neurological Disease Mechanisms and Treatments
Keywords
microglia, Alzheimer's disease, amyloid plaques, neuritic dystrophy, microglial depletion, amyloid clearance, Rag2 knockout mice, amyloid hypothesis
MeSH terms
Alzheimer Disease, Animals, Disease Models, Animal, Female, Homeostasis, Humans, Male, Membrane Glycoproteins, Mice, Inbred C57BL, Mice, Transgenic, Mutation, Receptors, Immunologic, Amyloid beta-Peptides, Microglia, Mice, Plaque, Amyloid

About these checks

Registry, retraction, Cites and statistics results are computed, not judged, with one exception: a printed reference that no index lists is read once by a model before it counts as a citation error. Claims are extracted by a model and kept only when their quote appears verbatim in the text; each cited source is then checked, with a model’s help, for whether it says what the claim relies on. Those verdicts can be wrong — read the claim’s quote and the cited source before relying on one.

Statistics and arithmetic are recomputed, not judged.

Confidence bands are shown only for fields calibrated on our annotated test set. None is calibrated yet, so no band is shown.

What counts as a claim ›How we measure confidence ›How we check this ›

Are you an author, or do you see a problem with this page? Request a review