Cited by 6Ubiquitin and proteasome pathwaysHeat shock proteins researchProtein Degradation and Inhibitors

The DOI matches its Crossref record; 3 of the 3 references it cites were found in a registry or an index.

Loss-of-function mutations in the dystonia gene THAP1 impair proteasome function by inhibiting PSMB5 expression

Open access
Ramage, Dylan E., Grant, Drew W., Timms, Richard T.·2025·Nature Communications

Published version of a preprint

Abstract

The 26S proteasome is a multi-catalytic protease that serves as the endpoint for protein degradation via the ubiquitin-proteasome system. Proteasome function requires the concerted activity of 33 distinct gene products, but how the expression of proteasome subunits is regulated in mammalian cells remains poorly understood. Leveraging coessentiality data from the DepMap project, here we characterize an essential role for the dystonia gene THAP1 in maintaining the basal expression of PSMB5 . PSMB5 insufficiency resulting from loss of THAP1 leads to defects in proteasome assembly, impaired proteostasis and cell death. Exploiting the fact that the toxicity associated with loss of THAP1 can be rescued upon exogenous expression of PSMB5, we define the transcriptional targets of THAP1 through RNA-seq analysis and perform a deep mutational scan to systematically assess the function of thousands of single amino acid THAP1 variants. Altogether, these data identify THAP1 as a critical regulator of proteasome function and suggest that aberrant proteostasis may contribute to the pathogenesis of THAP1 dystonia.

Overview

The claims and statistics of this paper haven’t been checked yet.

Run the check — free, no account needed. It reads the open-access text and checks the sources it cites.

A few free checks a day · papers already verified open instantly · results are public

Integrity signals

Registry

Crossref · 10.1038/s41467-025-56782-1

Cites

3 of 3 references verified0 citation errors · 0 not checkable

Statistics

Figures

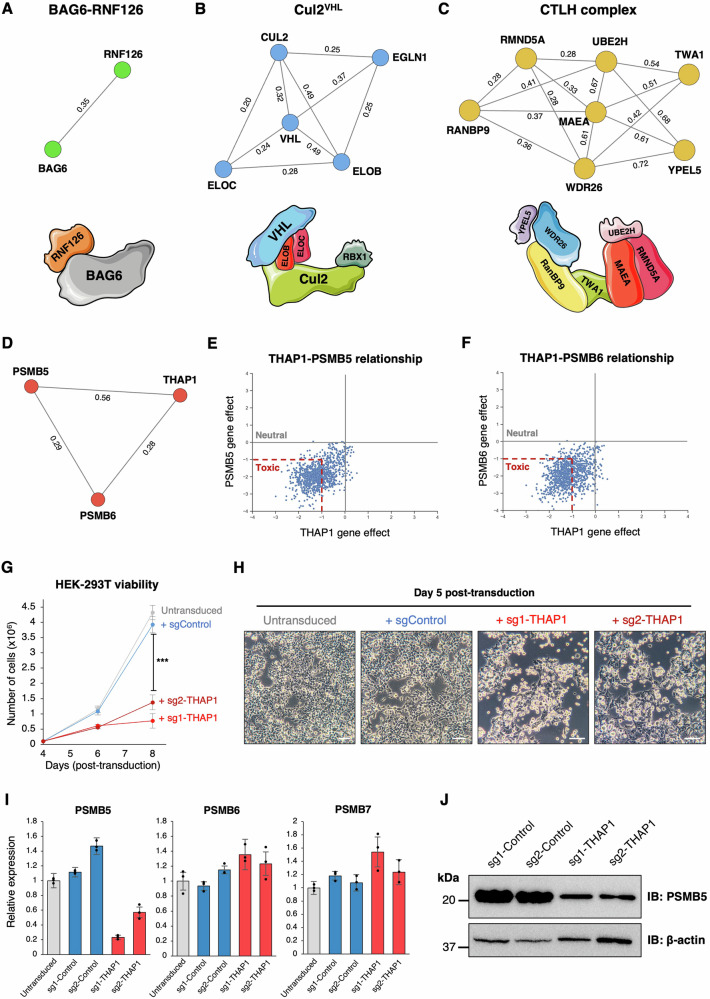
Fig. 1 Transcriptional regulation of PSMB5 by THAP1 explains their co-essential relationship. A–C Co-essential relationships involving UPS genes predict biological relationships, as exemplified by three E3 ligase complexes: the BAG6 complex (A), Cul2VHL (B) and the CTLH complex (C). Network diagrams were produced using NetworkX; numbers annotating the edges indicate pairwise correlation coefficients as calculated in ref. 16. D–F THAP1 exhibits a strong positive co-essential relationship with both PSMB5 and PSMB6 across DepMap data. G, H THAP1 disruption is toxic in HEK-293T cells. Cells were transduced with a lentiviral vector expressing Cas9 and the indicated sgRNAs, followed by puromycin selection to eliminate untransduced cells commencing 48 h later. A further 48 hours later, cells were counted, plated in equal numbers, and their viability assessed by counting (G) and brightfield microscopy (H). Data in (G) represent mean values of n = 3 biological replicates ± s.d. (***P < 0.001, two-tailed t-test) (Scale bar = 100 µm). I, J Ablation of THAP1 decreases PSMB5 expression. HEK-293T expressing Cas9 and the indicated sgRNAs were analyzed by qRT-PCR (I) and immunoblot (J). Data in (I) are presented as mean values of n = 3 technical replicates ± s.d. Source data are provided as a Source Data file.
Fig. 1 Transcriptional regulation of PSMB5 by THAP1 explains their co-essential relationship. A–C Co-essential relationships involving UPS genes predict biological relationships, as exemplified by three E3 ligase complexes: the BAG6 complex (A), Cul2VHL (B) and the CTLH complex (C). Network diagrams were produced using NetworkX; numbers annotating the edges indicate pairwise correlation coefficients as calculated in ref. 16. D–F THAP1 exhibits a strong positive co-essential relationship with both PSMB5 and PSMB6 across DepMap data. G, H THAP1 disruption is toxic in HEK-293T cells. Cells were transduced with a lentiviral vector expressing Cas9 and the indicated sgRNAs, followed by puromycin selection to eliminate untransduced cells commencing 48 h later. A further 48 hours later, cells were counted, plated in equal numbers, and their viability assessed by counting (G) and brightfield microscopy (H). Data in (G) represent mean values of n = 3 biological replicates ± s.d. (***P < 0.001, two-tailed t-test) (Scale bar = 100 µm). I, J Ablation of THAP1 decreases PSMB5 expression. HEK-293T expressing Cas9 and the indicated sgRNAs were analyzed by qRT-PCR (I) and immunoblot (J). Data in (I) are presented as mean values of n = 3 technical replicates ± s.d. Source data are provided as a Source Data file.CC BY · PubMed Central
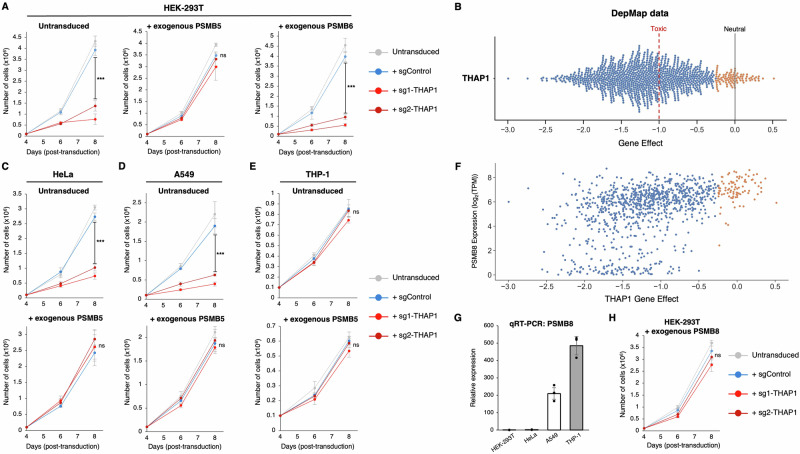
Fig. 2 Lethality resulting from THAP1 loss can be rescued by exogenous expression of PSMB5. A Exogenous expression of PSMB5 rescues cell viability upon THAP1 ablation. HEK-293T cells were first transduced with lentiviral vectors expressing either PSMB5 or PSMB6; then, following transduction with Cas9 and the indicated sgRNAs, cell numbers were monitored over time. B Loss of THAP1 is broadly toxic across cell types. CRISPR/Cas9-mediated ablation of THAP1 adversely affects the viability of 946/1100 cancer cell lines (blue dots, representing effect scores < -0.25) examined by DepMap. C, D The toxicity associated with THAP1 ablation is rescued by exogenous PSMB5 expression in HeLa cells (C) and A549 cells (D). E–H Like PSMB5, expression of PSMB8 also protects against the toxic effects of THAP1 loss. THP-1 cells do not exhibit any substantial growth defect following THAP1 ablation (E). High levels of PSMB8 expression are observed in the cell lines whose growth is not significantly affected by THAP1 loss (orange dots, representing effect scores >-0.25) in DepMap data (F), and THP-1 cells strongly express PSMB8 as assessed by qRT-PCR (G). Exogenous expression of PSMB8 can rescue the viability of HEK-293T cells following THAP1 disruption (H). Data in (G) represent mean values of n = 3 technical replicates ± s.d.; data in (A, C–E, and H) represent mean values of n = 3 biological replicates ± s.d. (***P < 0.001, two-tailed t-test; ns, not significant). Source data are provided as a Source Data file.
Fig. 2 Lethality resulting from THAP1 loss can be rescued by exogenous expression of PSMB5. A Exogenous expression of PSMB5 rescues cell viability upon THAP1 ablation. HEK-293T cells were first transduced with lentiviral vectors expressing either PSMB5 or PSMB6; then, following transduction with Cas9 and the indicated sgRNAs, cell numbers were monitored over time. B Loss of THAP1 is broadly toxic across cell types. CRISPR/Cas9-mediated ablation of THAP1 adversely affects the viability of 946/1100 cancer cell lines (blue dots, representing effect scores < -0.25) examined by DepMap. C, D The toxicity associated with THAP1 ablation is rescued by exogenous PSMB5 expression in HeLa cells (C) and A549 cells (D). E–H Like PSMB5, expression of PSMB8 also protects against the toxic effects of THAP1 loss. THP-1 cells do not exhibit any substantial growth defect following THAP1 ablation (E). High levels of PSMB8 expression are observed in the cell lines whose growth is not significantly affected by THAP1 loss (orange dots, representing effect scores >-0.25) in DepMap data (F), and THP-1 cells strongly express PSMB8 as assessed by qRT-PCR (G). Exogenous expression of PSMB8 can rescue the viability of HEK-293T cells following THAP1 disruption (H). Data in (G) represent mean values of n = 3 technical replicates ± s.d.; data in (A, C–E, and H) represent mean values of n = 3 biological replicates ± s.d. (***P < 0.001, two-tailed t-test; ns, not significant). Source data are provided as a Source Data file.CC BY · PubMed Central
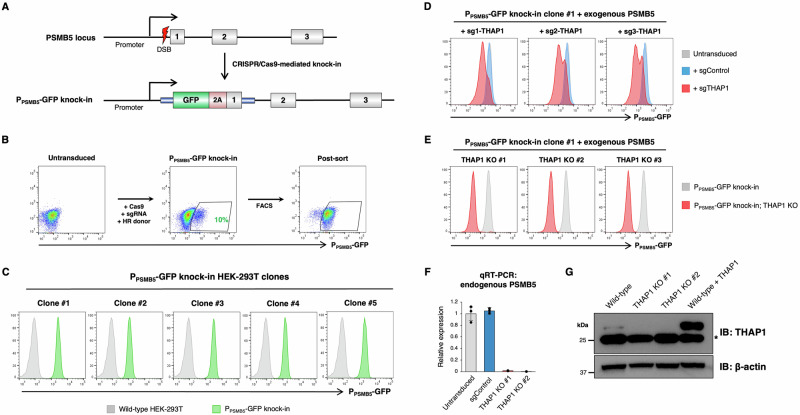
Fig. 3 A fluorescent reporter measures endogenous PSMB5 expression in live cells. A–C CRISPR/Cas9-mediated knock-in of GFP into the endogenous PSMB5 locus. A schematic representation of the procedure is shown in (A). Transfection of HEK-293T cells with Cas9, an sgRNA targeting PSMB5 and a donor template resulted in ~10% GFP-positive cells (B), which were purified by FACS and single cell cloned (C). D–G THAP1 ablation reduces PSMB5 expression. CRISPR/Cas9-mediated disruption of THAP1 in a PPSMB5-GFP reporter clone (expressing exogenous PSMB5 to ensure viability) reduced PPSMB5-GFP expression (D), permitting the derivation of GFPdim THAP1 KO clones (E). These THAP1 KO clones exhibited greatly reduced expression of PSMB5 by qRT-PCR (using primers annealing to the 3’UTR to ensure selective amplification of the endogenous transcripts) (F), and an absence of THAP1 protein by immunoblot (a non-specific band is indicated by an asterisk) (G). Data in (F) represent mean values of n = 3 technical replicates ± s.d. Source data are provided as a Source Data file.
Fig. 3 A fluorescent reporter measures endogenous PSMB5 expression in live cells. A–C CRISPR/Cas9-mediated knock-in of GFP into the endogenous PSMB5 locus. A schematic representation of the procedure is shown in (A). Transfection of HEK-293T cells with Cas9, an sgRNA targeting PSMB5 and a donor template resulted in ~10% GFP-positive cells (B), which were purified by FACS and single cell cloned (C). D–G THAP1 ablation reduces PSMB5 expression. CRISPR/Cas9-mediated disruption of THAP1 in a PPSMB5-GFP reporter clone (expressing exogenous PSMB5 to ensure viability) reduced PPSMB5-GFP expression (D), permitting the derivation of GFPdim THAP1 KO clones (E). These THAP1 KO clones exhibited greatly reduced expression of PSMB5 by qRT-PCR (using primers annealing to the 3’UTR to ensure selective amplification of the endogenous transcripts) (F), and an absence of THAP1 protein by immunoblot (a non-specific band is indicated by an asterisk) (G). Data in (F) represent mean values of n = 3 technical replicates ± s.d. Source data are provided as a Source Data file.CC BY · PubMed Central
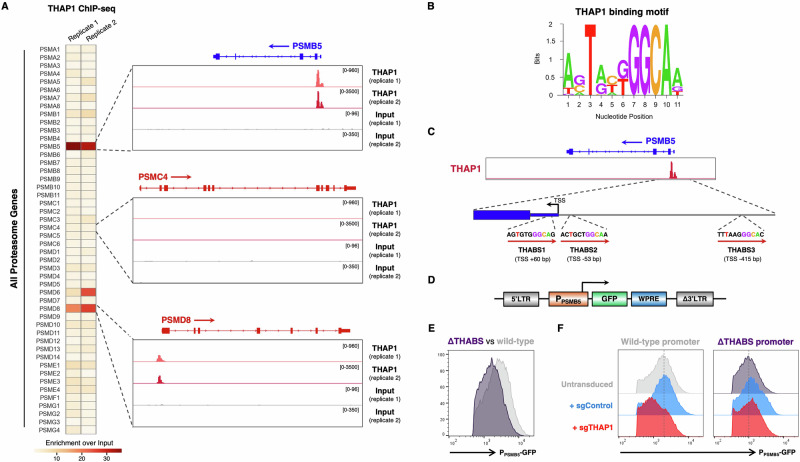
Fig. 4 THAP1 binds cognate motifs within the PSMB5 promoter to regulate its expression. A THAP1 binds the PSMB5 promoter. THAP1 ChIP-seq data in K562 cells41 reveals an intense peak representing THAP1 occupancy at the PSMB5 transcription start site (TSS) (top). PSMD8 is the only other proteasome subunit at which concordant binding of THAP1 is observed (bottom). B Consensus THAP1 binding site (THABS) motif (adapted from68). C Schematic representation of the three consensus THABS motifs located near the PSMB5 TSS. D–F THAP1 targets cognate sites in the PSMB5 promoter to activate gene expression. D Schematic representation of a lentiviral reporter system in which ~1 kb of the PSMB5 promoter drives the expression of GFP. Removal of the three THABS motifs (“ΔTHABS”) reduced GFP expression (E); this effect was mediated through THAP1, as THAP1 ablation decreased GFP expression driven by the wild-type promoter but not the ΔTHABS promoter (F). Source data are provided as a Source Data file.
Fig. 4 THAP1 binds cognate motifs within the PSMB5 promoter to regulate its expression. A THAP1 binds the PSMB5 promoter. THAP1 ChIP-seq data in K562 cells41 reveals an intense peak representing THAP1 occupancy at the PSMB5 transcription start site (TSS) (top). PSMD8 is the only other proteasome subunit at which concordant binding of THAP1 is observed (bottom). B Consensus THAP1 binding site (THABS) motif (adapted from68). C Schematic representation of the three consensus THABS motifs located near the PSMB5 TSS. D–F THAP1 targets cognate sites in the PSMB5 promoter to activate gene expression. D Schematic representation of a lentiviral reporter system in which ~1 kb of the PSMB5 promoter drives the expression of GFP. Removal of the three THABS motifs (“ΔTHABS”) reduced GFP expression (E); this effect was mediated through THAP1, as THAP1 ablation decreased GFP expression driven by the wild-type promoter but not the ΔTHABS promoter (F). Source data are provided as a Source Data file.CC BY · PubMed Central
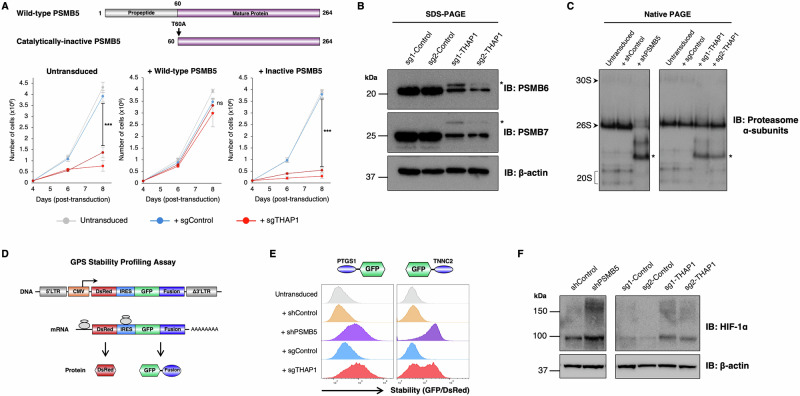
Fig. 5 PSMB5 insufficiency resulting from THAP1 loss impairs proteasome function. A The catalytic activity of PSMB5 is required to rescue viability upon THAP1 loss. Exogenous expression of wild-type PSMB5, but not a catalytically-inactive mutant, restored the viability of HEK-293T cells following THAP1 ablation. Data are presented as mean values of n=3 biological replicates +/− s.d. (***P < 0.001, two-tailed t-test; ns, not significant). B, C Loss of THAP1 impairs proteasome assembly. B THAP1 ablation decreases the abundance of mature, processed PSMB6 and PSMB7 as assessed by immunoblot, but leads to the accumulation of the uncleaved proproteins (indicated with asterisks). C Native PAGE analysis reveals the accumulation of proteasome assembly intermediates (indicted with asterisks) following THAP1 disruption, mimicking the defects observed upon PSMB5 knockdown. D–F THAP1 impairs the proteasomal degradation of short-lived proteins. D Schematic representation of the lentiviral Global Protein Stability (GPS) two-color fluorescent reporter system to monitor protein stability. E Stabilization of two model GFP-degron fusion proteins upon ablation of THAP1, as assessed by flow cytometry; the N-terminal peptide derived from PTGS1 harbors an N-terminal degron targeted by UBR-family E3 ligases69, while the C-terminal peptide derived from TNNC2 harbors a C-terminal degron targeted by Cul4DCAF1270. F Increased abundance of endogenous HIF-1α upon THAP1 disruption, as assayed by immunoblot. All immunoblot data is representative of at least two independent experiments. Source data are provided as a Source Data file.
Fig. 5 PSMB5 insufficiency resulting from THAP1 loss impairs proteasome function. A The catalytic activity of PSMB5 is required to rescue viability upon THAP1 loss. Exogenous expression of wild-type PSMB5, but not a catalytically-inactive mutant, restored the viability of HEK-293T cells following THAP1 ablation. Data are presented as mean values of n=3 biological replicates +/− s.d. (***P < 0.001, two-tailed t-test; ns, not significant). B, C Loss of THAP1 impairs proteasome assembly. B THAP1 ablation decreases the abundance of mature, processed PSMB6 and PSMB7 as assessed by immunoblot, but leads to the accumulation of the uncleaved proproteins (indicated with asterisks). C Native PAGE analysis reveals the accumulation of proteasome assembly intermediates (indicted with asterisks) following THAP1 disruption, mimicking the defects observed upon PSMB5 knockdown. D–F THAP1 impairs the proteasomal degradation of short-lived proteins. D Schematic representation of the lentiviral Global Protein Stability (GPS) two-color fluorescent reporter system to monitor protein stability. E Stabilization of two model GFP-degron fusion proteins upon ablation of THAP1, as assessed by flow cytometry; the N-terminal peptide derived from PTGS1 harbors an N-terminal degron targeted by UBR-family E3 ligases69, while the C-terminal peptide derived from TNNC2 harbors a C-terminal degron targeted by Cul4DCAF1270. F Increased abundance of endogenous HIF-1α upon THAP1 disruption, as assayed by immunoblot. All immunoblot data is representative of at least two independent experiments. Source data are provided as a Source Data file.CC BY · PubMed Central
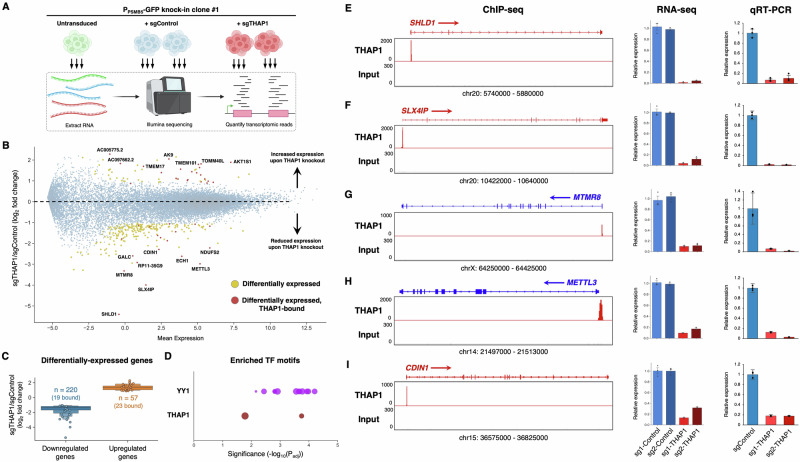
Fig. 6 Defining the transcriptional targets of THAP1. A Schematic representation of the RNA-seq experiment. Created in BioRender. Timms, R. (2025) https://BioRender.com/ x85w665. B, C Identifying the transcriptional targets of THAP1. A summary of the RNA-seq dataset is shown in (B): genes exhibiting differential expression between sgControl and sgTHAP1 cells (n = 277) are highlighted in yellow, with the subset of those genes that display THAP1 occupancy as assessed by ChIP-seq (n = 42) colored red. Expression changes amongst all differentially expressed genes are summarized in (C), with circles representing genes bound by THAP1. D Consensus binding sites for YY1 and THAP1 are enriched amongst the promoters of the 42 direct THAP1 target genes. Each circle represents an individual YY1 (purple) or THAP1 (red) binding site (see also Supplementary Fig. 4C); bubble size is proportional to the number of the gene promoters containing the motif. E–I Validation of THAP1 target genes. Five target genes directly activated by THAP1 binding are shown: ChIP-seq data indicating THAP1 occupancy is shown on the left; the RNA-seq expression data is summarized in the center, and qRT-PCR validation is shown on the right. Data are presented as mean values of n = 3 technical replicates +/− s.d. Source data are provided as a Source Data file.
Fig. 6 Defining the transcriptional targets of THAP1. A Schematic representation of the RNA-seq experiment. Created in BioRender. Timms, R. (2025) https://BioRender.com/ x85w665. B, C Identifying the transcriptional targets of THAP1. A summary of the RNA-seq dataset is shown in (B): genes exhibiting differential expression between sgControl and sgTHAP1 cells (n = 277) are highlighted in yellow, with the subset of those genes that display THAP1 occupancy as assessed by ChIP-seq (n = 42) colored red. Expression changes amongst all differentially expressed genes are summarized in (C), with circles representing genes bound by THAP1. D Consensus binding sites for YY1 and THAP1 are enriched amongst the promoters of the 42 direct THAP1 target genes. Each circle represents an individual YY1 (purple) or THAP1 (red) binding site (see also Supplementary Fig. 4C); bubble size is proportional to the number of the gene promoters containing the motif. E–I Validation of THAP1 target genes. Five target genes directly activated by THAP1 binding are shown: ChIP-seq data indicating THAP1 occupancy is shown on the left; the RNA-seq expression data is summarized in the center, and qRT-PCR validation is shown on the right. Data are presented as mean values of n = 3 technical replicates +/− s.d. Source data are provided as a Source Data file.CC BY · PubMed Central
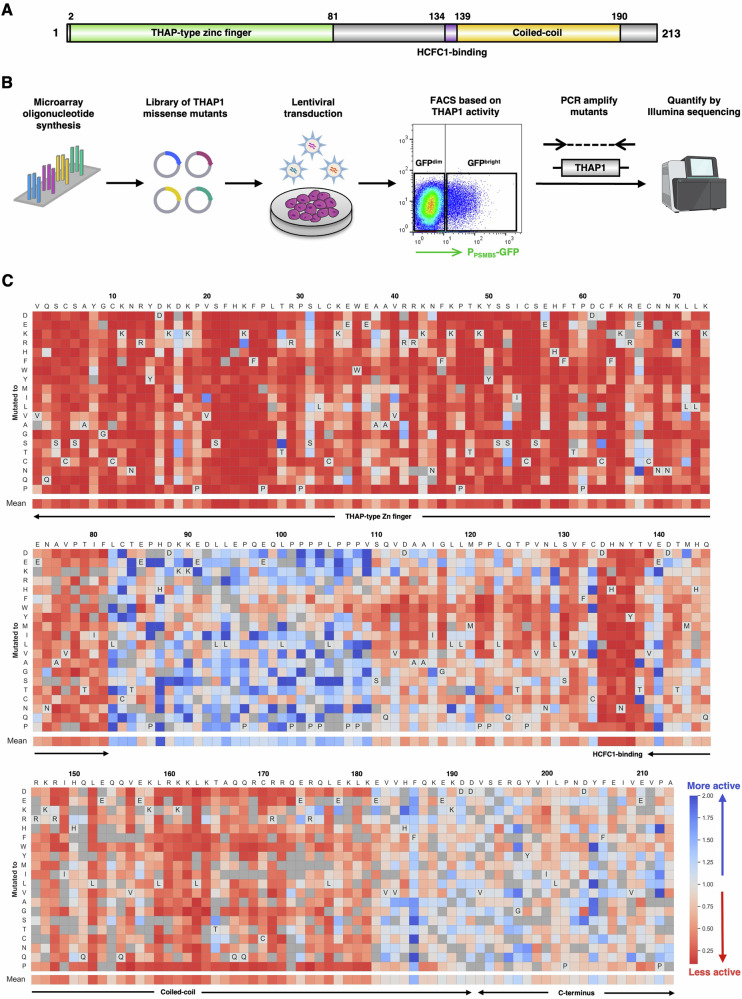
Fig. 7 A deep mutational scan defines the functional landscape of THAP1 mutations. A Schematic representation of the domain architecture of the THAP1 protein. B Schematic representation of the deep mutational scan, designed to interrogate the ability of all possible single amino acid variants of THAP1 to activate expression of the endogenous PPSMB5-GFP knock-in allele. Created in BioRender. Timms, R. (2025) https://BioRender.com/ x85w665. C Site-saturation mutagenesis reveals critical residues for THAP1 function. Each cell represents the performance of a single THAP1 mutant: the mean performance of all the wild-type proteins is centered at 1 (light gray), with red colors indicating mutants which abrogate activation of the PPSMB5-GFP reporter and blue colors indicating mutants which may enhance the activation of the PPSMB5-GFP reporter. Dark gray cells indicate mutants for which insufficient data was available for analysis.
Fig. 7 A deep mutational scan defines the functional landscape of THAP1 mutations. A Schematic representation of the domain architecture of the THAP1 protein. B Schematic representation of the deep mutational scan, designed to interrogate the ability of all possible single amino acid variants of THAP1 to activate expression of the endogenous PPSMB5-GFP knock-in allele. Created in BioRender. Timms, R. (2025) https://BioRender.com/ x85w665. C Site-saturation mutagenesis reveals critical residues for THAP1 function. Each cell represents the performance of a single THAP1 mutant: the mean performance of all the wild-type proteins is centered at 1 (light gray), with red colors indicating mutants which abrogate activation of the PPSMB5-GFP reporter and blue colors indicating mutants which may enhance the activation of the PPSMB5-GFP reporter. Dark gray cells indicate mutants for which insufficient data was available for analysis.CC BY · PubMed Central
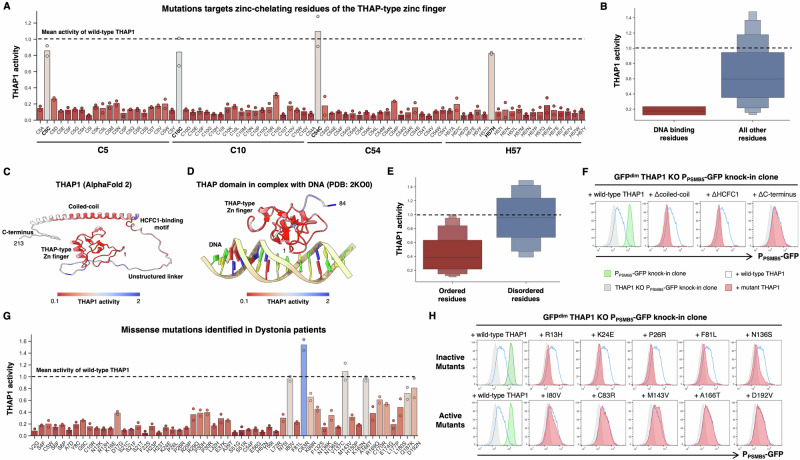
Fig. 8 Determining the functional effects of THAP1 mutations found in Dystonia patients. A, B The deep mutational scan successfully identifies THAP1 residues critical for DNA binding. A Performance of all THAP1 variants targeting zinc-chelating residues of the zinc finger domain. Bars indicate the mean of two replicate experiments. Constructs which encode the wild-type protein are indicated in bold; the mean activity exhibited across all the wild-type THAP1 constructs is set at 1 (dotted line). B Distribution of activity scores across all the THAP1 variants targeting residues previously determined22 to be important for DNA binding by THAP1. C–F Defining structure-function relationships for THAP1. Mean activity scores from the genetic screen were mapped onto the predicted structure of THAP1 (C) or the experimental structure of the THAP1 zinc finger domain22 (D). Overall, residues predicted to lie in ordered regions of the protein (AlphaFold pLDDT > 60) were much less tolerant of mutations than residues predicted to lie in disordered regions (E). Individual validation of the screen results was performed using flow cytometry: deletion of the coiled-coil and HCFC1-binding motif abrogated THAP1 function, whereas deletion of the disordered C-terminus did not (F). G, H Profiling the activity of THAP1 mutations found in Dystonia patients. G Performance of all missense variants identified in Dystonia patients, displayed as in (A). H Individual validation experiments measuring the activity of THAP1 mutants predicted to be inactive (top row) and THAP1 mutants predicted to be active (bottom row) by flow cytometry. See also Supplementary Fig. 5C–E.
Fig. 8 Determining the functional effects of THAP1 mutations found in Dystonia patients. A, B The deep mutational scan successfully identifies THAP1 residues critical for DNA binding. A Performance of all THAP1 variants targeting zinc-chelating residues of the zinc finger domain. Bars indicate the mean of two replicate experiments. Constructs which encode the wild-type protein are indicated in bold; the mean activity exhibited across all the wild-type THAP1 constructs is set at 1 (dotted line). B Distribution of activity scores across all the THAP1 variants targeting residues previously determined22 to be important for DNA binding by THAP1. C–F Defining structure-function relationships for THAP1. Mean activity scores from the genetic screen were mapped onto the predicted structure of THAP1 (C) or the experimental structure of the THAP1 zinc finger domain22 (D). Overall, residues predicted to lie in ordered regions of the protein (AlphaFold pLDDT > 60) were much less tolerant of mutations than residues predicted to lie in disordered regions (E). Individual validation of the screen results was performed using flow cytometry: deletion of the coiled-coil and HCFC1-binding motif abrogated THAP1 function, whereas deletion of the disordered C-terminus did not (F). G, H Profiling the activity of THAP1 mutations found in Dystonia patients. G Performance of all missense variants identified in Dystonia patients, displayed as in (A). H Individual validation experiments measuring the activity of THAP1 mutants predicted to be inactive (top row) and THAP1 mutants predicted to be active (bottom row) by flow cytometry. See also Supplementary Fig. 5C–E.CC BY · PubMed Central

Verification

Claims the paper makes

The claims and statistics of this paper haven’t been checked yet.

Run the check — free, no account needed. It reads the open-access text and checks the sources it cites.

A few free checks a day · papers already verified open instantly · results are public

Self-check

Percentages, sums and reported differences re-computed from the paper’s own numbers.

The self-check needs the paper’s full text.

Citations

Cites

Research works printed but not linked: 67

  1. Rape, M. Ubiquitylation at the crossroads of development and disease. Nature Reviews Molecular Cell Biology 19, 59–70 (2017). · DOI
  2. Kwon, Y. T. & Ciechanover, A. The Ubiquitin Code in the Ubiquitin-Proteasome System and Autophagy. Trends Biochem Sci 42, 873–886 (2017). · DOI
  3. Popovic, D., Vucic, D. & Dikic, I. Ubiquitination in disease pathogenesis and treatment. Nat Med 20, 1242–1253 (2014). · DOI
  4. Murata, S., Yashiroda, H. & Tanaka, K. Molecular mechanisms of proteasome assembly. Nature Reviews Molecular Cell Biology 10, 104–115 (2009). · DOI · Paper page
  5. Collins, G. A. & Goldberg, A. L. The Logic of the 26S Proteasome. Cell 169, 792–806 (2017). · DOI · Paper page
  6. Tanaka, K. The proteasome: Overview of structure and functions. Proc Jpn Acad Ser B Phys Biol Sci 85, 12 (2009). · DOI · Paper page
  7. Chen, P. & Hochstrasser, M. Autocatalytic subunit processing couples active site formation in the 20S proteasome to completion of assembly. Cell 86, 961–972 (1996). · DOI
  8. Dohmen, R. J., Willers, I. & Marques, A. J. Biting the hand that feeds: Rpn4-dependent feedback regulation of proteasome function. Biochim Biophys Acta 1773, 1599–1604 (2007). · DOI
  9. Xie, Y. & Varshavsky, A. RPN4 is a ligand, substrate, and transcriptional regulator of the 26S proteasome: a negative feedback circuit. Proc Natl Acad Sci USA 98, 3056–3061 (2001). · DOI · Paper page
  10. Radhakrishnan, S. K. et al. Transcription factor Nrf1 mediates the proteasome recovery pathway after proteasome inhibition in mammalian cells. Mol Cell 38, 17–28 (2010). · DOI · Paper page
  11. Steffen, J., Seeger, M., Koch, A. & Krüger, E. Proteasomal degradation is transcriptionally controlled by TCF11 via an ERAD-dependent feedback loop. Mol Cell 40, 147–158 (2010). · DOI
  12. Vilchez, D. et al. FOXO4 is necessary for neural differentiation of human embryonic stem cells. Aging Cell 12, 518 (2013). · DOI
  13. Vangala, J. R., Dudem, S., Jain, N. & Kalivendi, S. V. Regulation of PSMB5 Protein and β Subunits of Mammalian Proteasome by Constitutively Activated Signal Transducer and Activator of Transcription 3 (STAT3): POTENTIAL ROLE IN BORTEZOMIB-MEDIATED ANTICANCER THERAPY *. Journal Biological Chemistry 289, 12612–12622 (2014). · DOI
  14. Xu, H. et al. The CCAAT box-binding transcription factor NF-Y regulates basal expression of human proteasome genes. Biochimica et Biophysica Acta (BBA) - Molecular Cell Research 1823, 818–825 (2012). · DOI
  15. Tsherniak, A. et al. Defining a Cancer Dependency Map. Cell 170, 564–576.e16 (2017). · DOI · Paper page
  16. McDonald, E. R. et al. Project DRIVE: A Compendium of Cancer Dependencies and Synthetic Lethal Relationships Uncovered by Large-Scale, Deep RNAi Screening. Cell 170, 577–592.e10 (2017). · DOI · Paper page
  17. Wang, T. et al. Gene Essentiality Profiling Reveals Gene Networks and Synthetic Lethal Interactions with Oncogenic Ras. Cell 168, 890–903.e15 (2017). · DOI · Paper page
  18. Pan, J. et al. Interrogation of Mammalian Protein Complex Structure, Function, and Membership Using Genome-Scale Fitness Screens. Cell Syst 6, 555–568.e7 (2018). · DOI
  19. Rauscher, B. et al. Toward an integrated map of genetic interactions in cancer cells. Mol Syst Biol 14, (2018). · DOI
  20. Kim, E. et al. A network of human functional gene interactions from knockout fitness screens in cancer cells. Life Sci Alliance 2, (2019). · DOI
  21. Bessière, D. et al. Structure-Function Analysis of the THAP Zinc Finger of THAP1, a Large C2CH DNA-binding Module Linked to Rb/E2F Pathways. Journal Biological Chemistry 283, 4352–4363 (2008). · DOI
  22. Shinoda, K. et al. The dystonia gene THAP1 controls DNA double-strand break repair choice. Mol Cell 81, 2611–2624.e10 (2021). · DOI
  23. Cayrol, C. et al. The THAP-zinc finger protein THAP1 regulates endothelial cell proliferation through modulation of pRB/E2F cell-cycle target genes. Blood 109, 584–594 (2007). · DOI
  24. Yellajoshyula, D. et al. The DYT6 Dystonia Protein THAP1 Regulates Myelination Within The Oligodendrocyte Lineage. Dev Cell 42, 52 (2017). · DOI · Paper page
  25. Aguilo, F. et al. THAP1: Role in Mouse Embryonic Stem Cell Survival and Differentiation. Stem Cell Reports 9, 92 (2017). · DOI
  26. Ortiz-Virumbrales, M. et al. Dystonia type 6 gene product Thap1: identification of a 50 kDa DNA-binding species in neuronal nuclear fractions. Acta Neuropathol Commun 2, (2014). · DOI
  27. Ruiz, M. et al. Abnormalities of motor function, transcription and cerebellar structure in mouse models of THAP1 dystonia. Hum Mol Genet 24, 7159–7170 (2015). · DOI
  28. Almasy, L. et al. Idiopathic torsion dystonia linked to chromosome 8 in two Mennonite families. Ann Neurol 42, 670–673 (1997). · DOI
  29. Lange, L. M. et al. Genotype–Phenotype Relations for Isolated Dystonia Genes: MDSGene Systematic Review. Movement Disorders 36, 1086–1103 (2021). · DOI
  30. Rodrigo-Brenni, M. C., Gutierrez, E. & Hegde, R. S. Cytosolic Quality Control of Mislocalized Proteins Requires RNF126 Recruitment to Bag6. Mol Cell 55, 227 (2014). · DOI
  31. Maxwell, P. H. et al. The tumour suppressor protein VHL targets hypoxia-inducible factors for oxygen-dependent proteolysis. Nature 399, 271–275 (1999). · DOI · Paper page
  32. Hämmerle, M. et al. Proteins of Newly Isolated Mutants and the Amino-terminal Proline Are Essential for Ubiquitin-Proteasome-catalyzed Catabolite Degradation of Fructose-1,6-bisphosphatase of Saccharomyces cerevisiae. Journal Biological Chemistry 273, 25000–25005 (1998). · DOI
  33. Momand, J., Zambetti, G. P., Olson, D. C., George, D. & Levine, A. J. The mdm-2 oncogene product forms a complex with the p53 protein and inhibits p53-mediated transactivation. Cell 69, 1237–1245 (1992). · DOI · Paper page
  34. Chaikovsky, A. C. et al. The AMBRA1 E3 ligase adaptor regulates the stability of cyclin D. Nature 592, 794–798 (2021). · DOI
  35. Maiani, E. et al. AMBRA1 regulates cyclin D to guard S-phase entry and genomic integrity. Nature 592, 799–803 (2021). · DOI
  36. Simoneschi, D. et al. CRL4AMBRA1 is a master regulator of D-type cyclins. Nature 592, 789 (2021). · DOI
  37. Eleuteri, A. M., Kohanski, R. A., Cardozo, C. & Orlowski, M. Bovine Spleen Multicatalytic Proteinase Complex (Proteasome): REPLACEMENT OF X, Y, AND Z SUBUNITS BY LMP7, LMP2, AND MECL1 AND CHANGES IN PROPERTIES AND SPECIFICITY. Journal Biological Chemistry 272, 11824–11831 (1997). · DOI
  38. Noda, C., Tanahashi, N., Shimbara, N., Hendil, K. B. & Tanaka, K. Tissue Distribution of Constitutive Proteasomes, Immunoproteasomes, and PA28 in Rats. Biochem Biophys Res Commun 277, 348–354 (2000). · DOI
  39. Bajar, B. T. et al. Improving brightness and photostability of green and red fluorescent proteins for live cell imaging and FRET reporting. Scientific Reports 6, 1–12 (2016). · DOI
  40. Dunham, I. et al. An Integrated Encyclopedia of DNA Elements in the Human Genome. Nature 489, 57 (2012). · DOI · Paper page
  41. Marzo, M., Liu, D., Ruiz, A. & Chalmers, R. Identification of multiple binding sites for the THAP domain of the Galileo transposase in the long terminal inverted-repeats. Gene 525, 84–89 (2013). · DOI
  42. Li, X., Li, Y., Arendt, C. S. & Hochstrasser, M. Distinct Elements in the Proteasomal 5 Subunit Propeptide Required for Autocatalytic Processing and Proteasome Assembly *. Journal Biological Chemistry 291, 1991–2003 (2016). · DOI
  43. Budenholzer, L., Cheng, C. L., Li, Y. & Hochstrasser, M. Proteasome Structure and Assembly. J Mol Biol 429, 3500 (2017). · DOI
  44. Shi, C. X. et al. Proteasome subunits differentially control Myeloma cell viability and proteasome inhibitor sensitivity. Mol Cancer Res 18, 1453 (2020). · DOI
  45. Yen, H. C. S., Xu, Q., Chou, D. M., Zhao, Z. & Elledge, S. J. Global protein stability profiling in mammalian cells. Science (1979) 322, 918–923 (2008).
  46. Salceda, S. & Caro, J. Hypoxia-inducible Factor 1α (HIF-1α) Protein Is Rapidly Degraded by the Ubiquitin-Proteasome System under Normoxic Conditions: ITS STABILIZATION BY HYPOXIA DEPENDS ON REDOX-INDUCED CHANGES. Journal Biological Chemistry 272, 22642–22647 (1997). · DOI · Paper page
  47. Domingo, A. et al. Dystonia-specific mutations in THAP1 alter transcription of genes associated with neurodevelopment and myelin. American Journal Human Genetics 108, 2145–2158 (2021). · DOI
  48. Yellajoshyula, D. et al. A pathogenic DYT-THAP1 dystonia mutation causes hypomyelination and loss of YY1 binding. Hum Mol Genet 31, 1096–1104 (2022). · DOI
  49. Zeng, C., Huang, W., Li, Y. & Weng, H. Roles of METTL3 in cancer: Mechanisms and therapeutic targeting. J Hematol Oncol 13, 1–15 (2020). · DOI
  50. Bressman, S. B. et al. Mutations in THAP1 (DYT6) in early-onset dystonia: a genetic screening study. Lancet Neurol 8, 441–446 (2009). · DOI
  51. Fuchs, T. et al. Mutations in the THAP1 gene are responsible for DYT6 primary torsion dystonia. Nature Genetics 41, 286–288 (2009). · DOI
  52. Houlden, H. et al. THAP1 mutations (DYT6) are an additional cause of early-onset dystonia. Neurology 74, 846 (2010). · DOI
  53. Söhn, A. S. et al. Prevalence of THAP1 sequence variants in German patients with primary dystonia. Movement Disorders 25, 1982–1986 (2010). · DOI
  54. Xiao, J. et al. Novel THAP1 sequence variants in primary dystonia. Neurology 74, 229–238 (2010). · DOI
  55. LeDoux, M. S. et al. Genotype–phenotype correlations in THAP1 dystonia: Molecular foundations and description of new cases. Parkinsonism Relat Disord 18, 414–425 (2012). · DOI
  56. Lohmann, K. et al. Identification and functional analysis of novel THAP1 mutations. European Journal Human Genetics 20, 171–175 (2011). · DOI
  57. Mazars, R. et al. The THAP-Zinc Finger Protein THAP1 Associates with Coactivator HCF-1 and O-GlcNAc Transferase: A LINK BETWEEN DYT6 AND DYT3 DYSTONIAS*. J Biol Chem 285, 13364 (2010). · DOI
  58. Chapiro, J. et al. Destructive cleavage of antigenic peptides either by the immunoproteasome or by the standard proteasome results in differential antigen presentation. J Immunol 176, 1053–1061 (2006). · DOI
  59. Kincaid, E. Z. et al. Mice completely lacking immunoproteasomes show major changes in antigen presentation. Nature Immunology 13, 129–135 (2011). · DOI
  60. Murata, S., Takahama, Y., Kasahara, M. & Tanaka, K. The immunoproteasome and thymoproteasome: functions, evolution and human disease. Nature Immunology 19, 923–931 (2018). · DOI
  61. Cheng, F. et al. DYT6 mutated THAP1 is a cell type dependent regulator of the SP1 family. Brain 145, 3968–3984 (2022). · DOI
  62. Tseng, C. S., Chao, Y. W., Liu, Y. H., Huang, Y. S. & Chao, H. W. Dysregulated proteostasis network in neuronal diseases. Front Cell Dev Biol 11, (2023). · DOI
  63. Sanson, K. R. et al. Optimized libraries for CRISPR-Cas9 genetic screens with multiple modalities. Nature Communications 9, 1–15 (2018). · DOI · Paper page
  64. Yazgili, A. S. et al. In-gel proteasome assay to determine the activity, amount, and composition of proteasome complexes from mammalian cells or tissues. STAR Protoc 2, (2021). · DOI
  65. Clouaire, T. et al. The THAP domain of THAP1 is a large C2CH module with zinc-dependent sequence-specific DNA-binding activity. Proc Natl Acad Sci USA 102, 6907–6912 (2005). · DOI
  66. Timms, R. T. et al. A glycine-specific N-degron pathway mediates the quality control of protein N-myristoylation. Science 365, (2019). · DOI
  67. Koren, I. et al. The Eukaryotic Proteome Is Shaped by E3 Ubiquitin Ligases Targeting C-Terminal Degrons. Cell 173, 1622–1635.e14 (2018). · DOI

Metadata

Authors
Ramage, D. E., Grant, D. W., & Timms, R. T.
Affiliations
University of Cambridge (GB)
Corresponding author
Timms, Richard T.
Venue
Nature Communications
Published
2025-02-10
Volume
16
Issue
1
Pages
1511-1511
ISSN
2041-1723 (ISSN-L)
OpenAlex
W4407358693
Cited by
6
References
3
Citations by year
2026: 4 · 2025: 2
FWCI
1.79
Type
journal article
Language
en
Open access
Locations
  • Nature Communications (publishedVersion, cc-by)
  • PubMed Central (publishedVersion, cc-by)
  • PubMed (publishedVersion)
  • DOAJ (DOAJ: Directory of Open Access Journals) (submittedVersion)
Funders
Academy of Medical Sciences (SBF007\100019)
Topics
  • Life Sciences › Biochemistry, Genetics and Molecular Biology › Molecular Biology › Ubiquitin and proteasome pathways
  • Life Sciences › Biochemistry, Genetics and Molecular Biology › Molecular Biology › Heat shock proteins research
  • Life Sciences › Biochemistry, Genetics and Molecular Biology › Molecular Biology › Protein Degradation and Inhibitors
Keywords
THAP1, PSMB5, 26S proteasome, proteasome assembly, ubiquitin-proteasome system, proteostasis, loss-of-function mutations, dystonia, deep mutational scanning, transcriptional regulation, protein degradation
MeSH terms
Loss of Function Mutation, Proteostasis, Animals, DNA-Binding Proteins, Dystonia, Humans, Proteasome Endopeptidase Complex, Apoptosis Regulatory Proteins, HEK293 Cells

About these checks

Registry, retraction, Cites and statistics results are computed, not judged, with one exception: a printed reference that no index lists is read once by a model before it counts as a citation error. Claims are extracted by a model and kept only when their quote appears verbatim in the text; each cited source is then checked, with a model’s help, for whether it says what the claim relies on. Those verdicts can be wrong — read the claim’s quote and the cited source before relying on one.

Statistics and arithmetic are recomputed, not judged.

Confidence bands are shown only for fields calibrated on our annotated test set. None is calibrated yet, so no band is shown.

What counts as a claim ›How we measure confidence ›How we check this ›

Are you an author, or do you see a problem with this page? Request a review