

The DOI matches its Crossref record; 59 of the 59 references it cites were found in a registry or an index.
Molecular mechanisms of SLC30A10-mediated manganese transport
Open accessPublished version of a preprint
Abstract
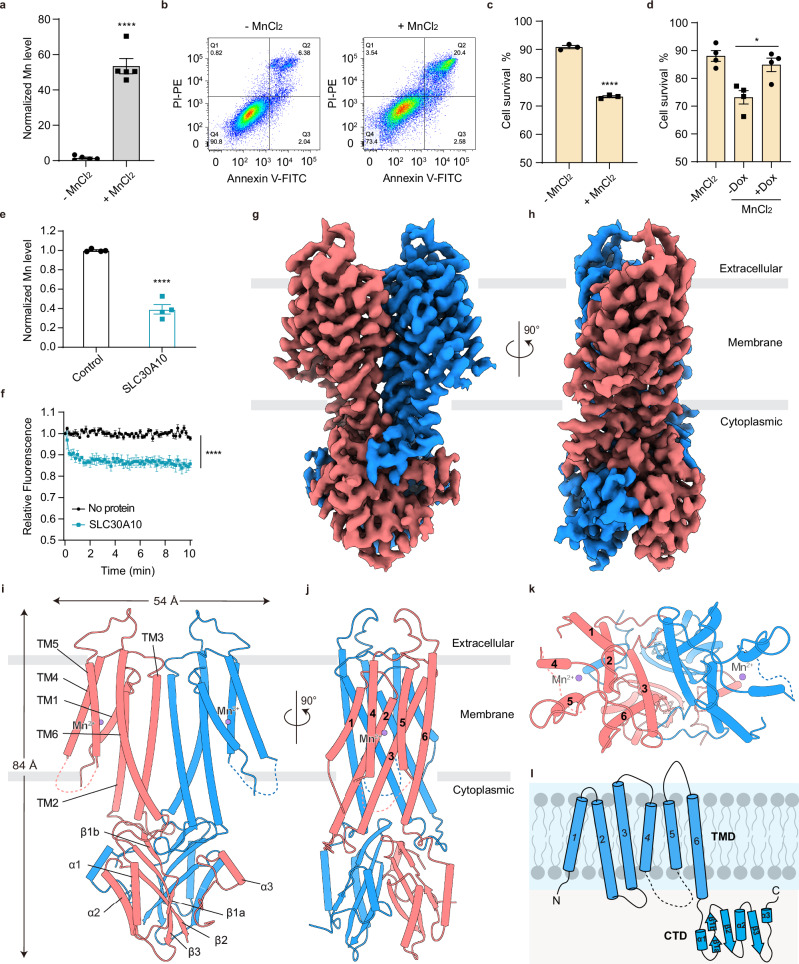
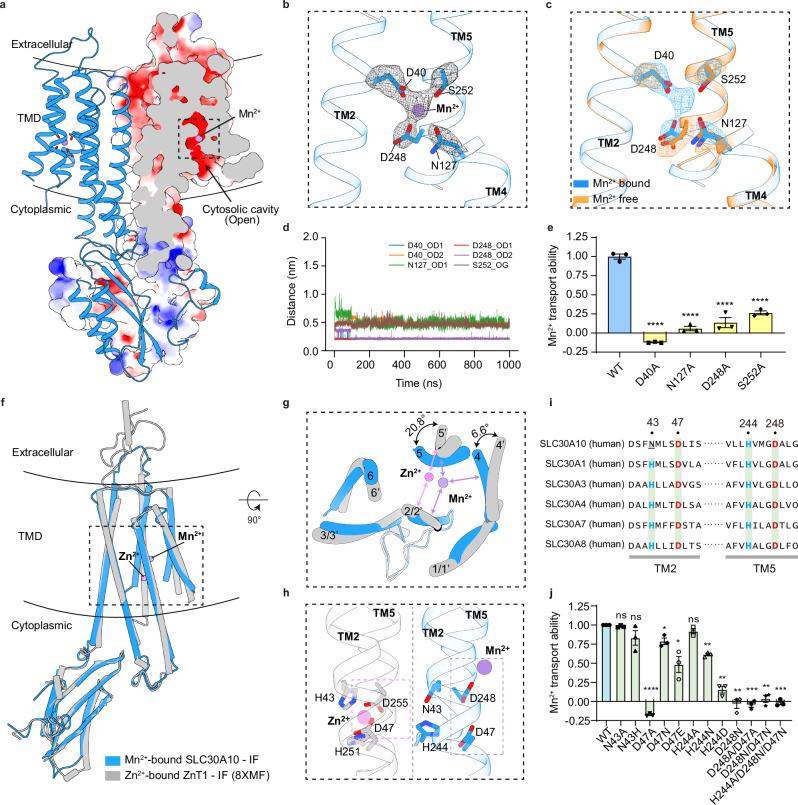
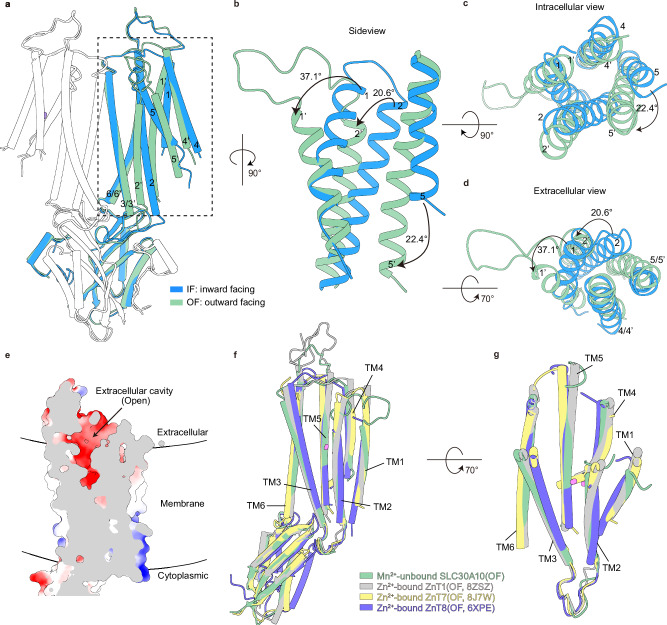
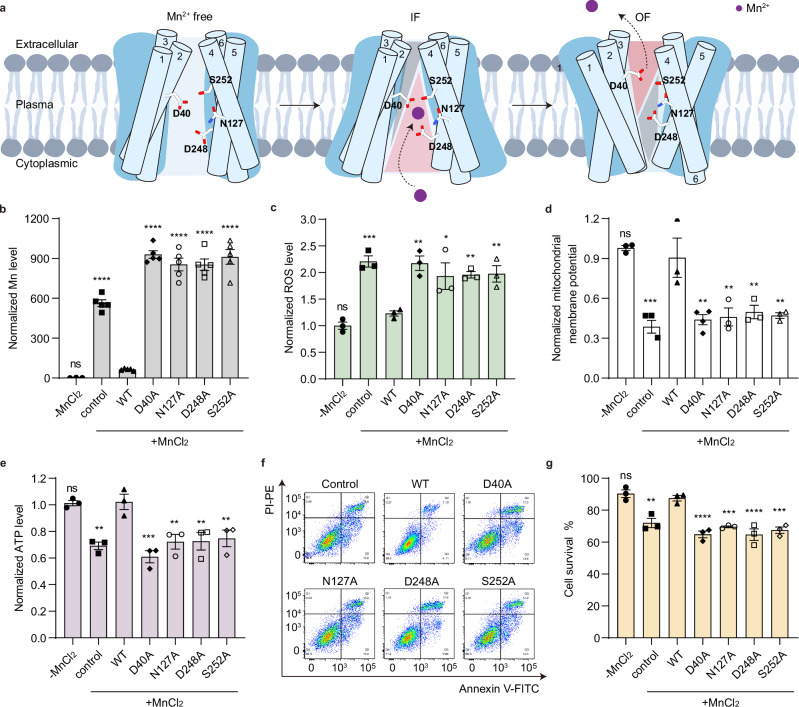
Abstract Manganese (Mn) is an essential trace element required for various physiological processes, yet excessive levels induce oxidative stress and lead to severe health issues. The transporter SLC30A10 is crucial for maintaining Mn homeostasis by exporting Mn from cells to prevent toxic accumulation. Mutations in the SLC30A10 gene disrupt this function, resulting in manganese accumulation, which leads to disorders such as hypermanganesemia with dystonia 1 (HMNDYT1). Here, we show that SLC30A10 mediates Mn efflux under elevated Mn conditions, alleviating oxidative stress and preserving mitochondrial integrity. High-resolution cryo-EM structures reveal a unique Mn-binding site in SLC30A10, setting it apart from other SLC30 family transporters. We further demonstrate that the HMNDYT1-linked D40A mutation disrupts the binding and transport of Mn, identifying D40 as a potential therapeutic target. These findings provide structural insights into Mn transport and potential avenues for targeting Mn toxicity.
Overview
The claims and statistics of this paper haven’t been checked yet.
Run the check — free, no account needed. It reads the open-access text and checks the sources it cites.
Integrity signals
Registry
Cites
Statistics
Figures
Verification
Claims the paper makes
The claims and statistics of this paper haven’t been checked yet.
Run the check — free, no account needed. It reads the open-access text and checks the sources it cites.
Self-check
Percentages, sums and reported differences re-computed from the paper’s own numbers.
The self-check needs the paper’s full text.
Citations
Cites
UCSF Chimera—A visualization system for exploratory research and analysis
Pettersen, E. F., Goddard, T. D., Huang, C. C., Couch, G. S., Greenblatt, D. M., Meng, E. C., & Ferrin, T. E. (2004) · Journal of Computational Chemistry · doi:10.1002/jcc.20084 · Cited by 45,828
Highly accurate protein structure prediction with AlphaFold
Jumper, J., Evans, R., Pritzel, A., Green, T., Figurnov, M., Ronneberger, O., Tunyasuvunakool, K., Bates, R., Žídek, A., Potapenko, A., et al. (2021) · Nature · doi:10.1038/s41586-021-03819-2 · Cited by 43,764
Molecular dynamics with coupling to an external bath
Berendsen, H. J. C., Postma, J. P. M., van Gunsteren, W. F., DiNola, A., & Haak, J. R. (1984) · The Journal of Chemical Physics · doi:10.1063/1.448118 · Cited by 30,700
Coot : model-building tools for molecular graphics
Emsley, P., & Cowtan, K. (2004) · Acta Crystallographica Section D Biological Crystallography · doi:10.1107/s0907444904019158 · Cited by 30,571
Particle mesh Ewald: An N ⋅log( N ) method for Ewald sums in large systems
Darden, T., York, D., & Pedersen, L. (1993) · The Journal of Chemical Physics · doi:10.1063/1.464397 · Cited by 30,546
Abraham, M. J., Murtola, T., Schulz, R., Páll, S., Smith, J. C., Hess, B., & Lindahl, E. (2015) · SoftwareX · doi:10.1016/j.softx.2015.06.001 · Cited by 27,190
Polymorphic transitions in single crystals: A new molecular dynamics method
Parrinello, M., & Rahman, A. (1981) · Journal of Applied Physics · doi:10.1063/1.328693 · Cited by 19,790
cryoSPARC: algorithms for rapid unsupervised cryo-EM structure determination
Punjani, A., Rubinstein, J. L., Fleet, D. J., & Brubaker, M. A. (2017) · Nature Methods · doi:10.1038/nmeth.4169 · Cited by 11,626
CHARMM‐GUI: A web‐based graphical user interface for CHARMM
Jo, S., Kim, T., Iyer, V. G., & Im, W. (2008) · Journal of Computational Chemistry · doi:10.1002/jcc.20945 · Cited by 9,284
MotionCor2: anisotropic correction of beam-induced motion for improved cryo-electron microscopy
Zheng, S. Q., Palovcak, E., Armache, J.-P., Verba, K. A., Cheng, Y., & Agard, D. A. (2017) · Nature Methods · doi:10.1038/nmeth.4193 · Cited by 7,777
Structure and Dynamics of the TIP3P, SPC, and SPC/E Water Models at 298 K
Mark, P., & Nilsson, L. (2001) · The Journal of Physical Chemistry A · doi:10.1021/jp003020w · Cited by 4,571
Update of the CHARMM All-Atom Additive Force Field for Lipids: Validation on Six Lipid Types
Klauda, J. B., Venable, R. M., Freites, J. A., O’Connor, J. W., Tobias, D. J., Mondragon-Ramirez, C., Vorobyov, I., MacKerell, A. D., & Pastor, R. W. (2010) · The Journal of Physical Chemistry B · doi:10.1021/jp101759q · Cited by 4,501
Gctf: Real-time CTF determination and correction
Zhang, K. (2015) · Journal of Structural Biology · doi:10.1016/j.jsb.2015.11.003 · Cited by 3,428
Real-space refinement in PHENIX for cryo-EM and crystallography
Afonine, P. V., Poon, B. K., Read, R. J., Sobolev, O. V., Terwilliger, T. C., Urzhumtsev, A., & Adams, P. D. (2018) · Acta Crystallographica Section D Structural Biology · doi:10.1107/s2059798318006551 · Cited by 3,281
Automation of the CHARMM General Force Field (CGenFF) I: Bond Perception and Atom Typing
Vanommeslaeghe, K., & MacKerell, A. D. (2012) · Journal of Chemical Information and Modeling · doi:10.1021/ci300363c · Cited by 2,208
Neurobehavioural effects of developmental toxicity
Grandjean, P., & Landrigan, P. J. (2014) · The Lancet Neurology · doi:10.1016/s1474-4422(13)70278-3 · Cited by 1,886
Vanommeslaeghe, K., Raman, E. P., & MacKerell, A. D. (2012) · Journal of Chemical Information and Modeling · doi:10.1021/ci3003649 · Cited by 1,750
Non-uniform refinement: adaptive regularization improves single-particle cryo-EM reconstruction
Punjani, A., Zhang, H., & Fleet, D. J. (2020) · Nature Methods · doi:10.1038/s41592-020-00990-8 · Cited by 1,683
Manganese Is Essential for Neuronal Health
Horning, K. J., Caito, S. W., Tipps, K. G., Bowman, A. B., & Aschner, M. (2015) · Annual Review of Nutrition · doi:10.1146/annurev-nutr-071714-034419 · Cited by 602
Quadri, M., Federico, A., Zhao, T., Breedveld, G. J., Battisti, C., Delnooz, C., Severijnen, L.-A., Di Toro Mammarella, L., Mignarri, A., Monti, L., et al. (2012) · The American Journal of Human Genetics · doi:10.1016/j.ajhg.2012.01.017 · Cited by 416
Tuschl, K., Clayton, P. T., Gospe, S. M., Gulab, S., Ibrahim, S., Singhi, P., Aulakh, R., Ribeiro, R. T., Barsottini, O. G., Zaki, M. S., et al. (2012) · The American Journal of Human Genetics · doi:10.1016/j.ajhg.2012.01.018 · Cited by 375
Leyva‐Illades, D., Chen, P., Zogzas, C. E., Hutchens, S., Mercado, J. M., Swaim, C. D., Morrisett, R. A., Bowman, A. B., Aschner, M., & Mukhopadhyay, S. (2014) · Journal of Neuroscience · doi:10.1523/jneurosci.2329-14.2014 · Cited by 207
The role of manganese dysregulation in neurological disease: emerging evidence
Budinger, D., Barral, S., Soo, A. K. S., & Kurian, M. A. (2021) · The Lancet Neurology · doi:10.1016/s1474-4422(21)00238-6 · Cited by 142
Zinc transporter 1 functions in copper uptake and cuproptosis
Li, Y., Ma, J., Wang, R., Luo, Y., Zheng, S., & Wang, X. (2024) · Cell Metabolism · doi:10.1016/j.cmet.2024.07.009 · Cited by 124
Genetic Disorders of Manganese Metabolism
Anagianni, S., & Tuschl, K. (2019) · Current Neurology and Neuroscience Reports · doi:10.1007/s11910-019-0942-y · Cited by 120
Manganese transporter Slc30a10 controls physiological manganese excretion and toxicity
Mercadante, C. J., Prajapati, M., Conboy, H. L., Dash, M. E., Herrera, C., Pettiglio, M. A., Cintrón-Rivera, L. G., Salesky, M., Rao, D. B., & Bartnikas, T. B. (2019) · Journal of Clinical Investigation · doi:10.1172/jci129710 · Cited by 110
Taylor, C. A., Hutchens, S., Liu, C., Jursa, T., Shawlot, W., Aschner, M., Smith, D. R., & Mukhopadhyay, S. (2018) · Journal of Biological Chemistry · doi:10.1074/jbc.ra118.005628 · Cited by 106
Nishito, Y., Tsuji, N., Fujishiro, H., Takeda, T.-A., Yamazaki, T., Teranishi, F., Okazaki, F., Matsunaga, A., Tuschl, K., Rao, R., et al. (2016) · Journal of Biological Chemistry · doi:10.1074/jbc.m116.728014 · Cited by 96
Mukhopadhyay, S., & Linstedt, A. D. (2010) · Proceedings of the National Academy of Sciences · doi:10.1073/pnas.1013642108 · Cited by 91
Deficiency in the manganese efflux transporter SLC30A10 induces severe hypothyroidism in mice
Hutchens, S., Liu, C., Jursa, T., Shawlot, W., Dray, B. K., Yin, W., Gore, A. C., Aschner, M., Smith, D. R., & Mukhopadhyay, S. (2017) · Journal of Biological Chemistry · doi:10.1074/jbc.m117.783605 · Cited by 84
Cryo-EM structures of human ZnT8 in both outward- and inward-facing conformations
Xue, J., Xie, T., Zeng, W., Jiang, Y., & Bai, X.-C. (2020) · eLife · doi:10.7554/elife.58823 · Cited by 78
Manganese-induced Trafficking and Turnover of the cis -Golgi Glycoprotein GPP130
Mukhopadhyay, S., Bachert, C., Smith, D. R., & Linstedt, A. D. (2010) · Molecular Biology of the Cell · doi:10.1091/mbc.e09-11-0985 · Cited by 77
Affected energy metabolism under manganese stress governs cellular toxicity
Kaur, G., Kumar, V., Arora, A., Tomar, A., Ashish, Sur, R., & Dutta, D. (2017) · Scientific Reports · doi:10.1038/s41598-017-12004-3 · Cited by 74
Zogzas, C. E., Aschner, M., & Mukhopadhyay, S. (2016) · Journal of Biological Chemistry · doi:10.1074/jbc.m116.726935 · Cited by 73
Zhang, H., Mi, L., Wang, T., Yuan, L., Li, X., Dong, L., Zhao, P., Fu, J., Yao, B., & Zhou, Z. (2016) · Toxicology in Vitro · doi:10.1016/j.tiv.2016.04.006 · Cited by 69
Manganese transport disorder: Novel SLC30A10 mutations and early phenotypes
Quadri, M., Kamate, M., Sharma, S., Olgiati, S., Graafland, J., Breedveld, G. J., Kori, I., Hattiholi, V. V., Jain, P., Aneja, S., et al. (2015) · Movement Disorders · doi:10.1002/mds.26202 · Cited by 63
Liu, C., Hutchens, S., Jursa, T., Shawlot, W., Polishchuk, E. V., Polishchuk, R., Dray, B. K., Gore, A. C., Aschner, M., Smith, D. R., et al. (2017) · Journal of Biological Chemistry · doi:10.1074/jbc.m117.804989 · Cited by 61
Defective Mitochondrial Dynamics Underlie Manganese-Induced Neurotoxicity
Morcillo, P., Cordero, H., Ijomone, O. M., Ayodele, A. J., Bornhorst, J., Gunther-Cummins, L., Macaluso, F., Bowman, A. B., & Aschner, M. (2021) · Molecular Neurobiology · doi:10.1007/s12035-021-02341-w · Cited by 58
Liu, C., Yan, D., Wang, C., Ma, Z., Deng, Y. L., Liu, W., & Xu, B. (2019) · Journal of Cellular and Molecular Medicine · doi:10.1111/jcmm.14732 · Cited by 52
Zaki, M. S., Issa, M. Y., Elbendary, H. M., El‐Karaksy, H., Hosny, H., Ghobrial, C., El-Safty, A., El-Hennawy, A., Oraby, A., Selim, L., et al. (2017) · Clinical Genetics · doi:10.1111/cge.13184 · Cited by 46
Mukhtiar, K., Ibrahim, S. H., Tuschl, K., & Mills, P. B. (2016) · Brain and Development · doi:10.1016/j.braindev.2016.04.005 · Cited by 44
Liu, C., Jursa, T., Aschner, M., Smith, D. R., & Mukhopadhyay, S. (2021) · Proceedings of the National Academy of Sciences · doi:10.1073/pnas.2107673118 · Cited by 41
Bui, H. B., Watanabe, S. P., Nomura, N., Liu, K., Uemura, T., Inoue, M., Tsutsumi, A., Fujita, H., Kinoshita, K., Kato, Y., et al. (2023) · Nature Communications · doi:10.1038/s41467-023-40521-5 · Cited by 35
Zogzas, C. E., & Mukhopadhyay, S. (2018) · Metallomics · doi:10.1039/c8mt00115d · Cited by 33
Blood manganese and nonalcoholic fatty liver disease: A cohort-based case-control study
Zhang, D., Wu, S., Lan, Y., Chen, S., Wang, Y., Sun, Y., Liao, W., & Wang, L. (2021) · Chemosphere · doi:10.1016/j.chemosphere.2021.132316 · Cited by 32
Structural insights into the calcium-coupled zinc export of human ZnT1
Sun, C., He, B., Gao, Y., Wang, X., Liu, X., & Sun, L. (2024) · Science Advances · doi:10.1126/sciadv.adk5128 · Cited by 31
Structural basis for metal ion transport by the human SLC11 proteins DMT1 and NRAMP1
Liziczai, M., Fuchs, A., Manatschal, C., & Dutzler, R. (2025) · Nature Communications · doi:10.1038/s41467-024-54705-0 · Cited by 31
The Intestinal Transporter SLC30A1 Plays a Critical Role in Regulating Systemic Zinc Homeostasis
Sun, S., Xie, E., Xu, S., Ji, S., Wang, S., Shen, J. M., Wang, R., Shen, X., Su, Y., Song, Z., et al. (2024) · Advanced Science · doi:10.1002/advs.202406421 · Cited by 30
Self-citationTavasoli, A., Rafsanjani, K. A., Hemmati, S., Mojbafan, M., Zarei, E., & Hosseini, S. (2019) · BMC Pediatrics · doi:10.1186/s12887-019-1611-7 · Cited by 28
Manganese-driven CoQ deficiency
Diessl, J., Berndtsson, J., Broeskamp, F., Habernig, L., Kohler, V., Vazquez‐Calvo, C., Nandy, A., Peselj, C., Drobysheva, S., Pélosi, L., et al. (2022) · Nature Communications · doi:10.1038/s41467-022-33641-x · Cited by 26
Gulab, S., Al-Said, Y. A., & Kayyali, H. R. (2017) · Neuropediatrics · doi:10.1055/s-0037-1608778 · Cited by 25
Pradhan, S. H., Liu, J. Y., & Sayes, C. M. (2023) · International Journal of Molecular Sciences · doi:10.3390/ijms242216129 · Cited by 19
Hypermanganesemia with Dystonia 1: A Novel Mutation and Response to Iron Supplementation
Yapıcı, Z., Tuschl, K., & Eraksoy, M. (2019) · Movement Disorders Clinical Practice · doi:10.1002/mdc3.12861 · Cited by 18
Fructose overconsumption impairs hepatic manganese homeostasis and ammonia disposal
Shi, J., Chen, Y.-X., Feng, Y., Yang, X., Lin, J., Wang, T., Wei, C., Ma, X., Yang, R., Cao, D., et al. (2023) · Nature Communications · doi:10.1038/s41467-023-43609-0 · Cited by 18
Structural insights into human zinc transporter ZnT1 mediated Zn2+ efflux
Long, Y., Zhu, Z., Zhou, Z., Yang, C., Chao, Y., Wang, Y., Zhou, Q., Wang, M., & Qu, Q. (2024) · EMBO Reports · doi:10.1038/s44319-024-00287-3 · Cited by 17
Li, W.-H., Xiang, Z.-T.-Y., Lu, A.-X., Wang, S., & Yan, C. (2023) · Ecotoxicology and Environmental Safety · doi:10.1016/j.ecoenv.2023.115326 · Cited by 15
Self-citationGurol, K. C., Jursa, T., Cho, E. J., Fast, W. L., Dalby, K. N., Smith, D. R., & Mukhopadhyay, S. (2024) · Proceedings of the National Academy of Sciences · doi:10.1073/pnas.2402538121 · Cited by 15
Rokad, D., Harischandra, D. S., Samidurai, M., Chang, Y.-T., Luo, J. D., Lawana, V., Sarkar, S., Palanisamy, B. N., Manne, S., Kim, D.-S., et al. (2024) · International Journal of Molecular Sciences · doi:10.3390/ijms252212207 · Cited by 11
Ishida, H., Yo, R., Zhang, Z., Shimizu, T., & Ohto, U. (2024) · FEBS Letters · doi:10.1002/1873-3468.15047 · Cited by 10
Research works printed but not linked: 2
- Kwakye, G. F., Li, D., Kabobel, O. A. & Bowman, A. B. Cellular fura-2 manganese extraction assay (CFMEA). Curr. Protoc. Toxicol. Chapter 12, Unit12–Unit18 (2011).
- Hess, B., Bekker, H., Berendsen, H. J. C. & Fraaije, J. G. E. M. LINCS: linear Constraint Solver Mol. Simul. 18, 1463–1472 (1997).
Metadata
- Authors
- Shen, X., Zhang, J. K., Sun, P., Zhong, H., He, R., Wang, S., Guo, X., & Yang, H.
- Affiliations
- Fudan University (CN)
- Corresponding author
- Yang, Hanting
- Venue
- Nature Communications
- Published
- 2025-09-29
- Volume
- 16
- Issue
- 1
- Pages
- 8581-8581
- ISSN
- 2041-1723 (ISSN-L)
- PMC
- PMC12480533
- OpenAlex
- W4414601776
- Cited by
- 14
- References
- 59
- Citations by year
- 2026: 13 · 2025: 1
- FWCI
- 5.96
- Type
- journal article
- Language
- en
- Open access
- gold
- doi.org
- Licence
- cc-by-nc-nd
- creativecommons.org/licenses/by-nc-nd/4.0 (tdm)
- creativecommons.org/licenses/by-nc-nd/4.0 (vor)
- Locations
- Nature Communications (publishedVersion, cc-by-nc-nd)
- Research Square (acceptedVersion, cc-by)
- Europe PMC (PubMed Central) (publishedVersion, cc-by-nc-nd)
- PubMed (publishedVersion)
- PubMed Central (publishedVersion, cc-by-nc-nd)
- DOAJ (DOAJ: Directory of Open Access Journals) (submittedVersion, cc-by-sa)
- Funders
- Ministry of Science and Technology of the People's Republic of China (STI2030-Major Projects 2022ZD0212600)
- National Natural Science Foundation of China (32171216)
- China Postdoctoral Science Foundation (2023M730689)
- Fudan University (23216)
- Topics
- Physical Sciences › Environmental Science › Health, Toxicology and Mutagenesis › Heavy Metal Exposure and Toxicity
- Health Sciences › Nursing › Nutrition and Dietetics › Trace Elements in Health
- Health Sciences › Medicine › Hematology › Iron Metabolism and Disorders
- Keywords
- SLC30A10, manganese transport, manganese homeostasis, manganese efflux, manganese binding site, manganese accumulation, mitochondrial dysfunction, therapeutic target
- MeSH terms
- Zinc Transporter 8, Binding Sites, Biological Transport, Humans, Manganese, Models, Molecular, Mutation, Protein Binding, Ion Transport, Cryoelectron Microscopy, Cation Transport Proteins, HEK293 Cells
About these checks
Registry, retraction, Cites and statistics results are computed, not judged, with one exception: a printed reference that no index lists is read once by a model before it counts as a citation error. Claims are extracted by a model and kept only when their quote appears verbatim in the text; each cited source is then checked, with a model’s help, for whether it says what the claim relies on. Those verdicts can be wrong — read the claim’s quote and the cited source before relying on one.
Statistics and arithmetic are recomputed, not judged.
Confidence bands are shown only for fields calibrated on our annotated test set. None is calibrated yet, so no band is shown.
What counts as a claim ›How we measure confidence ›How we check this ›
Are you an author, or do you see a problem with this page? Request a review
Data sources
Bibliographic data: Semantic Scholar, OpenAlex, Crossref.
Contains information from the Semantic Scholar Academic Graph Datasets, made available under the ODC Attribution License (ODC-BY 1.0).
Semantic Scholar’s data is described in: Kinney, R., et al. (2023). The Semantic Scholar Open Data Platform. arXiv:2301.10140.
