

The DOI matches its Crossref record; 48 of the 48 references it cites were found in a registry or an index.
3D-MINFLUX nanoscopy reveals distinct allosteric mechanisms for activation and modulation of PIEZO1 by Yoda1
Open accessPublished version of a preprint
Abstract
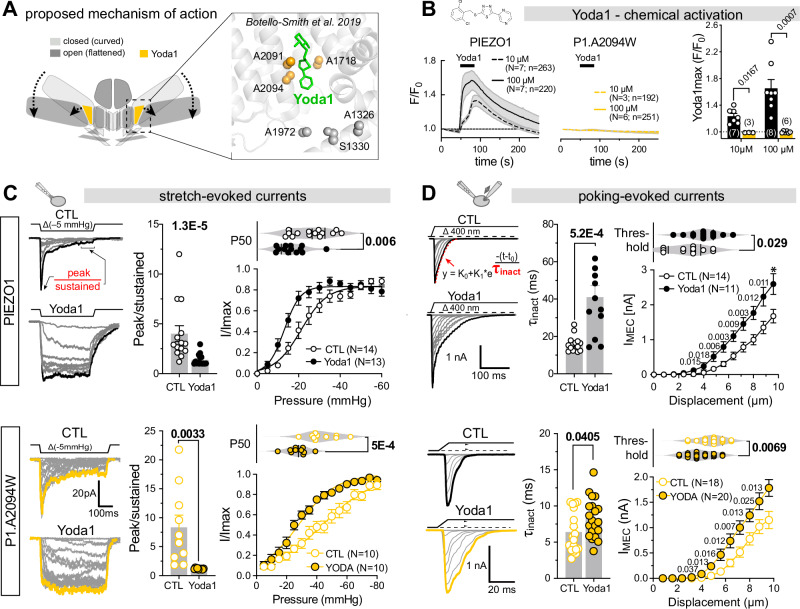
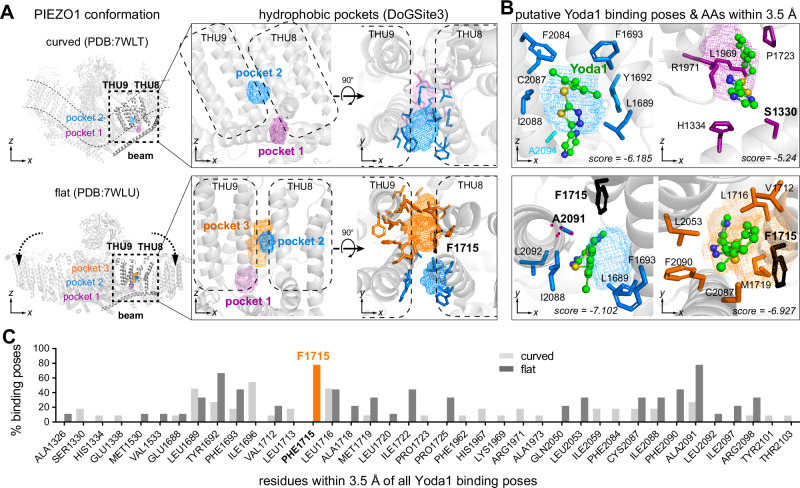
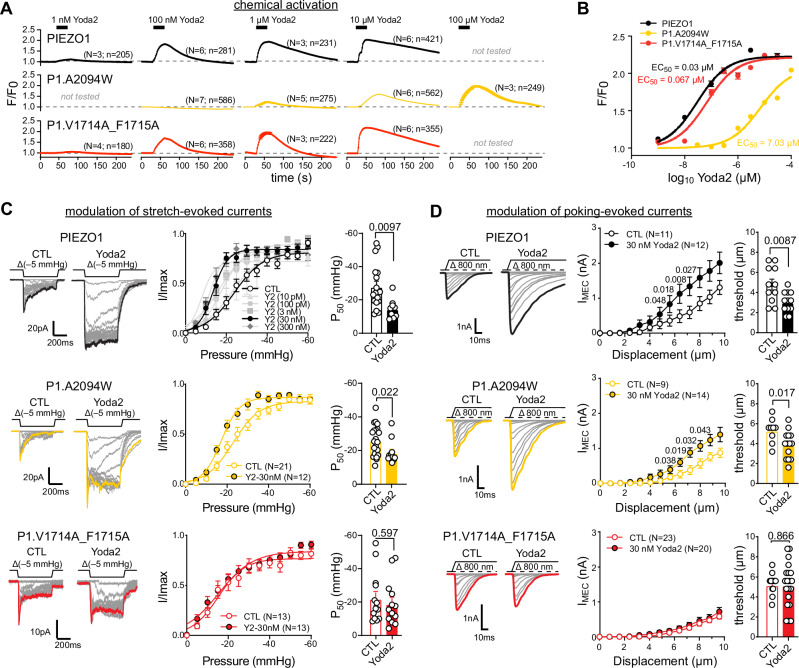
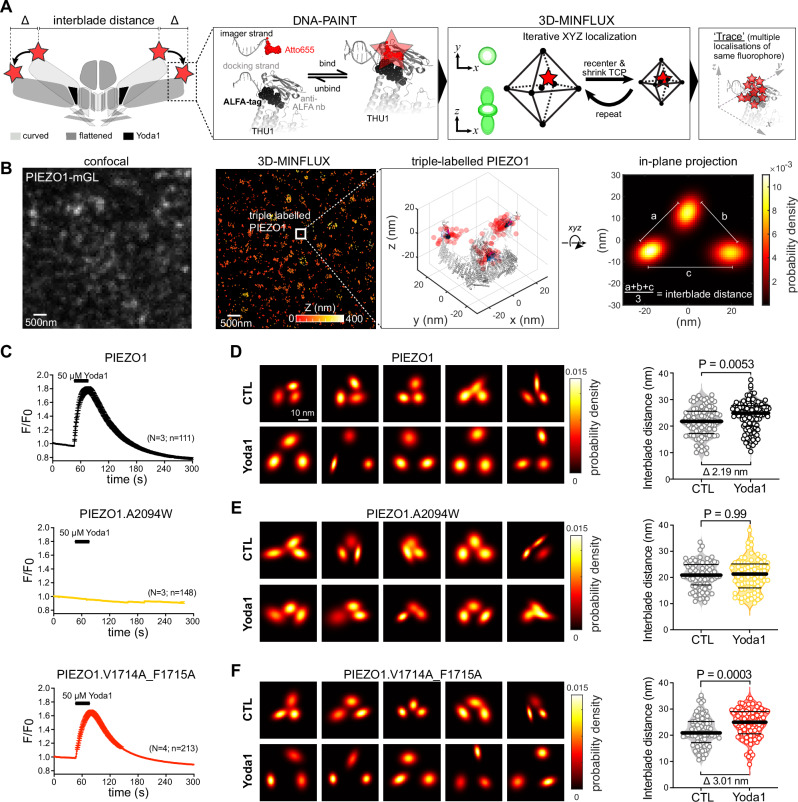
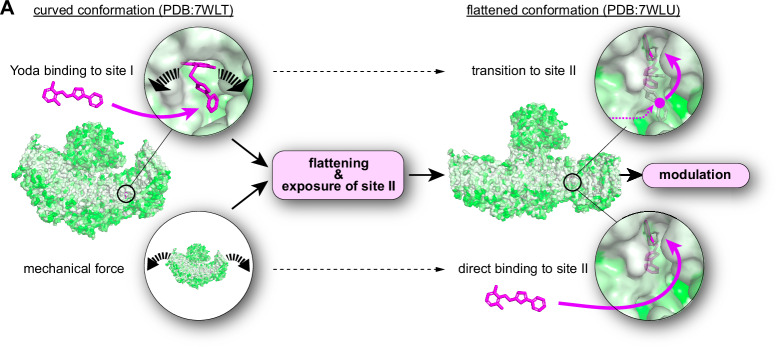
The small molecule Yoda1 has become an indispensable tool for dissecting the role of the mechanically activated ion channel PIEZO1 in physiological and pathological contexts. Previous studies proposed that Yoda1 first binds to a hydrophobic pocket at the interface of the transmembrane helical units 8 and 9 close to the inner leaflet of the membrane to induce conformational flattening and thus channel activation and then transitions to a deeper located binding site with higher affinity in the open conformation. Here, using site-directed mutagenesis, electrophysiology, computational modelling and 3D-MINFLUX nanoscopy, we refine this model by demonstrating that mutation of the previously proposed Yoda1 binding site-I, solely abolishes Yoda1-induced activation and channel flattening but preserves modulation of mechanically-evoked PIEZO1 currents, whereas mutation of F1715, which lines a transient binding cavity accessible only in the flattened PIEZO1 conformation, eliminated modulation without affecting Yoda-induced calcium entry. Thus, our data support a revised model for Yoda’s mode of action that distinguishes discrete allosteric pathways for PIEZO1 activation versus modulation and provides a framework for the design of next-generation use-dependent PIEZO1 modulators.
Overview
The claims and statistics of this paper haven’t been checked yet.
Run the check — free, no account needed. It reads the open-access text and checks the sources it cites.
Integrity signals
Registry
Cites
Statistics
Figures
Verification
Claims the paper makes
The claims and statistics of this paper haven’t been checked yet.
Run the check — free, no account needed. It reads the open-access text and checks the sources it cites.
Self-check
Percentages, sums and reported differences re-computed from the paper’s own numbers.
The self-check needs the paper’s full text.
Citations
Cites
Highly accurate protein structure prediction with AlphaFold
Jumper, J., Evans, R., Pritzel, A., Green, T., Figurnov, M., Ronneberger, O., Tunyasuvunakool, K., Bates, R., Žídek, A., Potapenko, A., et al. (2021) · Nature · doi:10.1038/s41586-021-03819-2 · Cited by 43,764
AutoDock Vina 1.2.0: New Docking Methods, Expanded Force Field, and Python Bindings
Eberhardt, J., Santos‐Martins, D., Tillack, A. F., & Forli, S. (2021) · Journal of Chemical Information and Modeling · doi:10.1021/acs.jcim.1c00203 · Cited by 8,292
Piezo1 and Piezo2 Are Essential Components of Distinct Mechanically Activated Cation Channels
Coste, B., Mathur, J., Schmidt, M., Earley, T. J., Ranade, S., Petrus, M. J., Dubin, A. E., & Patapoutian, A. (2010) · Science · doi:10.1126/science.1193270 · Cited by 3,316
Nanometer resolution imaging and tracking of fluorescent molecules with minimal photon fluxes
Balzarotti, F., Eilers, Y., Gwosch, K. C., Gynnå, A. H., Westphal, V., Stefani, F. D., Elf, J., & Hell, S. W. (2017) · Science · doi:10.1126/science.aak9913 · Cited by 1,225
Piezo1 integration of vascular architecture with physiological force
Li, J., Hou, B., Tumova, S., Muraki, K., Bruns, A., Ludlow, M. J., Sedo, A., Hyman, A. J., McKeown, L., Young, R. S., et al. (2014) · Nature · doi:10.1038/nature13701 · Cited by 1,223
Chemical activation of the mechanotransduction channel Piezo1
Syeda, R., Xu, J., Dubin, A. E., Coste, B., Mathur, J., Huynh, T. T., Matzen, J., Lao, J., Tully, D. C., Engels, I. H., et al. (2015) · eLife · doi:10.7554/elife.07369 · Cited by 747
Structure of the mechanically activated ion channel Piezo1
Saotome, K., Murthy, S. E., Kefauver, J. M., Whitwam, T., Patapoutian, A., & Ward, A. B. (2018) · Nature · doi:10.1038/nature25453 · Cited by 649
The ALFA-tag is a highly versatile tool for nanobody-based bioscience applications
Götzke, H., Kilisch, M., Martínez‐Carranza, M., Sograte‐Idrissi, S., Rajavel, A., Schlichthaerle, T., Engels, N., Jungmann, R., Stenmark, P., Opazo, F., et al. (2019) · Nature Communications · doi:10.1038/s41467-019-12301-7 · Cited by 636
Structure and mechanogating mechanism of the Piezo1 channel
Zhao, Q., Zhou, H., Chi, S., Wang, Y., Wang, J., Geng, J., Wu, K., Liu, W., Zhang, T., Dong, M.-Q., et al. (2018) · Nature · doi:10.1038/nature25743 · Cited by 628
Discoveries in structure and physiology of mechanically activated ion channels
Kefauver, J. M., Ward, A. B., & Patapoutian, A. (2020) · Nature · doi:10.1038/s41586-020-2933-1 · Cited by 625
MINFLUX nanoscopy delivers 3D multicolor nanometer resolution in cells
Gwosch, K. C., Pape, J. K., Balzarotti, F., Hoess, P., Ellenberg, J., Ries, J., & Hell, S. W. (2020) · Nature Methods · doi:10.1038/s41592-019-0688-0 · Cited by 585
Bugnon, M., Röhrig, U. F., Goullieux, M., Perez, M. A. S., Daina, A., Michielin, O., & Zoete, V. (2024) · Nucleic Acids Research · doi:10.1093/nar/gkae300 · Cited by 572
Touch, Tension, and Transduction – The Function and Regulation of Piezo Ion Channels
Wu, J., Lewis, A. H., & Grandl, J. (2017) · Trends in Biochemical Sciences · doi:10.1016/j.tibs.2016.09.004 · Cited by 570
PIEZOs mediate neuronal sensing of blood pressure and the baroreceptor reflex
Zeng, W.-Z., Marshall, K. L., Min, S., Daou, I., Chapleau, M. W., Abboud, F. M., Liberles, S. D., & Patapoutian, A. (2018) · Science · doi:10.1126/science.aau6324 · Cited by 493
Structure-based membrane dome mechanism for Piezo mechanosensitivity
Guo, Y. R., & MacKinnon, R. (2017) · eLife · doi:10.7554/elife.33660 · Cited by 446
Mechanical sensitivity of Piezo1 ion channels can be tuned by cellular membrane tension
Lewis, A. H., & Grandl, J. M. (2015) · eLife · doi:10.7554/elife.12088 · Cited by 440
Force-induced conformational changes in PIEZO1
Lin, Y.-C., Guo, Y. R., Miyagi, A., Levring, J., MacKinnon, R., & Scheuring, S. (2019) · Nature · doi:10.1038/s41586-019-1499-2 · Cited by 433
Albuisson, J., Murthy, S. E., Bandell, M., Coste, B., Louis-dit-Picard, H., Mathur, J., Fénéant-Thibault, M., Tertian, G., de Jaureguiberry, J.-P., Syfuss, P.-Y., et al. (2013) · Nature Communications · doi:10.1038/ncomms2899 · Cited by 377
Structure deformation and curvature sensing of PIEZO1 in lipid membranes
Yang, X., Lin, C., Chen, X., Li, S., Li, X., & Xiao, B. (2022) · Nature · doi:10.1038/s41586-022-04574-8 · Cited by 305
A mechanism for the activation of the mechanosensitive Piezo1 channel by the small molecule Yoda1
Botello‐Smith, W. M., Jiang, W., Zhang, H., Özkan, A. D., Lin, Y., Pham, C. N., Lacroix, J. J., & Luo, Y. (2019) · Nature Communications · doi:10.1038/s41467-019-12501-1 · Cited by 298
Wang, Y., Chi, S., Guo, H., Li, G., Wang, L., Zhao, Q., Rao, Y., Zu, L., He, W., & Xiao, B. (2018) · Nature Communications · doi:10.1038/s41467-018-03570-9 · Cited by 291
Mechanisms of mechanotransduction and physiological roles of PIEZO channels
Xiao, B. (2024) · Nature Reviews Molecular Cell Biology · doi:10.1038/s41580-024-00773-5 · Cited by 287
Mechanically activated ion channel PIEZO1 is required for lymphatic valve formation
Nonomura, K., Lukacs, V., Sweet, D. T., Goddard, L. M., Kanie, A., Whitwam, T., Ranade, S. S., Fujimori, T., Kahn, M. L., & Patapoutian, A. (2018) · Proceedings of the National Academy of Sciences · doi:10.1073/pnas.1817070115 · Cited by 267
Voltage gating of mechanosensitive PIEZO channels
Moroni, M., Servin-Vences, M. R., Fleischer, R., Sánchez-Carranza, O., & Lewin, G. R. (2018) · Nature Communications · doi:10.1038/s41467-018-03502-7 · Cited by 200
Piezo1 mechanosensitive channels: what are they and why are they important
Ridone, P., Vassalli, M., & Martinac, B. (2019) · Biophysical Reviews · doi:10.1007/s12551-019-00584-5 · Cited by 184
Direct observation of the conformational states of PIEZO1
Mulhall, E. M., Gharpure, A., Lee, R., Dubin, A. E., Aaron, J., Marshall, K. L., Spencer, K. R., Reiche, M. A., Henderson, S. C., Chew, T., et al. (2023) · Nature · doi:10.1038/s41586-023-06427-4 · Cited by 176
The Form and Function of PIEZO2
Szczot, M., Nickolls, A. R., Lam, R. M., & Chesler, A. T. (2021) · Annual Review of Biochemistry · doi:10.1146/annurev-biochem-081720-023244 · Cited by 174
Spatiotemporal dynamics of PIEZO1 localization controls keratinocyte migration during wound healing
Holt, J. R., Zeng, W.-Z., Evans, E. L., Woo, S., Ma, S., Abuwarda, H., Loud, M. C., Patapoutian, A., & Pathak, M. M. (2021) · eLife · doi:10.7554/elife.65415 · Cited by 169
Probing the gating mechanism of the mechanosensitive channel Piezo1 with the small molecule Yoda1
Lacroix, J. J., Botello‐Smith, W. M., & Luo, Y. (2018) · Nature Communications · doi:10.1038/s41467-018-04405-3 · Cited by 164
Graef, J., Ehrt, C., & Rarey, M. (2023) · Journal of Chemical Information and Modeling · doi:10.1021/acs.jcim.3c00336 · Cited by 127
Ostersehlt, L. M., Jans, D. C., Wittek, A., Keller‐Findeisen, J., Inamdar, K., Sahl, S. J., Hell, S. W., & Jakobs, S. (2022) · Nature Methods · doi:10.1038/s41592-022-01577-1 · Cited by 116
A Plug-and-Latch Mechanism for Gating the Mechanosensitive Piezo Channel
Geng, J., Liu, W., Zhou, H., Zhang, T., Wang, L., Zhang, M., Li, Y., Shen, B., Li, X., & Xiao, B. (2020) · Neuron · doi:10.1016/j.neuron.2020.02.010 · Cited by 113
Verkest, C., Schaefer, I., Nees, T. A., Wang, N., Jegelka, J. M., Taberner, F. J., & Lechner, S. G. (2022) · Nature Communications · doi:10.1038/s41467-022-28974-6 · Cited by 82
Self-citationImproved PIEZO1 agonism through 4‐benzoic acid modification of Yoda1
Parsonage, G., Cuthbertson, K., Endesh, N., Murciano, N., Hyman, A. J., Revill, C., Povstyan, O. V., Chuntharpursat‐Bon, E., Debant, M., Ludlow, M. J., et al. (2022) · British Journal of Pharmacology · doi:10.1111/bph.15996 · Cited by 70
Structure-guided examination of the mechanogating mechanism of PIEZO2
Taberner, F. J., Prato, V., Schaefer, I., Schrenk-Siemens, K., Heppenstall, P. A., & Lechner, S. G. (2019) · Proceedings of the National Academy of Sciences · doi:10.1073/pnas.1905985116 · Cited by 69
Self-citationPharmacology of PIEZO1 channels
Kinsella, J. A., Debant, M., Parsonage, G., Morley, L. C., Bajarwan, M., Revill, C., Foster, R., & Beech, D. J. (2024) · British Journal of Pharmacology · doi:10.1111/bph.17351 · Cited by 60
Quantitative prediction and measurement of Piezo's membrane footprint
Haselwandter, C. A., Guo, Y. R., Fu, Z., & MacKinnon, R. (2022) · Proceedings of the National Academy of Sciences · doi:10.1073/pnas.2208027119 · Cited by 52
Liu, S., Yang, X., Chen, X., Zhang, X., Jiang, J., Yuan, J., Liu, W., Wang, L., Zhou, H., Wu, K. K., et al. (2024) · Neuron · doi:10.1016/j.neuron.2024.11.020 · Cited by 52
Structural and thermodynamic framework for PIEZO1 modulation by small molecules
Jiang, W., Wijerathne, T. D., Zhang, H., Lin, Y.-C., Jo, S., Im, W., Lacroix, J. J., & Luo, Y. L. (2023) · Proceedings of the National Academy of Sciences · doi:10.1073/pnas.2310933120 · Cited by 44
Goon, S., Liu, C. S. C., Dastidar, U. G., Paul, B., Mukherjee, S., Sarkar, H. S., Desai, M., Jana, R., Pal, S., Sreedevi, N. V., et al. (2024) · Journal of Medicinal Chemistry · doi:10.1021/acs.jmedchem.4c00322 · Cited by 31
Verkest, C., Roettger, L., Zeitzschel, N., Hall, J., Sánchez-Carranza, O., Huang, A. T.-L., Lewin, G. R., & Lechner, S. G. (2025) · Science Advances · doi:10.1126/sciadv.ady8052 · Cited by 24
Self-citationStretch and poke stimulation for characterizing mechanically activated ion channels
Lewis, A. H., & Grandl, J. M. (2021) · Methods in enzymology on CD-ROM/Methods in enzymology · doi:10.1016/bs.mie.2020.12.024 · Cited by 22
Zeitzschel, N., & Lechner, S. G. (2024) · Channels · doi:10.1080/19336950.2024.2355123 · Cited by 20
Self-citationForce-induced motions of the PIEZO1 blade probed with fluorimetry
Özkan, A. D., Wijerathne, T. D., Gettas, T., & Lacroix, J. J. (2023) · Cell Reports · doi:10.1016/j.celrep.2023.112837 · Cited by 19
Verkest, C., & Lechner, S. G. (2022) · Current Opinion in Physiology · doi:10.1016/j.cophys.2022.100625 · Cited by 17
Self-citationMazal, H., Wieser, F.-F., Bollschweiler, D., Schambony, A., & Sandoghdar, V. (2025) · Science Advances · doi:10.1126/sciadv.adw4402 · Cited by 17
PKA mediates modality-specific modulation of the mechanically gated ion channel PIEZO2
Schaefer, I., Verkest, C., Roettger, L., Mair, T., Voß, H., Zeitzschel, N., & Lechner, S. G. (2023) · Journal of Biological Chemistry · doi:10.1016/j.jbc.2023.104782 · Cited by 16
Self-citationStefanLechnerUKE/PIEZO1_Yoda1_MINFLUX: PIEZO1_Yoda1_MINFLUX_NatCOmmun
StefanLechnerUKE (2025) · Zenodo (CERN European Organization for Nuclear Research) · doi:10.5281/zenodo.17700347 · Cited by 1
Research works printed but not linked: 1
- Smith, K. A. et al. Regulation of PIEZO1 channel force sensitivity by interblade handshaking. Sci. Adv. 11, eadt7046 (2025). · DOI
Metadata
- Authors
- Verkest, C., Roettger, L., Zeitzschel, N., & Lechner, S. G.
- Affiliations
- University Medical Center Hamburg-Eppendorf (DE)
- Corresponding author
- Lechner, Stefan G.
- Venue
- Nature Communications
- Published
- 2025-12-17
- Volume
- 16
- Issue
- 1
- Pages
- 11192-11192
- ISSN
- 2041-1723 (ISSN-L)
- PMC
- PMC12712055
- OpenAlex
- W4417412685
- Cited by
- 12
- References
- 48
- Citations by year
- 2026: 11 · 2025: 1
- FWCI
- 7.62
- Type
- journal article
- Language
- en
- Open access
- gold
- doi.org
- Licence
- cc-by
- creativecommons.org/licenses/by/4.0 (tdm)
- creativecommons.org/licenses/by/4.0 (vor)
- Locations
- Nature Communications (publishedVersion, cc-by)
- bioRxiv (Cold Spring Harbor Laboratory) (acceptedVersion, cc-by-nc-nd)
- PubMed (publishedVersion)
- PubMed Central (publishedVersion, cc-by)
- DOAJ (DOAJ: Directory of Open Access Journals) (submittedVersion, cc-by-sa)
- Funders
- Deutsche Forschungsgemeinschaft (LE3210/3-3)
- Topics
- Life Sciences › Neuroscience › Sensory Systems › Ion Channels and Receptors
- Life Sciences › Biochemistry, Genetics and Molecular Biology › Molecular Biology › Ion channel regulation and function
- Health Sciences › Medicine › Physiology (medical) › Erythrocyte Function and Pathophysiology
- Keywords
- Piezo1, Yoda1, allosteric modulation, mechanosensitive ion channels, channel activation, binding site I, calcium influx, channel conformation
- MeSH terms
- Allosteric Regulation, Allosteric Site, Animals, Binding Sites, Calcium, Cell Line, Humans, Ion Channels, Models, Molecular, Mutation, Protein Conformation, Pyrazines, Thiadiazoles, Ion Channel Gating, Mutagenesis, Site-Directed, Mice, HEK293 Cells
About these checks
Registry, retraction, Cites and statistics results are computed, not judged, with one exception: a printed reference that no index lists is read once by a model before it counts as a citation error. Claims are extracted by a model and kept only when their quote appears verbatim in the text; each cited source is then checked, with a model’s help, for whether it says what the claim relies on. Those verdicts can be wrong — read the claim’s quote and the cited source before relying on one.
Statistics and arithmetic are recomputed, not judged.
Confidence bands are shown only for fields calibrated on our annotated test set. None is calibrated yet, so no band is shown.
What counts as a claim ›How we measure confidence ›How we check this ›
Are you an author, or do you see a problem with this page? Request a review
Data sources
Bibliographic data: Semantic Scholar, OpenAlex, Crossref.
Contains information from the Semantic Scholar Academic Graph Datasets, made available under the ODC Attribution License (ODC-BY 1.0).
Semantic Scholar’s data is described in: Kinney, R., et al. (2023). The Semantic Scholar Open Data Platform. arXiv:2301.10140.
