

The DOI matches its Crossref record; 52 of the 52 references it cites were found in a registry or an index.
An in vitro approach for simulating divergent Golgi O-glycosylation of tumor-associated MUC1 from normal MUC1
Open accessPublished version of a preprint
Abstract
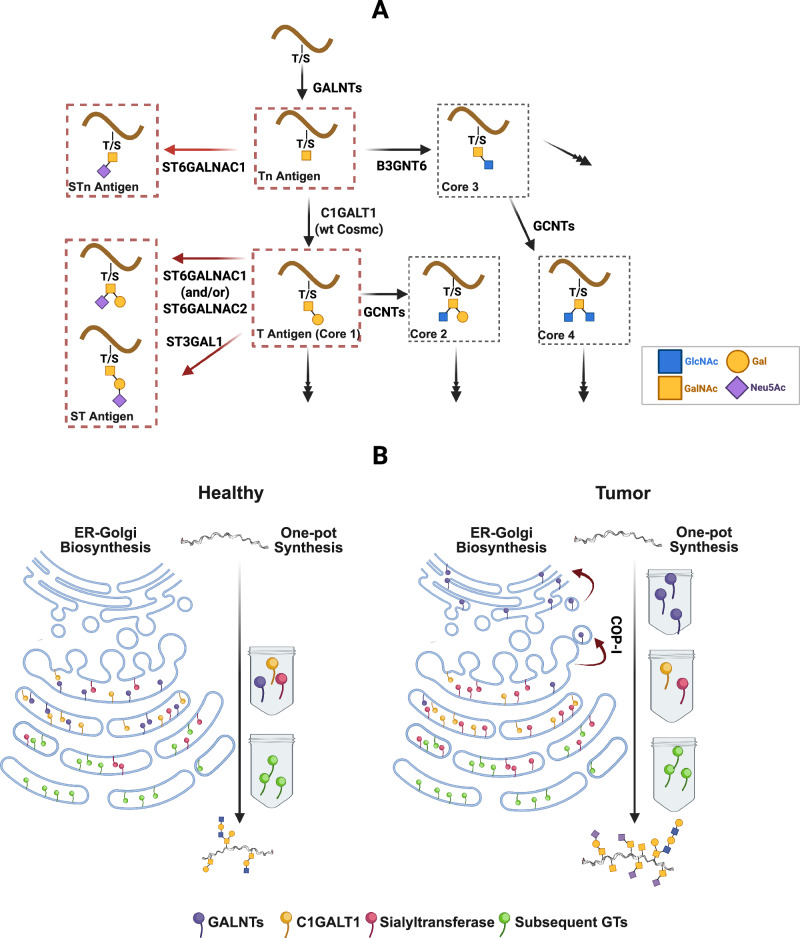
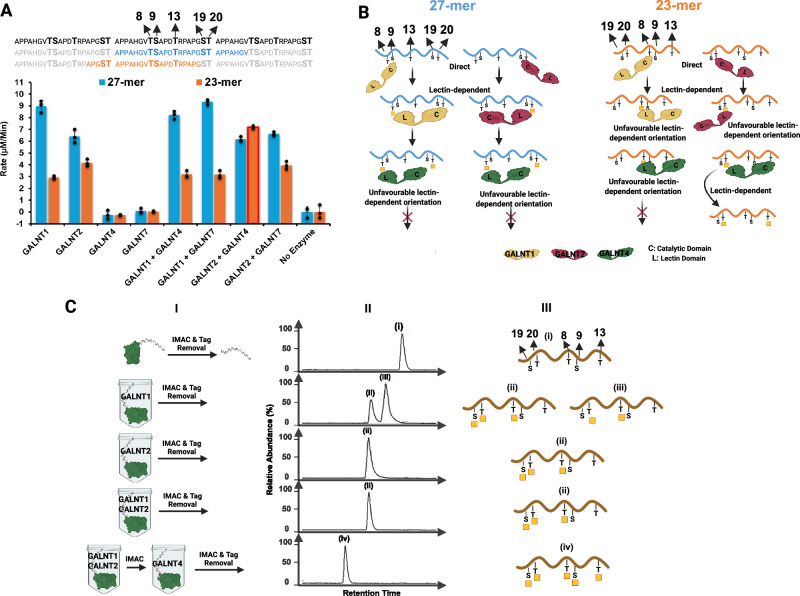
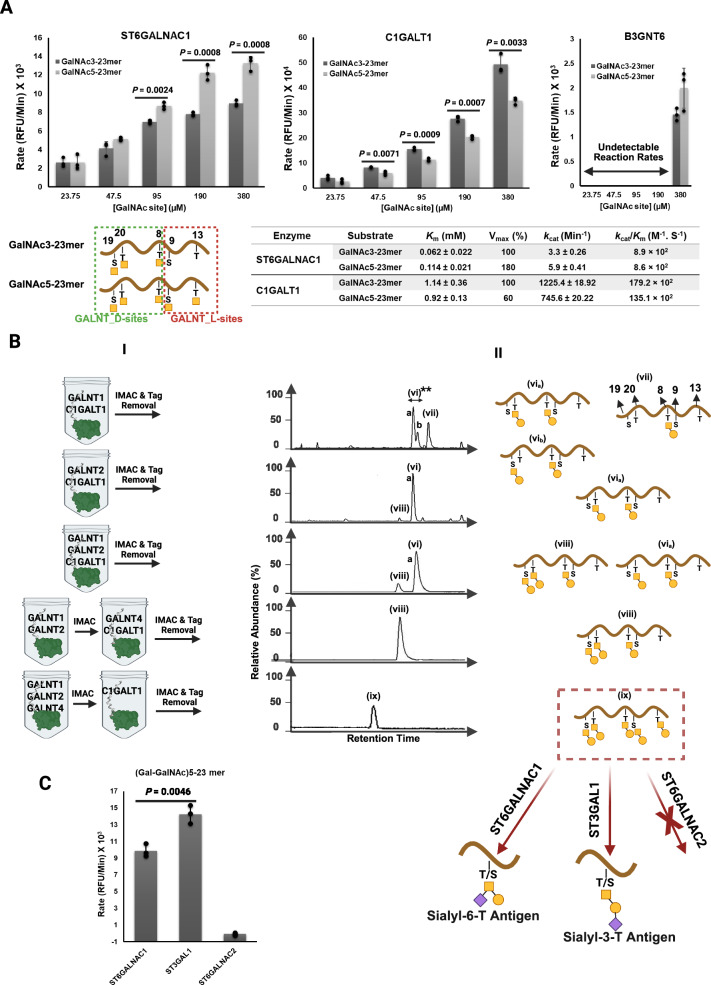
Abstract Peptide O-glycosylation relies on the coordinated action of glycosyltransferases (GTs) within the endoplasmic reticulum (ER) and Golgi apparatus. An in vitro one-pot synthetic biology approach was developed to investigate the specificity and kinetics of GT O-GalNAc glycosylation that leads to tumor antigen glycoforms of mucin 1 (MUC1). The focus is to experimentally simulate the divergent glycosylation pathways that lead to the synthesis of cancer-associated antigens (Tn, T) and their sialylated derivatives. First, the biosynthetic details of the defining first step of GALNT relocation from the ER to the Golgi was modeled using the one-pot method. Our findings reveal that an ER enriched with GALNTs results in complete Galnac (Tn) MUC1 site occupancy. This comes about as a function of two processes that are i) extended GALNT reaction time and ii) prevention of inhibition by subsequent glycosylation enzymes such as C1GALT1. The modeling confirms that B3GNT6 has negligible specificity for MUC1 Tn, explaining the absence of core 3 and core 4 structures in MUC1 in both normal and cancerous breast cell lines. Moreover, ST6GALNAC1, and not ST6GALNAC2, is primarily responsible for α-2-6 sialylation of Tn and T antigens. Computer reaction dynamic simulations combined with kinetic experimental analysis show that ST6GALNAC1 prefers fully glycosylated MUC1 and more importantly that its preference is to sialyate the S9 and T13 sites in the SAPDTR motif. This is especially the case when the MUC1 concentration is high (i.e., high-level of expression), suggesting that sTn upregulation on MUC1 in cancer is linked to the occupancy status of S9 and T13 glycosylated sites, that were previously found to be cancer-associated. The results from the one-pot synthesis approach presented here demonstrate its ability to simulate cellular glycosylation within the Golgi-ER. This systems modelling unpacks the molecular details of enzyme localization and substrate glycan occupancy that is fundamental to the regulatory mechanisms that gives rise to tumor-associated MUC1 antigens.
Overview
The claims and statistics of this paper haven’t been checked yet.
Run the check — free, no account needed. It reads the open-access text and checks the sources it cites.
Integrity signals
Registry
Cites
Statistics
Figures
Verification
Claims the paper makes
The claims and statistics of this paper haven’t been checked yet.
Run the check — free, no account needed. It reads the open-access text and checks the sources it cites.
Self-check
Percentages, sums and reported differences re-computed from the paper’s own numbers.
The self-check needs the paper’s full text.
Citations
Cites
Highly accurate protein structure prediction with AlphaFold
Jumper, J., Evans, R., Pritzel, A., Green, T., Figurnov, M., Ronneberger, O., Tunyasuvunakool, K., Bates, R., Žídek, A., Potapenko, A., et al. (2021) · Nature · doi:10.1038/s41586-021-03819-2 · Cited by 43,764 · cited 2×
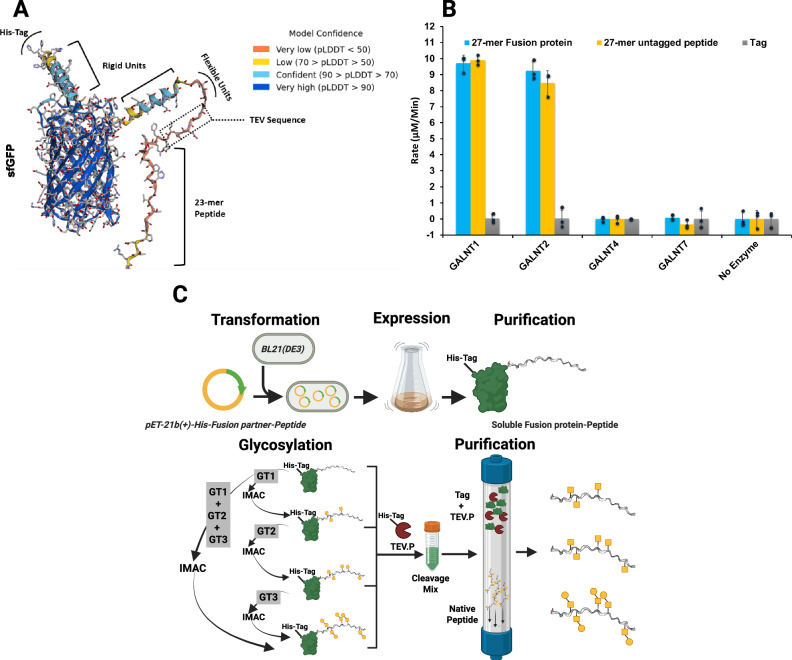
“0) 16,17 The model revealed conformational and structural variability around the TEV protease cleavage region con fi rming the design intention to induce fl exibility and as a result accessibility for the protease.”
Scalable molecular dynamics with NAMD
Phillips, J. C., Braun, R., Wang, W., Gumbart, J., Tajkhorshid, E., Villa, E., Chipot, C., Skeel, R. D., Kalé, L., & Schulten, K. (2005) · Journal of Computational Chemistry · doi:10.1002/jcc.20289 · Cited by 16,914
SWISS-MODEL: homology modelling of protein structures and complexes
Waterhouse, A., Bertoni, M., Bienert, S., Studer, G., Tauriello, G., Gumienny, R., Heer, F. T., de Beer, T. A. P., Rempfer, C., Bordoli, L., et al. (2018) · Nucleic Acids Research · doi:10.1093/nar/gky427 · Cited by 13,067
ColabFold - Making protein folding accessible to all
Mirdita, M., Schütze, K., Moriwaki, Y., Heo, L., Ovchinnikov, S., & Steinegger, M. (2021) · doi:10.1101/2021.08.15.456425 · Cited by 9,391
CHARMM: The biomolecular simulation program
Brooks, B. R., Brooks, C. L., Mackerell, A. D., Nilsson, L., Petrella, R. J., Roux, B., Won, Y., Archontis, G., Bartels, C., Boresch, S., et al. (2009) · Journal of Computational Chemistry · doi:10.1002/jcc.21287 · Cited by 8,939
CHARMM36m: an improved force field for folded and intrinsically disordered proteins
Huang, J., Rauscher, S., Nawrocki, G., Ran, T., Feig, M., de Groot, B. L., Grubmüller, H., & MacKerell, A. D. (2016) · Nature Methods · doi:10.1038/nmeth.4067 · Cited by 7,334
Glycosylation in cancer: mechanisms and clinical implications
Pinho, S. S., & Reis, C. A. (2015) · Nature reviews. Cancer · doi:10.1038/nrc3982 · Cited by 3,217
Engineering and characterization of a superfolder green fluorescent protein
Pédelacq, J.-D., Cabantous, S., Tran, T., Terwilliger, T. C., & Waldo, G. S. (2006) · Nature Biotechnology · doi:10.1038/nbt1172 · Cited by 2,291
A combined quantum mechanical and molecular mechanical potential for molecular dynamics simulations
Field, M., Bash, P., & Karplus, M. (1990) · Journal of Computational Chemistry · doi:10.1002/jcc.540110605 · Cited by 1,972
MUC1: a multifaceted oncoprotein with a key role in cancer progression
Nath, S., & Mukherjee, P. (2014) · Trends in Molecular Medicine · doi:10.1016/j.molmed.2014.02.007 · Cited by 876
Structural Biology in the Clouds: The WeNMR-EOSC Ecosystem
Honorato, R. V., Koukos, P. I., Jiménez-García, B., Tsaregorodtsev, A., Verlato, M., Giachetti, A., Rosato, A., & Bonvin, A. M. J. J. (2021) · Frontiers in Molecular Biosciences · doi:10.3389/fmolb.2021.729513 · Cited by 774
Taylor-Papadimitriou, J., Burchell, J., Miles, D. W., & Dalziel, M. (1999) · Biochimica et Biophysica Acta (BBA) - Molecular Basis of Disease · doi:10.1016/s0925-4439(99)00055-1 · Cited by 465
Mapping the distribution of Golgi enzymes involved in the construction of complex oligosaccharides
Rabouille, C., Hui, N., Hunte, F., Kieckbusch, R., Berger, E. G., Warren, G., & Nilsson, T. (1995) · Journal of Cell Science · doi:10.1242/jcs.108.4.1617 · Cited by 365
Lloyd, K. O., Burchell, J., Kudryashov, V., Yin, B. W. T., & Taylor-Papadimitriou, J. (1996) · Journal of Biological Chemistry · doi:10.1074/jbc.271.52.33325 · Cited by 362
The SCC-DFTB method and its application to biological systems
Elstner, M. (2006) · Theoretical Chemistry Accounts · doi:10.1007/s00214-005-0066-0 · Cited by 349
Wandall, H. H., Hassan, H., Mirgorodskaya, E., Kristensen, A. K., Roepstorff, P., Bennett, E. P., Nielsen, P. A., Hollingsworth, M. A., Burchell, J., Taylor-Papadimitriou, J., et al. (1997) · Journal of Biological Chemistry · doi:10.1074/jbc.272.38.23503 · Cited by 303
Human Tumor Antigens Tn and Sialyl Tn Arise from Mutations in Cosmc
Ju, T., Lanneau, G. S., Gautam, T., Wang, Y., Xia, B., Stowell, S. R., Willard, M. T., Wang, W., Xia, J. Y., Zuna, R. E., et al. (2008) · Cancer Research · doi:10.1158/0008-5472.can-07-2345 · Cited by 293
MUC1: the polymorphic appearance of a human mucin
Hanisch, F.-G., & Muller, S. (2000) · Glycobiology · doi:10.1093/glycob/10.5.439 · Cited by 276
Sewell, R., Bäckström, M., Dalziel, M., Gschmeissner, S., Karlsson, H., Noll, T., Gätgens, J., Clausen, H., Hansson, G. C., Burchell, J., et al. (2005) · Journal of Biological Chemistry · doi:10.1074/jbc.m511826200 · Cited by 258
Marcos, N. T., Pinho, S., Grandela, C., Cruz, A., Samyn-Petit, B., Harduin‐Lepers, A., Almeida, R., Santos‐Silva, F., Morais, V. A., Costa, J., et al. (2004) · Cancer Research · doi:10.1158/0008-5472.can-04-1921 · Cited by 258
Regulation of O -glycosylation through Golgi-to-ER relocation of initiation enzymes
Gill, D. J., Chia, J., Senewiratne, J., & Bard, F. (2010) · The Journal of Cell Biology · doi:10.1083/jcb.201003055 · Cited by 205
Gill, D. J., Tham, K. M., Chia, J., Wang, S. C., Steentoft, C., Clausen, H., Bard-Chapeau, E. A., & Bard, F. (2013) · Proceedings of the National Academy of Sciences · doi:10.1073/pnas.1305269110 · Cited by 196
Hassan, H., Reis, C. A., Bennett, E., Mirgorodskaya, E., Roepstorff, P., Hollingsworth, M. A., Burchell, J., Taylor‐Papadimitriou, J., & Clausen, H. (2000) · Journal of Biological Chemistry · doi:10.1074/jbc.m005783200 · Cited by 164
The Distinct Roles of Sialyltransferases in Cancer Biology and Onco-Immunology
Hugonnet, M., Singh, P., Haas, Q., & von Gunten, S. (2021) · Frontiers in Immunology · doi:10.3389/fimmu.2021.799861 · Cited by 131
SRC kinase-mediated signaling pathways and targeted therapies in breast cancer
Luo, J., Zou, H., Guo, Y., Tong, T., Ye, L., Zhu, C., Deng, L., Wang, B., Pan, Y., & Li, P. (2022) · Breast Cancer Research · doi:10.1186/s13058-022-01596-y · Cited by 129
Polypeptide GalNAc-Ts: from redundancy to specificity
Rivas, M. D. L., Lira‐Navarrete, E., Gerken, T. A., & Hurtado‐Guerrero, R. (2019) · Current Opinion in Structural Biology · doi:10.1016/j.sbi.2018.12.007 · Cited by 116
Wandall, H. H., Irazoqui, F. J., Tarp, M. A., Bennett, E., Mandel, U., Takeuchi, H., Kato, K., Irimura, T., Suryanarayanan, G., Hollingsworth, M. A., et al. (2007) · Glycobiology · doi:10.1093/glycob/cwl082 · Cited by 112
Defining the SN1 Side of Glycosylation Reactions: Stereoselectivity of Glycopyranosyl Cations
Hansen, T., Lebedel, L., Remmerswaal, W. A., van der Vorm, S., Wander, D. P. A., Somers, M. F., Overkleeft, H. S., Filippov, D. V., Désiré, J., Martin‐Mingot, A., et al. (2019) · ACS Central Science · doi:10.1021/acscentsci.9b00042 · Cited by 109
Pratt, M. R., Hang, H. C., Ten Hagen, K. G., Rarick, J., Gerken, T. A., Tabak, L. A., & Bertozzi, C. R. (2004) · Chemistry & Biology · doi:10.1016/j.chembiol.2004.05.009 · Cited by 98
Barnett, C. B., & Naidoo, K. J. (2010) · The Journal of Physical Chemistry B · doi:10.1021/jp107620h · Cited by 90
Self-citationGlycosyltransferase Gene Expression Profiles Classify Cancer Types and Propose Prognostic Subtypes
Ashkani, J., & Naidoo, K. J. (2016) · Scientific Reports · doi:10.1038/srep26451 · Cited by 90
Self-citationAdaptation of the Golgi Apparatus in Cancer Cell Invasion and Metastasis
Bui, S., Mejia, I., Díaz, B., & Wang, Y. (2021) · Frontiers in Cell and Developmental Biology · doi:10.3389/fcell.2021.806482 · Cited by 86
Revoredo, L., Wang, S., Bennett, E., Clausen, H., Moremen, K. W., Jarvis, D. L., Hagen, K. G. T., Tabak, L. A., & Gerken, T. A. (2015) · Glycobiology · doi:10.1093/glycob/cwv108 · Cited by 81
A Kinetic View of Membrane Traffic Pathways Can Transcend the Classical View of Golgi Compartments
Pantazopoulou, A., & Glick, B. S. (2019) · Frontiers in Cell and Developmental Biology · doi:10.3389/fcell.2019.00153 · Cited by 75
Vainauskas, S., Guntz, H., McLeod, E., McClung, C. M., Ruse, C. I., Shi, X., & Taron, C. H. (2021) · Analytical Chemistry · doi:10.1021/acs.analchem.1c04055 · Cited by 70
The Systems Biology of Glycosylation
Murrell, M. P., Yarema, K. J., & Levchenko, A. (2004) · ChemBioChem · doi:10.1002/cbic.200400143 · Cited by 63
Lectin Domains of Polypeptide GalNAc Transferases Exhibit Glycopeptide Binding Specificity
Pedersen, J. W., Bennett, E., Schjoldager, K. T.-B. G., Meldal, M., Holmér, A. P., Blixt, O., Cló, E., Levery, S. B., Clausen, H., & Wandall, H. H. (2011) · Journal of Biological Chemistry · doi:10.1074/jbc.m111.273722 · Cited by 62
Chemoenzymatic modular assembly of O-GalNAc glycans for functional glycomics
Wang, S., Chen, C., Gadi, M. R., Saikam, V., Liu, D., Zhu, H., Bollag, R. J., Liu, K., Chen, X., Wang, F., et al. (2021) · Nature Communications · doi:10.1038/s41467-021-23428-x · Cited by 61
Redefined Substrate Specificity of ST6GalNAc II: A Second Candidate Sialyl-Tn Synthase
Kono, M., TSUDA, T., Ogata, S., Takashima, S., Liu, H. S., Hamamoto, T., Itzkowitz, S. H., Nishimura, S., & Tsuji, S. (2000) · Biochemical and Biophysical Research Communications · doi:10.1006/bbrc.2000.2745 · Cited by 46
Translation of genome to glycome: role of the Golgi apparatus
Pothukuchi, P., Agliarulo, I., Russo, D., Rizzo, R., Russo, F., & Parashuraman, S. (2019) · FEBS Letters · doi:10.1002/1873-3468.13541 · Cited by 40
Yoshimura, Y., Denda‐Nagai, K., Takahashi, Y., Nagashima, I., Shimizu, H., Kishimoto, T., Noji, M., Shichino, S., Chiba, Y., & Irimura, T. (2019) · Scientific Reports · doi:10.1038/s41598-019-53052-1 · Cited by 36
Coelho, H., Rivas, M. D. L., Grosso, A. S., Diniz, A., Soares, C. O., Francisco, R. A., Dias, J. S., Compañón, I., Sun, L., Narimatsu, Y., et al. (2022) · JACS Au · doi:10.1021/jacsau.1c00529 · Cited by 30
Zeng, J., Mi, R., Wang, Y., Li, Y., Lin, L., Yao, B., Song, L., van Die, I., Chapman, A. B., Cummings, R. D., et al. (2015) · Journal of Biological Chemistry · doi:10.1074/jbc.m115.654244 · Cited by 28
Chemokine binding to PSGL-1 is controlled by O-glycosylation and tyrosine sulfation
Goth, C. K., Mehta, A. Y., McQuillan, A. M., Baker, K. J., Hanes, M. S., Park, S. J., Stavenhagen, K., Hjortø, G. M., Heimburg‐Molinaro, J., Chaikof, E. L., et al. (2023) · Cell chemical biology · doi:10.1016/j.chembiol.2023.06.013 · Cited by 21
Collette, A. M., Hassan, S. A., Schmidt, S. I., Lara, A. J., Yang, W., & Samara, N. L. (2024) · Science Advances · doi:10.1126/sciadv.adj8829 · Cited by 16
Naidoo, K. J. (2011) · Science China Chemistry · doi:10.1007/s11426-011-4423-7 · Cited by 15
Self-citationComparison of α2,6-sialyltransferases for sialylation of therapeutic proteins
Janesch, B., Saxena, H., Sim, L., & Wakarchuk, W. W. (2019) · Glycobiology · doi:10.1093/glycob/cwz050 · Cited by 11
Zhang, H., Song, K., Liu, Y., Yang, F., Lu, C., Wei, R., Xu, Z., Zou, X., Lin, L., Shi, T., et al. (2024) · ACS Catalysis · doi:10.1021/acscatal.4c05719 · Cited by 8
Simple Link Atom Saccharide Hybrid (SLASH) Treatment for Glycosidic Bonds at the QM/MM Boundary
Crous, W., Field, M. J., & Naidoo, K. J. (2014) · Journal of Chemical Theory and Computation · doi:10.1021/ct400903n · Cited by 7
Self-citationNaidoo, K. J., Bruce‐Chwatt, T., Senapathi, T., & Hillebrand, M. (2021) · Accounts of Chemical Research · doi:10.1021/acs.accounts.1c00477 · Cited by 7
Self-citationNashed, A., & Naidoo, K. J. (2024) · ACS Omega · doi:10.1021/acsomega.4c00485 · Cited by 4
Self-citationBruce‐Chwatt, T., & Naidoo, K. J. (2022) · Journal of Computational Chemistry · doi:10.1002/jcc.26982 · Cited by 3
Self-citation
Research works printed but not linked: 1
- Thrane, P. et al. Generalizing Michaelis–Menten theory to account for substrate heterogeneity. Preprint at https://www.biorxiv.org/content/biorxiv/early/2025/08/24/2025.08.21.671619.full.pdf (2025).
Metadata
- Authors
- Nashed, A., Dilsook, K., Senapathi, T., & Naidoo, K. J.
- Affiliations
- University of Cape Town (ZA)
- Corresponding author
- Naidoo, Kevin J.
- Venue
- Nature Communications
- Published
- 2026-04-22
- Volume
- 17
- Issue
- 1
- ISSN
- 2041-1723 (ISSN-L)
- PMC
- PMC13103387
- OpenAlex
- W7155175031
- Cited by
- 0
- References
- 52
- FWCI
- 0.00
- Type
- journal article
- Language
- en
- Open access
- gold
- doi.org
- Licence
- cc-by-nc-nd
- creativecommons.org/licenses/by-nc-nd/4.0 (tdm)
- creativecommons.org/licenses/by-nc-nd/4.0 (vor)
- Locations
- Nature Communications (publishedVersion, cc-by-nc-nd)
- Research Square (acceptedVersion, cc-by)
- PubMed Central (publishedVersion, cc-by-nc-nd)
- PubMed (publishedVersion)
- DOAJ (DOAJ: Directory of Open Access Journals) (submittedVersion, cc-by-sa)
- Funders
- Dane O. Kildsig Center for Pharmaceutical Processing Research
- National Research Foundation (CPPR 466624)
- South African Medical Research Council
- University of Cape Town
- Center for High Performance Computing
- Medical Research Council
- Topics
- Life Sciences › Biochemistry, Genetics and Molecular Biology › Molecular Biology › Glycosylation and Glycoproteins Research
- Physical Sciences › Chemistry › Organic Chemistry › Carbohydrate Chemistry and Synthesis
- Health Sciences › Medicine › Hematology › Blood groups and transfusion
- Keywords
- MUC1, tumor-associated antigens, O-glycosylation, Golgi apparatus, endoplasmic reticulum, ST6GALNAC1, Tn antigen, enzyme localization, synthetic biology
- MeSH terms
- beta-D-Galactoside alpha 2-6-Sialyltransferase, Endoplasmic Reticulum, Glycosylation, Golgi Apparatus, Humans, Kinetics, Neoplasms, Sialyltransferases, Antigens, Tumor-Associated, Carbohydrate, Antigens, CD, N-Acetylgalactosaminyltransferases, Mucin-1
About these checks
Registry, retraction, Cites and statistics results are computed, not judged, with one exception: a printed reference that no index lists is read once by a model before it counts as a citation error. Claims are extracted by a model and kept only when their quote appears verbatim in the text; each cited source is then checked, with a model’s help, for whether it says what the claim relies on. Those verdicts can be wrong — read the claim’s quote and the cited source before relying on one.
Statistics and arithmetic are recomputed, not judged.
Confidence bands are shown only for fields calibrated on our annotated test set. None is calibrated yet, so no band is shown.
What counts as a claim ›How we measure confidence ›How we check this ›
Are you an author, or do you see a problem with this page? Request a review
Data sources
Bibliographic data: Semantic Scholar, OpenAlex, Crossref.
Contains information from the Semantic Scholar Academic Graph Datasets, made available under the ODC Attribution License (ODC-BY 1.0).
Semantic Scholar’s data is described in: Kinney, R., et al. (2023). The Semantic Scholar Open Data Platform. arXiv:2301.10140.
