Student or educator? Sign up with your school email and get 6 months of Pro free.
Cited by 11

The DOI matches its Crossref record; 2 of the 2 references it cites were found in a registry or an index.

Establishment and characterization of immortalized human breast cancer cell lines from breast cancer patient-derived xenografts (PDX)

Zhuang, Yongxian, Grainger, Jordan M., Vedell, Peter T., Yu, Jia, Moyer, Ann M., Gao, Huanyao, Fan, Xiao-Yang, Qin, Sisi, Liu, Duan, Kalari, Krishna R., Goetz, Matthew P., Boughey, Judy C., Weinshilboum, Richard M., Wang, Liewei·2021·npj Breast Cancer

Abstract

The application of patient-derived xenografts (PDX) in drug screening and testing is a costly and time-consuming endeavor. While cell lines permit extensive mechanistic studies, many human breast cancer cell lines lack patient characteristics and clinical treatment information. Establishing cell lines that retain patient’s genetic and drug response information would enable greater drug screening and mechanistic studies. Therefore, we utilized breast cancer PDX from the Mayo Breast Cancer Genome Guided Therapy Study (BEAUTY) to establish two immortalized, genomically unique breast cancer cell lines. Through extensive genetic and therapeutic testing, the cell lines were found to retain the same clinical subtype, major somatic alterations, and drug response phenotypes as their corresponding PDX and patient tumor. Our findings demonstrate PDX can be utilized to develop immortalized breast cancer cell lines and provide a valuable tool for understanding the molecular mechanism of drug resistance and exploring novel treatment strategies.

Overview

The claims and statistics of this paper haven’t been checked yet.

Run the check — free, no account needed. It reads the open-access text and checks the sources it cites.

A few free checks a day · papers already verified open instantly · results are public

Integrity signals

Registry

Crossref · 10.1038/s41523-021-00285-x

Cites

2 of 2 references verified0 citation errors · 0 not checkable

Statistics

Figures

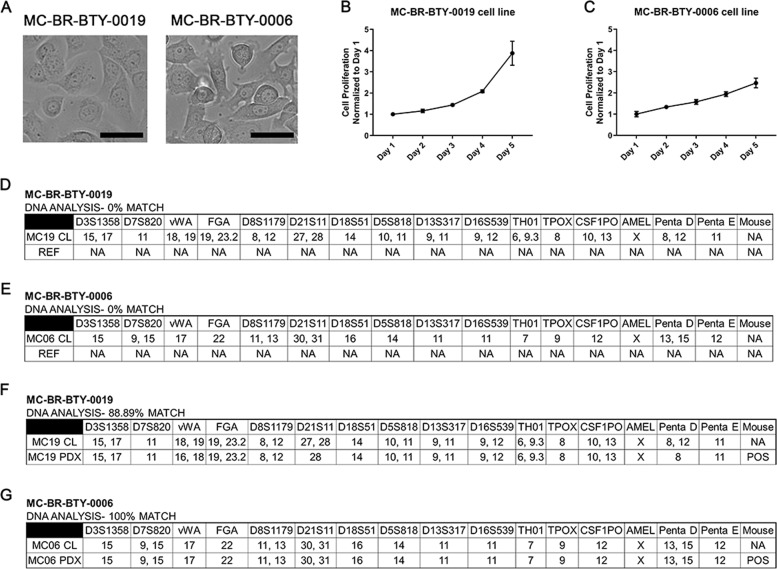
Fig. 1 Established cell lines are unique breast cancer cell lines. A The images of MC-BR-BTY-0019 and MC-BR-BTY-0006 were presented after they were established as immortalized cell lines. Images were taken at ×20; Scale bar represents 20 μm. B, C 30,000 cells and 85,000 cells were plated onto 24-well plates for the proliferation assay for MC-BR-BTY-0019 and MC-BR-BTY-0006, respectively. The proliferation curves are normalized to day 1. Error bars represent SEM. DNA analysis of D MC-BR-BTY-0019 cell line, E MC-BR-BTY-0006 cell line, F MC-BR-BTY-0019 PDX, and G MC-BR-BTY-0006 PDX was demonstrated by STR profiling. REF refers to allele comparisons to all cell lines available in ATCC, DSMZ, JCRB STR profile databases. “NA” designates no similar allele calls compared to the reference.
Fig. 1 Established cell lines are unique breast cancer cell lines. A The images of MC-BR-BTY-0019 and MC-BR-BTY-0006 were presented after they were established as immortalized cell lines. Images were taken at ×20; Scale bar represents 20 μm. B, C 30,000 cells and 85,000 cells were plated onto 24-well plates for the proliferation assay for MC-BR-BTY-0019 and MC-BR-BTY-0006, respectively. The proliferation curves are normalized to day 1. Error bars represent SEM. DNA analysis of D MC-BR-BTY-0019 cell line, E MC-BR-BTY-0006 cell line, F MC-BR-BTY-0019 PDX, and G MC-BR-BTY-0006 PDX was demonstrated by STR profiling. REF refers to allele comparisons to all cell lines available in ATCC, DSMZ, JCRB STR profile databases. “NA” designates no similar allele calls compared to the reference.CC BY · PubMed Central
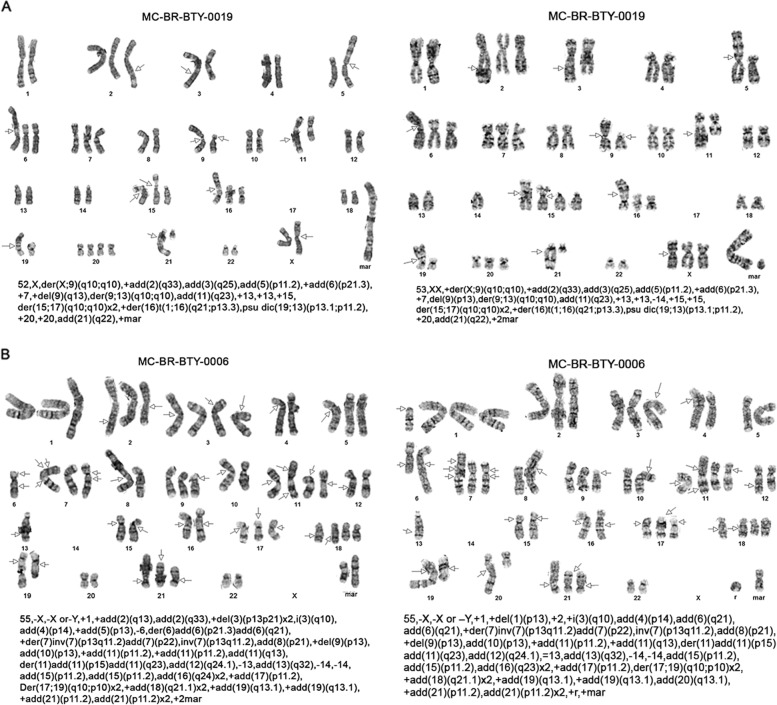
Fig. 2 Two newly established breast cancer cells lines presented massive abnormal karyotypes. A, B Cytogenetics G-band staining of chromosomes is presented and chromosome alteration is described for two cells, MC-BR-BTY-0019 and MC-BR-BTY-0006 cell lines, respectively. Each image is a karyotype of one cell. Text below each karyotype refers to International System for the Human Cytogenetic Nomenclature (ISCN) of the karyotype to address the number of chromosomes observed, the sex chromosome, and the abnormalities observed per chromosome. The arrows indicate breakpoints or abnormalities.
Fig. 2 Two newly established breast cancer cells lines presented massive abnormal karyotypes. A, B Cytogenetics G-band staining of chromosomes is presented and chromosome alteration is described for two cells, MC-BR-BTY-0019 and MC-BR-BTY-0006 cell lines, respectively. Each image is a karyotype of one cell. Text below each karyotype refers to International System for the Human Cytogenetic Nomenclature (ISCN) of the karyotype to address the number of chromosomes observed, the sex chromosome, and the abnormalities observed per chromosome. The arrows indicate breakpoints or abnormalities.CC BY · PubMed Central
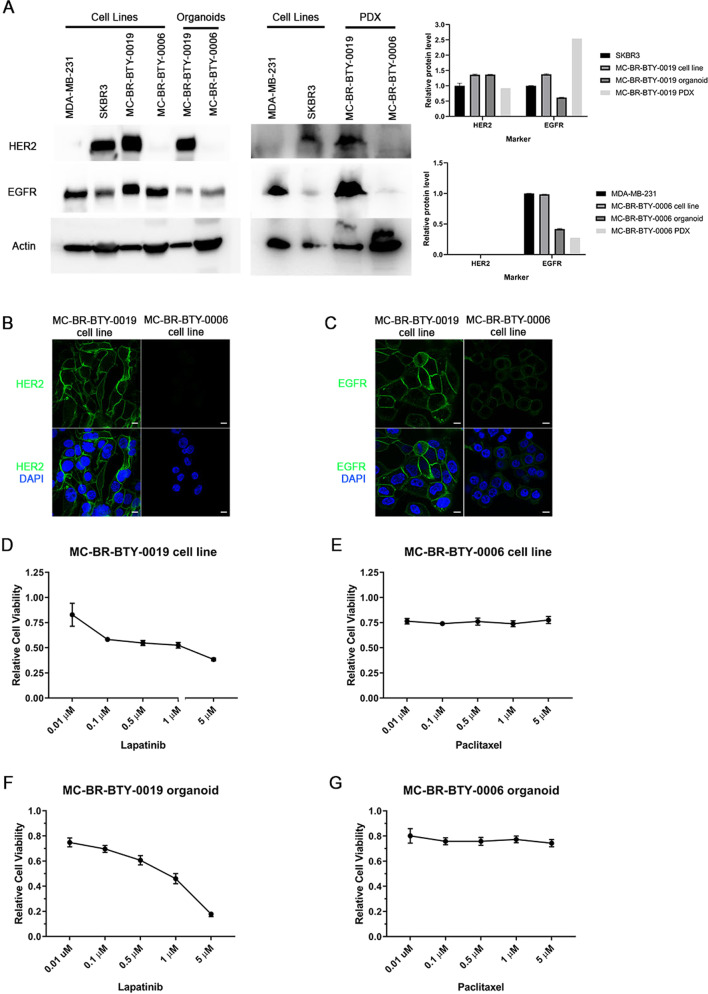
Fig. 3 Cell lines, MC-BR-BTY-0019 and MC-BR-BTY-0006 maintain the subtype characterization and drug response consistent with PDX-derived organoid and PDX tumor. A Western blot and quantification of the levels of HER2, EGFR, and beta-actin in breast cancer cell lines, newly established cell lines, their corresponding PDX-derived organoids and PDX tumors. Expression of HER2 and EGFR for MC-BR-BTY-0019 cell line, organoid, and PDX was normalized to beta-actin and then SKBR3. Expression of HER2 and EGFR for MC-BR-BTY-0006 cell line, organoid, and PDX was normalized to beta-actin and then MDA-MB-231. All blots are derived from the same experiment and were processed in parallel. B MC-BR-BTY-0019 and MC-BR-BTY-0006 cell lines were stained with HER2 and DAPI and images were taken at ×100. Scale bar represents 10 μm. C MC-BR-BTY-0019 and MC-BR-BTY-0006 cell lines were stained with EGFR and DAPI and images were taken at ×100. Scale bar represents 10 μm. D 10,000 cells/well of MC-BR-BTY-0019 cell line were seeded in 96-well plates in triplicates, treated with indicated concentrations of lapatinib for 48 h, and cell viability was measured by MTS assay and normalized to DMSO. IC50 = 438.531 nM. E 10,000 cells/well of MC-BR-BTY-0006 cell line were seeded in 96-well plates in triplicates, treated with paclitaxel at indicated concentrations for 48 h, and cell viability was measured by MTS assay and normalized to DMSO. IC50 = Indeterminate. F, G PDX tumors were collected when the tumor achieved 10–20 mm in diameter, and primary breast cancer cells were isolated after dissociation of tumor tissue from mouse cells, as previously described7. MC-BR-BTY-0019 PDX-derived organoids were generated by seeding 10,000 cells of the primary breast cancer single-cell suspension per well in Nanoculture plates in triplicates and treated with indicated concentrations of lapatinib for 5 days (IC50 = 979.49 nM). MC-BR-BTY-0006 PDX-derived organoids were treated with indicated concentrations of paclitaxel for 5 days (IC50 = Indeterminate). Organoid viability was measured using 3D Cell TiterGlo viability assay, normalized to DMSO, and plotted using GraphPad PRISM software. Error bars represent SEM.
Fig. 3 Cell lines, MC-BR-BTY-0019 and MC-BR-BTY-0006 maintain the subtype characterization and drug response consistent with PDX-derived organoid and PDX tumor. A Western blot and quantification of the levels of HER2, EGFR, and beta-actin in breast cancer cell lines, newly established cell lines, their corresponding PDX-derived organoids and PDX tumors. Expression of HER2 and EGFR for MC-BR-BTY-0019 cell line, organoid, and PDX was normalized to beta-actin and then SKBR3. Expression of HER2 and EGFR for MC-BR-BTY-0006 cell line, organoid, and PDX was normalized to beta-actin and then MDA-MB-231. All blots are derived from the same experiment and were processed in parallel. B MC-BR-BTY-0019 and MC-BR-BTY-0006 cell lines were stained with HER2 and DAPI and images were taken at ×100. Scale bar represents 10 μm. C MC-BR-BTY-0019 and MC-BR-BTY-0006 cell lines were stained with EGFR and DAPI and images were taken at ×100. Scale bar represents 10 μm. D 10,000 cells/well of MC-BR-BTY-0019 cell line were seeded in 96-well plates in triplicates, treated with indicated concentrations of lapatinib for 48 h, and cell viability was measured by MTS assay and normalized to DMSO. IC50 = 438.531 nM. E 10,000 cells/well of MC-BR-BTY-0006 cell line were seeded in 96-well plates in triplicates, treated with paclitaxel at indicated concentrations for 48 h, and cell viability was measured by MTS assay and normalized to DMSO. IC50 = Indeterminate. F, G PDX tumors were collected when the tumor achieved 10–20 mm in diameter, and primary breast cancer cells were isolated after dissociation of tumor tissue from mouse cells, as previously described7. MC-BR-BTY-0019 PDX-derived organoids were generated by seeding 10,000 cells of the primary breast cancer single-cell suspension per well in Nanoculture plates in triplicates and treated with indicated concentrations of lapatinib for 5 days (IC50 = 979.49 nM). MC-BR-BTY-0006 PDX-derived organoids were treated with indicated concentrations of paclitaxel for 5 days (IC50 = Indeterminate). Organoid viability was measured using 3D Cell TiterGlo viability assay, normalized to DMSO, and plotted using GraphPad PRISM software. Error bars represent SEM.CC BY · PubMed Central
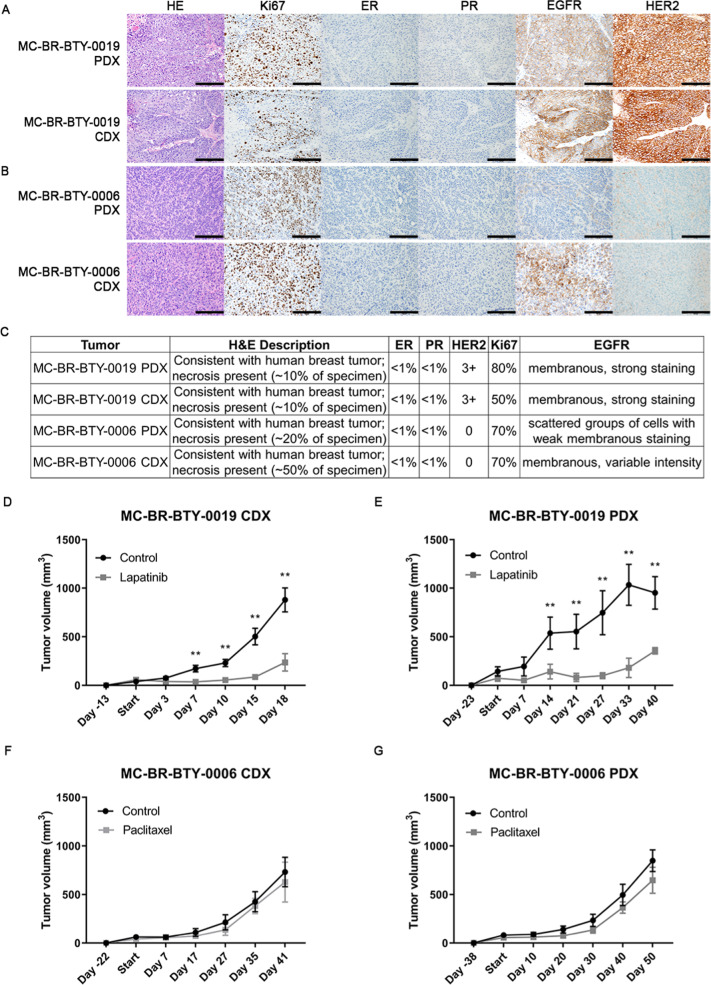
Fig. 4 The two established breast cancer cell lines form CDX tumors in vivo, maintain similar pathology features as their corresponding PDX tumors and show similar drug response in vivo. A, B Pathology staining of HE, Ki67, ER, PR, EGFR, and HER2 was performed in both PDX tumor tissue and CDX tumor formed from MC-BR-BTY-0019 cell line (A) and MC-BR-BTY-0006 (B). Images taken at ×200; Scale bar represents 200 μm. C Detailed description of the pathology staining features of tumor tissue of the PDX and CDX is summarized for MC-BR-BTY-0019 and MC-BR-BTY-0006. D MC-BR-BTY-0019 CDX in vivo tumors were formed by injecting 2 million cells of MC-BR-BTY-0019 cell line into 10 NSG mice, which were randomized when tumor achieved 50–100 mm3 in volume, and treated with either control (n = 5, vehicle, 5 days/week) or lapatinib (n = 5, 50 mg/kg, 5 days/week) for 3 weeks. Tumor volume was measured at indicated time points and plotted using GraphPad PRISM software. Error bars represent SEM. **p < 0.01, 2 tailed Student’s t-test comparing vehicle to drug treatment. E MC-BR-BTY-0019 PDX tumor was formed by injecting earlier passage of PDX tumor into flank of 15 NSG mice, 13 mice with similar size of tumors were randomized when tumor achieved 50–100 mm3 in volume and treated with either control (n = 6, vehicle, 5 days/week) or lapatinib (n = 7, 50 mg/kg, 5 days/week) for 3 weeks. Tumor volume was measured at indicated time points and plotted using GraphPad PRISM software. Error bars represent SEM. **p < 0.01, 2 tailed Student’s t-test comparing vehicle to drug treatment. F MC-BR-BTY-0006 CDX in vivo tumors were formed by injecting 5 million cells of MC-BR-BTY-0006 cell line into 10 NSG mice, which were randomized when the tumor reached 50–100 mm3 in volume, and treated with either control (n = 5, vehicle, 2 times/week) or paclitaxel (n = 5, 12.5 mg/kg, 2 times/week) for 3 weeks. Tumor volume was measured at indicated time points and plotted using GraphPad PRISM software. Error bars represent SEM. p-value = ns, 2 tailed Student’s t-test comparing vehicle to drug treatment. G MC-BR-BTY-0006 PDX tumor was formed by injecting earlier passage of PDX tumor into flank of 15 NSG mice, 12 mice with similar size of tumor were randomized when tumor reached 50–100 mm3 in volume, and treated with either control (n = 6, vehicle, 2 times/week) or paclitaxel (n = 6, 12.5 mg/kg, 2 times/week) for 3 weeks. Tumor volume was measured at indicated time points and plotted using GraphPad PRISM software. Error bars represent SEM. p-value = ns, 2 tailed Student’s t-test comparing vehicle to drug treatment.
Fig. 4 The two established breast cancer cell lines form CDX tumors in vivo, maintain similar pathology features as their corresponding PDX tumors and show similar drug response in vivo. A, B Pathology staining of HE, Ki67, ER, PR, EGFR, and HER2 was performed in both PDX tumor tissue and CDX tumor formed from MC-BR-BTY-0019 cell line (A) and MC-BR-BTY-0006 (B). Images taken at ×200; Scale bar represents 200 μm. C Detailed description of the pathology staining features of tumor tissue of the PDX and CDX is summarized for MC-BR-BTY-0019 and MC-BR-BTY-0006. D MC-BR-BTY-0019 CDX in vivo tumors were formed by injecting 2 million cells of MC-BR-BTY-0019 cell line into 10 NSG mice, which were randomized when tumor achieved 50–100 mm3 in volume, and treated with either control (n = 5, vehicle, 5 days/week) or lapatinib (n = 5, 50 mg/kg, 5 days/week) for 3 weeks. Tumor volume was measured at indicated time points and plotted using GraphPad PRISM software. Error bars represent SEM. **p < 0.01, 2 tailed Student’s t-test comparing vehicle to drug treatment. E MC-BR-BTY-0019 PDX tumor was formed by injecting earlier passage of PDX tumor into flank of 15 NSG mice, 13 mice with similar size of tumors were randomized when tumor achieved 50–100 mm3 in volume and treated with either control (n = 6, vehicle, 5 days/week) or lapatinib (n = 7, 50 mg/kg, 5 days/week) for 3 weeks. Tumor volume was measured at indicated time points and plotted using GraphPad PRISM software. Error bars represent SEM. **p < 0.01, 2 tailed Student’s t-test comparing vehicle to drug treatment. F MC-BR-BTY-0006 CDX in vivo tumors were formed by injecting 5 million cells of MC-BR-BTY-0006 cell line into 10 NSG mice, which were randomized when the tumor reached 50–100 mm3 in volume, and treated with either control (n = 5, vehicle, 2 times/week) or paclitaxel (n = 5, 12.5 mg/kg, 2 times/week) for 3 weeks. Tumor volume was measured at indicated time points and plotted using GraphPad PRISM software. Error bars represent SEM. p-value = ns, 2 tailed Student’s t-test comparing vehicle to drug treatment. G MC-BR-BTY-0006 PDX tumor was formed by injecting earlier passage of PDX tumor into flank of 15 NSG mice, 12 mice with similar size of tumor were randomized when tumor reached 50–100 mm3 in volume, and treated with either control (n = 6, vehicle, 2 times/week) or paclitaxel (n = 6, 12.5 mg/kg, 2 times/week) for 3 weeks. Tumor volume was measured at indicated time points and plotted using GraphPad PRISM software. Error bars represent SEM. p-value = ns, 2 tailed Student’s t-test comparing vehicle to drug treatment.CC BY · PubMed Central
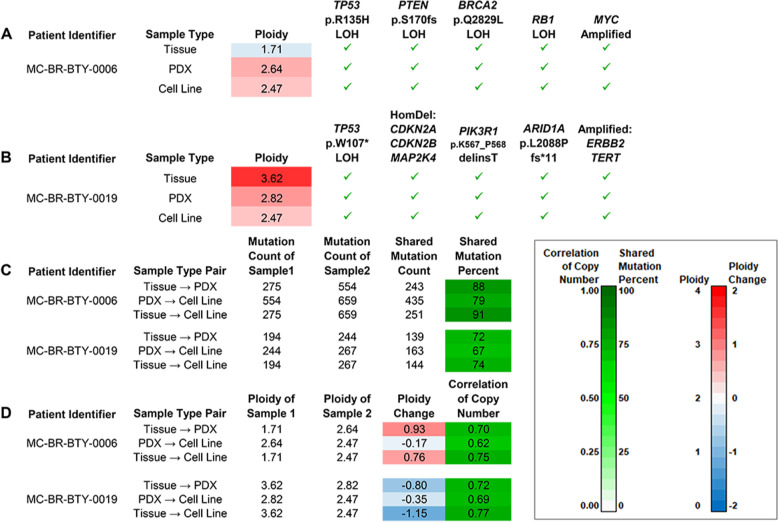
Fig. 5 Exome sequencing reveals several patient-specific cancer driver mutations and an evolutionary trajectory that features their preservation in the presence of somatic changes suggestive of genome instability. A Oncogenic mutations in five cancer genes were detected in all three MC-BR-BTY-0006 tumor samples. Pathogenic loss-of-function somatic SNVs were detected in one allele of each of the genes TP53, PTEN, and BRCA2 as well as the other allele (loss of heterozygosity, or LOH). Thus, loss of function of both copies of tumor-suppressor genes TP53, PTEN, and BRCA2 could be inferred. RB1 loss of heterozygosity (LOH) and amplification of MYC were other oncogenic events observed. B Oncogenic mutations in eight cancer genes were detected in all three MC-BR-BTY-0019 tumor samples. A different pathogenic loss-of-function mutation in TP53 for cell line, but was again observed alongside LOH. So, loss of function of both copies can be inferred for TP53 as well as for three other tumor suppressor genes, CDKN2A, the adjacent CDKN2B, and MAP2K4, due to homozygous deletion (HomDel). Mutations were also observed in PIK3R1 and ARID1A. The mutations affect sites in regions frequently altered in cancer. Amplifications of TERT and ERBB2, or HER2, were also detected, with particularly high amplification for ERBB2. C Of the somatic SNV/INDELs detected in the patient tumor tissue samples, proportions detected in PDXs and cell lines were high (≥72%) for both patients. Of those mutations detected in PDXs, proportions detected in cell lines were also high (79%, 67%). D Changes in ploidy by sample type pair. For each patient, the absolute differences were nearly 1 copy from tissue to PDX with a Tissue→PDX increase observed for MC-BR-BTY-0006 and a Tissue→PDX decrease observed for MC-BR-BTY-0019. Despite these changes, the profiles of within-sample relative copy numbers for Tissue and PDX still showed similarity as the correlation of copy number was still 0.70 or greater. Slight decreases in ploidy were observed from PDX to cell line for both patients.
Fig. 5 Exome sequencing reveals several patient-specific cancer driver mutations and an evolutionary trajectory that features their preservation in the presence of somatic changes suggestive of genome instability. A Oncogenic mutations in five cancer genes were detected in all three MC-BR-BTY-0006 tumor samples. Pathogenic loss-of-function somatic SNVs were detected in one allele of each of the genes TP53, PTEN, and BRCA2 as well as the other allele (loss of heterozygosity, or LOH). Thus, loss of function of both copies of tumor-suppressor genes TP53, PTEN, and BRCA2 could be inferred. RB1 loss of heterozygosity (LOH) and amplification of MYC were other oncogenic events observed. B Oncogenic mutations in eight cancer genes were detected in all three MC-BR-BTY-0019 tumor samples. A different pathogenic loss-of-function mutation in TP53 for cell line, but was again observed alongside LOH. So, loss of function of both copies can be inferred for TP53 as well as for three other tumor suppressor genes, CDKN2A, the adjacent CDKN2B, and MAP2K4, due to homozygous deletion (HomDel). Mutations were also observed in PIK3R1 and ARID1A. The mutations affect sites in regions frequently altered in cancer. Amplifications of TERT and ERBB2, or HER2, were also detected, with particularly high amplification for ERBB2. C Of the somatic SNV/INDELs detected in the patient tumor tissue samples, proportions detected in PDXs and cell lines were high (≥72%) for both patients. Of those mutations detected in PDXs, proportions detected in cell lines were also high (79%, 67%). D Changes in ploidy by sample type pair. For each patient, the absolute differences were nearly 1 copy from tissue to PDX with a Tissue→PDX increase observed for MC-BR-BTY-0006 and a Tissue→PDX decrease observed for MC-BR-BTY-0019. Despite these changes, the profiles of within-sample relative copy numbers for Tissue and PDX still showed similarity as the correlation of copy number was still 0.70 or greater. Slight decreases in ploidy were observed from PDX to cell line for both patients.CC BY · PubMed Central

Verification

Claims the paper makes

The claims and statistics of this paper haven’t been checked yet.

Run the check — free, no account needed. It reads the open-access text and checks the sources it cites.

A few free checks a day · papers already verified open instantly · results are public

Claims other papers make about this one

Each is checked against this paper’s own text: does it say what the citing paper says it does?

Self-check

Percentages, sums and reported differences re-computed from the paper’s own numbers.

The self-check needs the paper’s full text.

Citations

Cites

Show all 2 references

Research works printed but not linked: 39

  1. Mirabelli, P., Coppola, L. & Salvatore, M. Cancer cell lines are useful model systems for medical research. Cancers 11, https://doi.org/10.3390/cancers11081098 (2019). · DOI
  2. Paul, J. The cancer cell in vitro: a review. Cancer Res. 22, 431–440 (1962).
  3. Lasfargues, E. Y. & Ozzello, L. Cultivation of human breast carcinomas. J. Natl Cancer Inst. 21, 1131–1147 (1958).
  4. Miserocchi, G. et al. Management and potentialities of primary cancer cultures in preclinical and translational studies. J. Transl. Med. 15, 229 (2017). · DOI
  5. Yu, J. et al. Establishing and characterizing patient-derived xenografts using pre-chemotherapy percutaneous biopsy and post-chemotherapy surgical samples from a prospective neoadjuvant breast cancer study. Breast Cancer Res. 19, 130 (2017). · DOI
  6. Goetz, M. P. et al. Tumor sequencing and patient-derived xenografts in the neoadjuvant treatment of breast cancer. J. Natl Cancer Inst. 109, https://doi.org/10.1093/jnci/djw306 (2017). · DOI
  7. Yu, J. et al. DNA methyltransferase expression in triple-negative breast cancer predicts sensitivity to decitabine. J. Clin. Investig. 128, 2376–2388 (2018). · DOI
  8. Smith, H. S., Wolman, S. R. & Hackett, A. J. The biology of breast cancer at the cellular level. Biochim. Biophys. Acta 738, 103–123 (1984).
  9. Smith, H. S. et al. Immortalization in culture: occurrence at a late stage in the progression of breast cancer. J. Natl Cancer Inst. 78, 611–615 (1987).
  10. Dai, X., Cheng, H., Bai, Z. & Li, J. Breast cancer cell line classification and its relevance with breast tumor subtyping. J. Cancer 8, 3131–3141 (2017). · DOI
  11. Kodack, D. P. et al. Primary patient-derived cancer cells and their potential for personalized cancer patient care. Cell Rep. 21, 3298–3309 (2017). · DOI
  12. Dangles-Marie, V. et al. Establishment of human colon cancer cell lines from fresh tumors versus xenografts: comparison of success rate and cell line features. Cancer Res. 67, 398–407 (2007). · DOI
  13. Cavalloni, G. et al. Establishment and characterization of a human intrahepatic cholangiocarcinoma cell line derived from an Italian patient. Tumour Biol. 37, 4041–4052 (2016). · DOI
  14. Matossian, M. D. et al. Drug resistance profiling of a new triple negative breast cancer patient-derived xenograft model. BMC Cancer 19, 205 (2019). · DOI
  15. Casey, S. C. et al. The effect of environmental chemicals on the tumor microenvironment. Carcinogenesis 36, S160–S183 (2015). · DOI
  16. Mota, A. L. et al. Molecular characterization of breast cancer cell lines by clinical immunohistochemical markers. Oncol. Lett. 13, 4708–4712 (2017).
  17. Voigtlaender, M., Schneider-Merck, T. & Trepel, M. Lapatinib. Recent Results Cancer Res. 211, 19–44 (2018). · DOI
  18. Abu Samaan, T. M., Samec, M., Liskova, A., Kubatka, P. & Busselberg, D. Paclitaxel’s mechanistic and clinical effects on breast cancer. Biomolecules 9, (2019). https://doi.org/10.3390/biom9120789. · DOI
  19. Hajitou, A. et al. A preclinical model for predicting drug response in soft-tissue sarcoma with targeted AAVP molecular imaging. Proc. Natl Acad. Sci. USA 105, 4471–4476 (2008). · DOI
  20. Holliday, D. L. & Speirs, V. Choosing the right cell line for breast cancer research. Breast Cancer Res. 13, 215 (2011). · DOI
  21. Negrini, S., Gorgoulis, V. G. & Halazonetis, T. D. Genomic instability—an evolving hallmark of cancer. Nat. Rev. Mol. Cell Biol. 11, 220–228 (2010). · DOI · Paper page
  22. Zhao, B. et al. ARID1A promotes genomic stability through protecting telomere cohesion. Nat. Commun. 10, 4067 (2019). · DOI
  23. ICGA-TCGA-Pan-Cancer-Analysis-of-Whole-Genomes-Consortium. Pan-cancer analysis of whole genomes. Nature 578, 82–93 (2020). · DOI · Paper page
  24. Sweeney, K. J., Swarbrick, A., Sutherland, R. L. & Musgrove, E. A. Lack of relationship between CDK activity and G1 cyclin expression in breast cancer cells. Oncogene 16, 2865–2878 (1998). · DOI
  25. Cowley, G. S. et al. Parallel genome-scale loss of function screens in 216 cancer cell lines for the identification of context-specific genetic dependencies. Sci. Data 1, 140035 (2014). · DOI
  26. Jacobi, N. et al. Organotypic three-dimensional cancer cell cultures mirror drug responses in vivo: lessons learned from the inhibition of EGFR signaling. Oncotarget 8, 107423–107440 (2017). · DOI · Paper page
  27. Ekert, J. E. et al. Three-dimensional lung tumor microenvironment modulates therapeutic compound responsiveness in vitro-implication for drug development. PLoS ONE 9, e92248 (2014). · DOI
  28. Khaled, W. T. & Liu, P. Cancer mouse models: past, present and future. Semin. Cell Dev. Biol. 27, 54–60 (2014). · DOI
  29. Zhang, D. et al. Activity of lapatinib is independent of EGFR expression level in HER2-overexpressing breast cancer cells. Mol. Cancer Ther. 7, 1846–1850 (2008). · DOI
  30. Burdall, S. E., Hanby, A. M., Lansdown, M. R. & Speirs, V. Breast cancer cell lines: friend or foe? Breast Cancer Res. 5, 89–95 (2003). · DOI
  31. Merlo, L. M., Wang, L. S., Pepper, J. W., Rabinovitch, P. S. & Maley, C. C. Polyploidy, aneuploidy and the evolution of cancer. Adv. Exp. Med. Biol. 676, 1–13 (2010). · DOI
  32. Ellingson, M. S. et al. Exome sequencing reveals frequent deleterious germline variants in cancer susceptibility genes in women with invasive breast cancer undergoing neoadjuvant chemotherapy. Breast Cancer Res. Treat. 153, 435–443 (2015). · DOI
  33. McKenna, A. et al. The Genome Analysis Toolkit: a MapReduce framework for analyzing next-generation DNA sequencing data. Genome Res. 20, 1297–1303 (2010). · DOI · Paper page
  34. McLaren, W. et al. The ensembl variant effect predictor. Genome Biol. 17, 122 (2016). · DOI · Paper page
  35. Haider, S. et al. A bedr way of genomic interval processing. Source Code Biol. Med. 11, 14 (2016). · DOI
  36. Cheng, D. T. et al. Memorial Sloan Kettering-Integrated Mutation Profiling of Actionable Cancer Targets (MSK-IMPACT): a hybridization capture-based next-generation sequencing clinical assay for solid tumor molecular oncology. J. Mol. Diagn. 17, 251–264 (2015). · DOI · Paper page
  37. Vogelstein, B. et al. Cancer-genome-landscapes. Science 339, 1546–1558 (2013). · DOI · Paper page
  38. Tate, J. G. et al. COSMIC: the catalogue of somatic mutations in cancer. Nucleic Acids Res. 47, D941–D947 (2019). · DOI · Paper page
  39. Herschkowitz, J. I., He, X., Fan, C. & Perou, C. M. The functional loss of the retinoblastoma tumour suppressor is a common event in basal-like and luminal B breast carcinomas. Breast Cancer Res. 10, R75 (2008). · DOI

Cited by

Metadata

Authors
Zhuang, Y., Grainger, J. M., Vedell, P. T., Yu, J., Moyer, A. M., Gao, H., Fan, X.-Y., Qin, S., Liu, D., Kalari, K. R., Goetz, M. P., Boughey, J. C., Weinshilboum, R. M., & Wang, L.
Venue
npj Breast Cancer
Published
2021-06-18
Volume
7
Issue
1
ISSN
2374-4677
Cited by
11
References
2
Language
en

About these checks

Registry, retraction, Cites and statistics results are computed, not judged, with one exception: a printed reference that no index lists is read once by a model before it counts as a citation error. Claims are extracted by a model and kept only when their quote appears verbatim in the text; each cited source is then checked, with a model’s help, for whether it says what the claim relies on. Those verdicts can be wrong — read the claim’s quote and the cited source before relying on one.

Statistics and arithmetic are recomputed, not judged.

Confidence bands are shown only for fields calibrated on our annotated test set. None is calibrated yet, so no band is shown.

What counts as a claim ›How we measure confidence ›How we check this ›

Are you an author, or do you see a problem with this page? Request a review