

The DOI matches its Crossref record; 121 of the 121 references it cites were found in a registry or an index.
The sequences of 150,119 genomes in the UK Biobank
Open accessPublished version of a preprint
Abstract
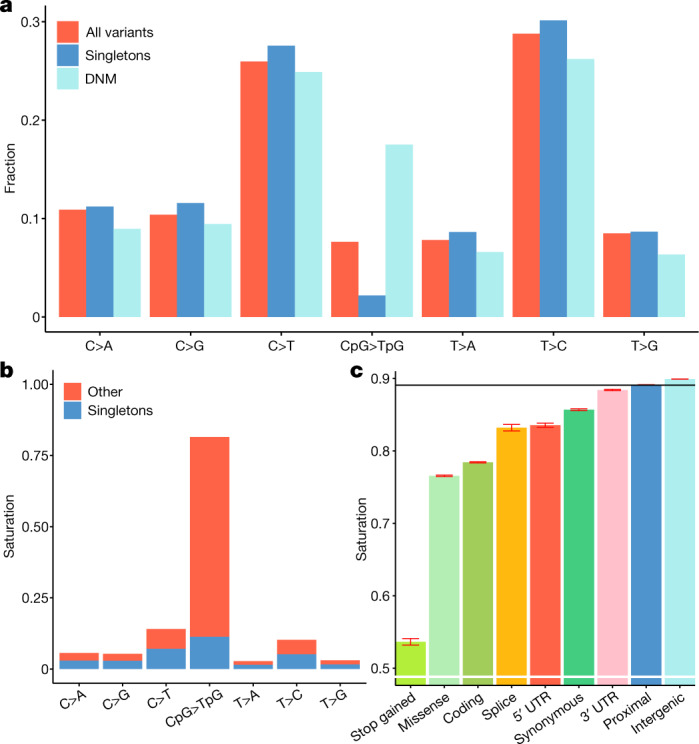
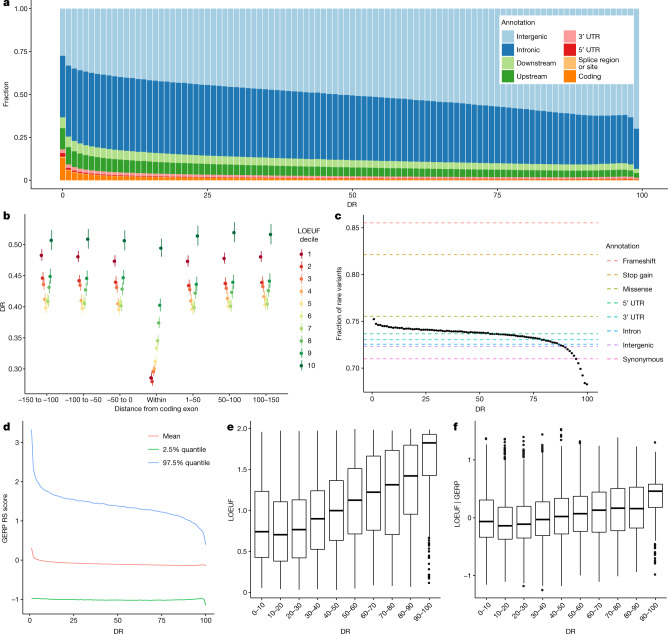
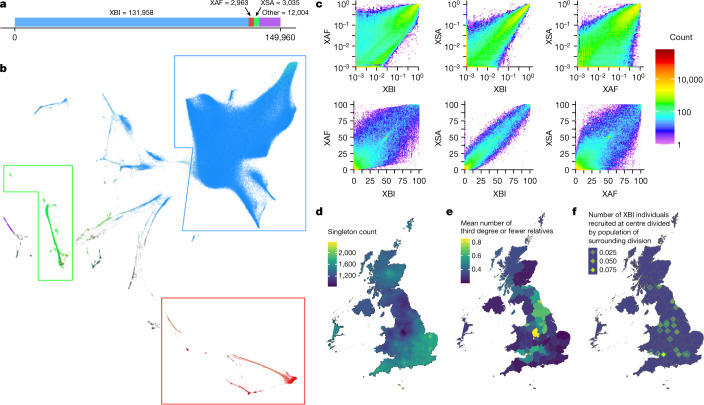
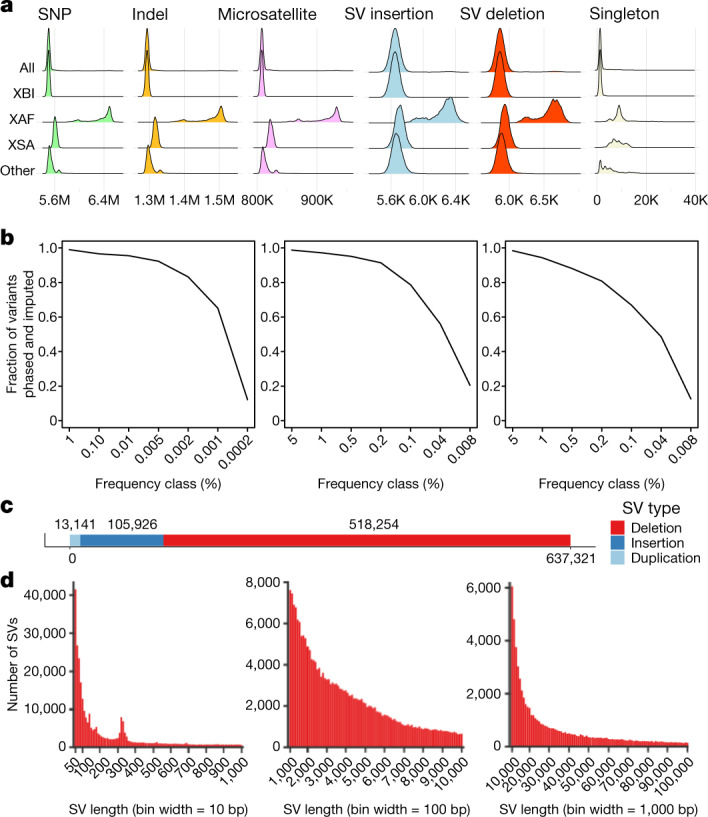
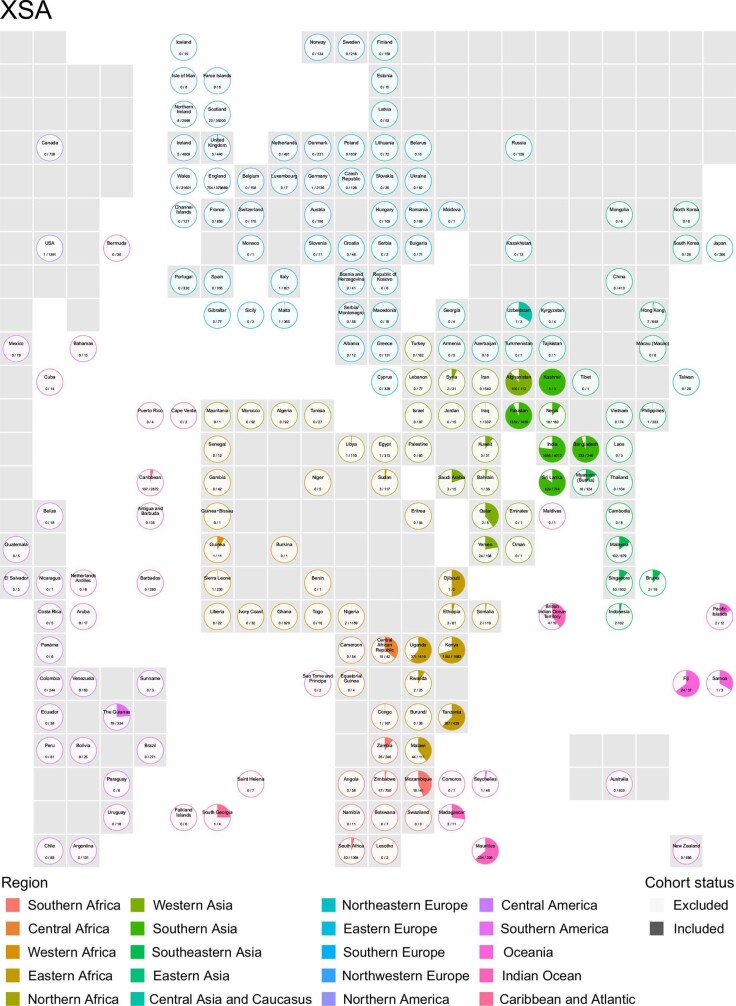
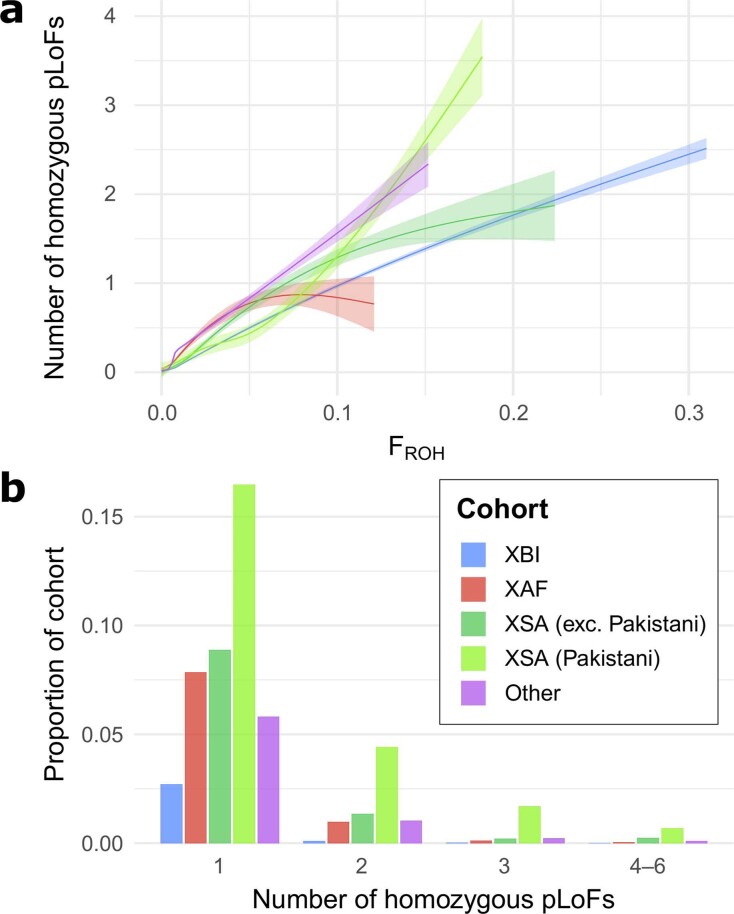
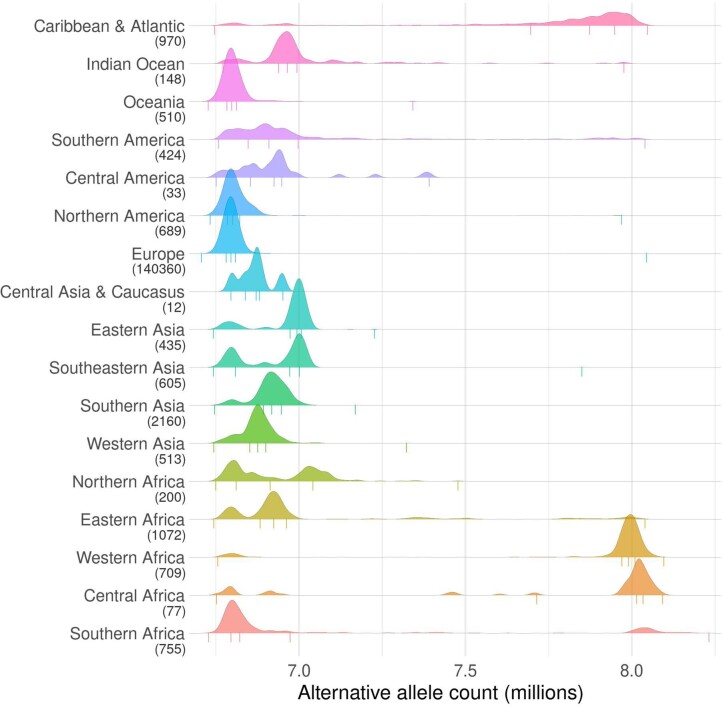
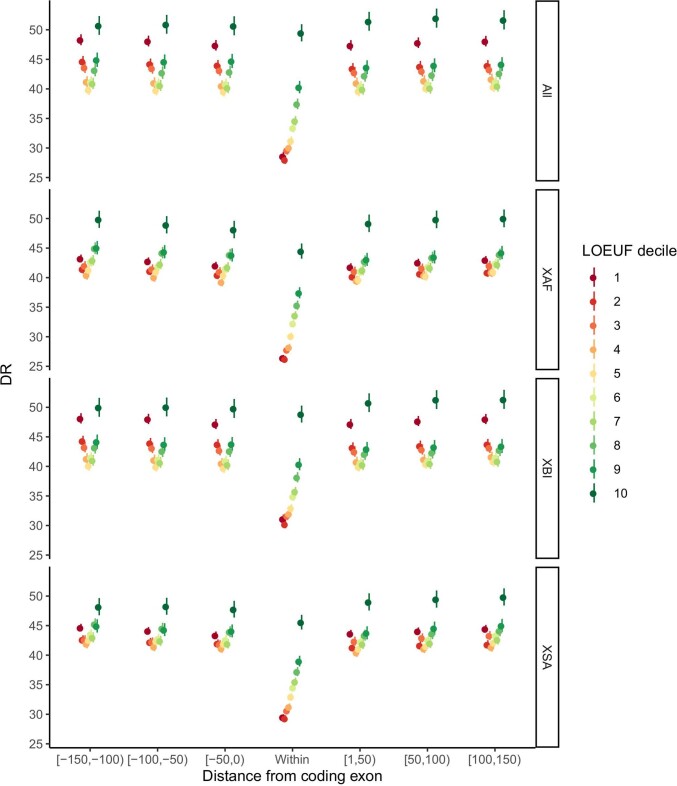
Detailed knowledge of how diversity in the sequence of the human genome affects phenotypic diversity depends on a comprehensive and reliable characterization of both sequences and phenotypic variation. Over the past decade, insights into this relationship have been obtained from whole-exome sequencing or whole-genome sequencing of large cohorts with rich phenotypic data 1,2 . Here we describe the analysis of whole-genome sequencing of 150,119 individuals from the UK Biobank 3 . This constitutes a set of high-quality variants, including 585,040,410 single-nucleotide polymorphisms, representing 7.0% of all possible human single-nucleotide polymorphisms, and 58,707,036 indels. This large set of variants allows us to characterize selection based on sequence variation within a population through a depletion rank score of windows along the genome. Depletion rank analysis shows that coding exons represent a small fraction of regions in the genome subject to strong sequence conservation. We define three cohorts within the UK Biobank: a large British Irish cohort, a smaller African cohort and a South Asian cohort. A haplotype reference panel is provided that allows reliable imputation of most variants carried by three or more sequenced individuals. We identified 895,055 structural variants and 2,536,688 microsatellites, groups of variants typically excluded from large-scale whole-genome sequencing studies. Using this formidable new resource, we provide several examples of trait associations for rare variants with large effects not found previously through studies based on whole-exome sequencing and/or imputation.
Overview
The claims and statistics of this paper haven’t been checked yet.
Run the check — free, no account needed. It reads the open-access text and checks the sources it cites.
Integrity signals
Registry
Cites
Statistics
Figures
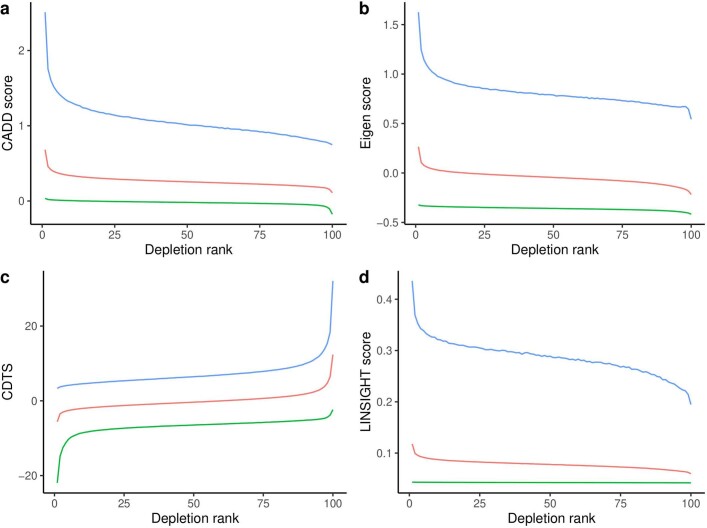
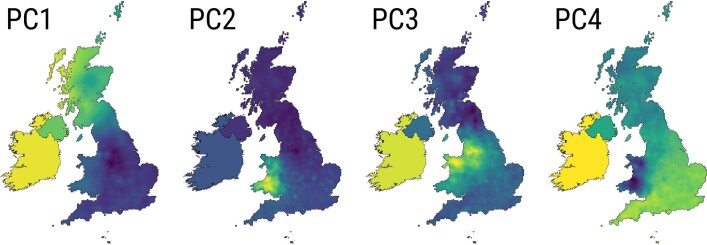
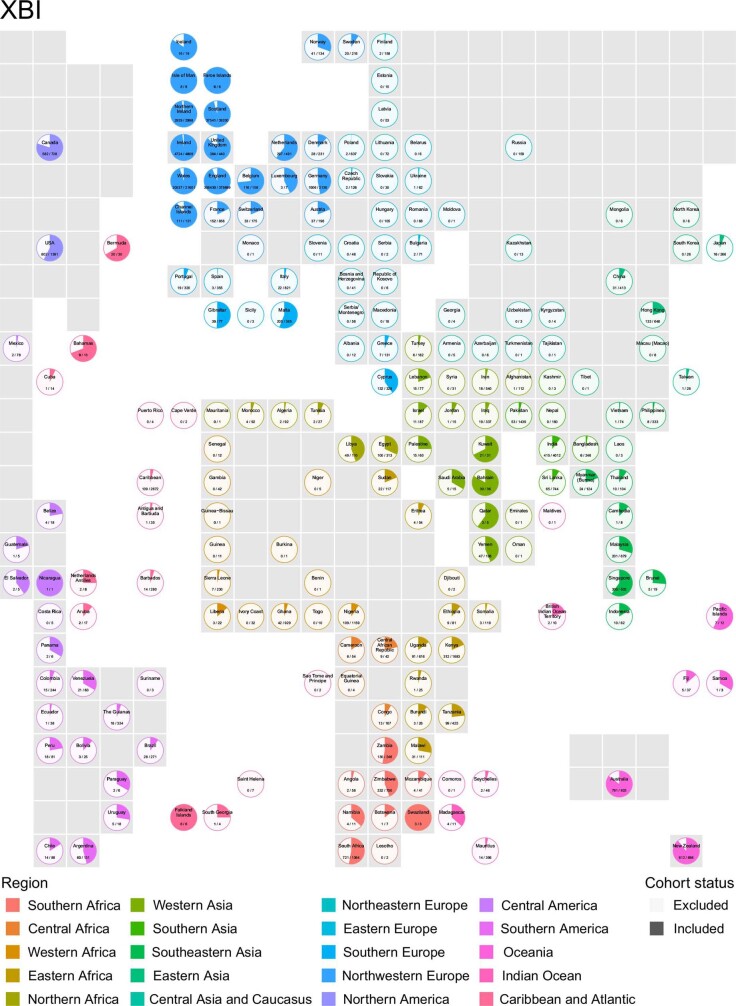
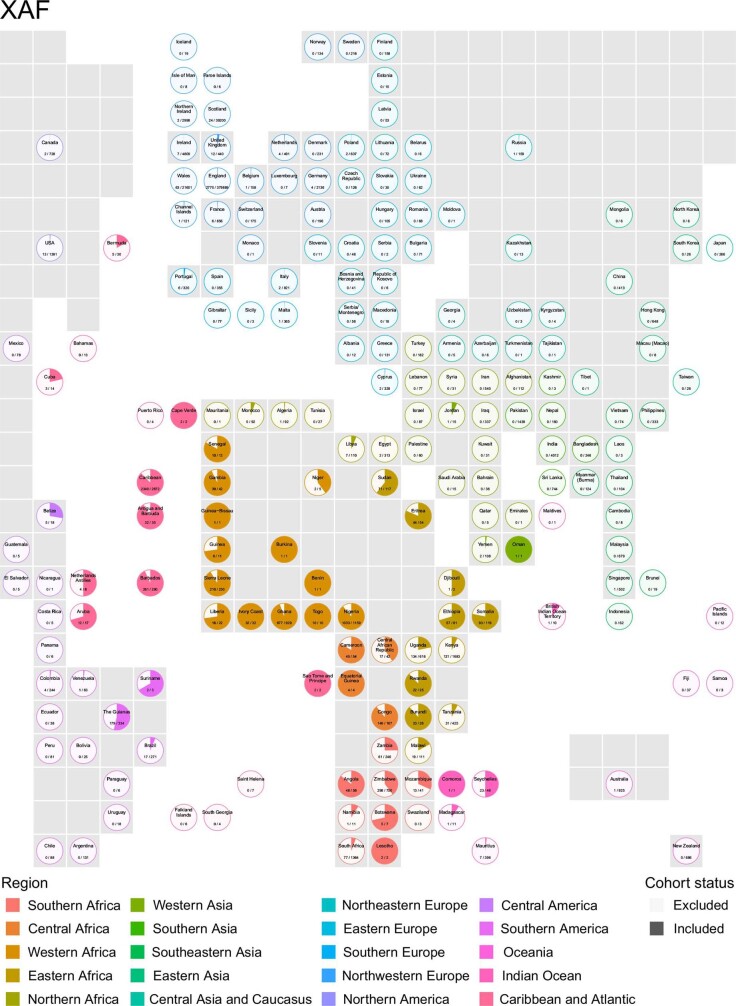
Verification
Claims the paper makes
The claims and statistics of this paper haven’t been checked yet.
Run the check — free, no account needed. It reads the open-access text and checks the sources it cites.
Claims other papers make about this one
Each is checked against this paper’s own text: does it say what the citing paper says it does?
The source backs part of the claim, not all of it — or backs it for a different population, condition or comparison.
In the citing paper
“Further, almost all participants underwent genome-wide array genotyping and, more recently, proteome, whole-exome sequencing 83 and WGS 84 .”
From Multimodal biomedical AI (2022) · cites this paper as [84]
Experimental — accuracy not yet measuredThe cited source says what the claim attributes to it.
In the citing paper
“Given that more than 98% of observed genetic variation in humans is non-coding7, global characterization of the complex effects of this vast majority of variants remains intractable without computational predictions.”
From Advancing regulatory variant effect prediction with AlphaGenome (2026) · cites this paper as [7]
Self-check
Percentages, sums and reported differences re-computed from the paper’s own numbers.
The self-check needs the paper’s full text.
Citations
Cites
The Sequence Alignment/Map format and SAMtools
Li, H., Handsaker, B., Wysoker, A., Fennell, T., Ruan, J., Homer, N., Marth, G., Abecasis, G., Durbin, R., & 1000 Genome Project Data Processing Subgroup (2009) · Bioinformatics · doi:10.1093/bioinformatics/btp352 · Cited by 62,041
Fast and accurate short read alignment with Burrows-Wheeler transform
Li, H., & Durbin, R. (2009) · Bioinformatics · doi:10.1093/bioinformatics/btp324 · Cited by 58,607
PLINK: a tool set for whole-genome association and population-based linkage analyses.
Purcell, S., Neale, B., Todd-Brown, K., Thomas, L., Ferreira, M. A. R., Bender, D., Maller, J., Sklar, P., de Bakker, P. I. W., Daly, M. J., et al. (2007) · The American Journal of Human Genetics · doi:10.1086/519795 · Cited by 34,089
The Genome Analysis Toolkit: A MapReduce framework for analyzing next-generation DNA sequencing data
McKenna, A., Hanna, M., Banks, E., Sivachenko, A., Cibulskis, K., Kernytsky, A., Garimella, K., Altshuler, D., Gabriel, S., Daly, M., et al. (2010) · Genome Research · doi:10.1101/gr.107524.110 · Cited by 27,895
A global reference for human genetic variation
The 1000 Genomes Project Consortium, authors, C., Auton, A., Abecasis, G. R., Steering committee, Altshuler, D. M., Durbin, R. M., Abecasis, G. R., Bentley, D. R., Chakravarti, A., et al. (2015) · Nature · doi:10.1038/nature15393 · Cited by 18,247
An integrated encyclopedia of DNA elements in the human genome
The ENCODE Project Consortium (2012) · Nature · doi:10.1038/nature11247 · Cited by 18,072
Sudlow, C., Gallacher, J., Allen, N., Beral, V., Burton, P., Danesh, J., Downey, P., Elliott, P., Green, J., Landray, M., et al. (2015) · PLOS Medicine · doi:10.1371/journal.pmed.1001779 · Cited by 12,728
Fast and accurate long-read alignment with Burrows-Wheeler transform.
Li, H., & Durbin, R. (2010) · Bioinformatics · doi:10.1093/bioinformatics/btp698 · Cited by 12,063
Fast model-based estimation of ancestry in unrelated individuals
Alexander, D. H., Novembre, J., & Lange, K. (2009) · Genome Research · doi:10.1101/gr.094052.109 · Cited by 9,898
The mutational constraint spectrum quantified from variation in 141,456 humans
Karczewski, K. J., Francioli, L. C., Tiao, G., Cummings, B. B., Alföldi, J., Wang, Q., Collins, R. L., Laricchia, K. M., Ganna, A., Birnbaum, D. P., et al. (2020) · Nature · doi:10.1038/s41586-020-2308-7 · Cited by 9,434
Cited by
Sorted by citations
Items 301–400 of 475
Hidden protein-altering variants influence diverse human phenotypesPreprint
Hujoel, M. L. A., Handsaker, R. E., Sherman, M. A., Kamitaki, N., Barton, A. R., Mukamel, R. E., Terao, C. C., McCarroll, S. A., & Loh, P. (2023) · bioRxiv (Cold Spring Harbor Laboratory) · doi:10.1101/2023.06.07.544066 · Cited by 2
Hawkes, G., Chundru, V. K., Jackson, L. M., Patel, K. A., Murray, A., Wood, A. R., Wright, C. F., Weedon, M. N., Frayling, T. M., & Beaumont, R. N. (2023) · bioRxiv (Cold Spring Harbor Laboratory) · doi:10.1101/2023.11.04.565589 · Cited by 2
Hypometric genetics: Improved power in genetic discovery by incorporating quality control flags
Tanigawa, Y., & Kellis, M. (2024) · The American Journal of Human Genetics · doi:10.1016/j.ajhg.2024.09.008 · Cited by 1
Assessment of the functionality and usability of open-source rare variant analysis pipelines
Riccio, C., Jansen, M. L., Sandberg, F., Koliopanos, G., Link, V., & Ziegler, A. (2024) · Briefings in Bioinformatics · doi:10.1093/bib/bbaf044 · Cited by 1
The legacy of Luca Cavalli-Sforza on human evolution
Colucci, M., Leonardi, M., Hodgson, J. A., Stringer, C. B., & Scerri, E. M. L. (2025) · Human Population Genetics and Genomics · doi:10.47248/hpgg2505010001 · Cited by 1
Ying, D., Kwok, J. S. L., Chu, A. T.-W., Ma, W., Tam, H. Y. F., Or, D., Hue, S. P. Y., Hong Kong Genome Project, Li, Q., Leung, C. K.-S., et al. (2025) · Human Genetics · doi:10.1007/s00439-025-02737-x · Cited by 1
Multi-ancestry whole genome sequencing analysis of lean body mass
Zhang, X., Su, K.-J., Banerjee, B., Eres, I. E., Hsu, Y., Crandall, C. J., Rajashekar, D., Han, Z., Jackson, R. D., Liu, H., et al. (2025) · Genome biology · doi:10.1186/s13059-025-03520-x · Cited by 2
The Collaborative Cross as a Model for Studying Viral Infections
Sylvester, P. A., & Heise, M. T. (2025) · Annual Review of Virology · doi:10.1146/annurev-virology-100422-031014 · Cited by 1
Chen, H., Liu, Z., Du, H., Wan, Z., Bai, X., & Mi, J. (2025) · Human Genomics · doi:10.1186/s40246-025-00832-8 · Cited by 1
African-ancestry-specific variant IKKβ p.Glu502Lys confers high lupus risk
Thorlacius, G. E., Ivarsdottir, E. V., Saevarsdóttir, S., Moore, K. H. S., Gudjonsson, S. A., Halldórsson, B. V., Hólm, H., Jónasdóttir, Á., Jónsson, F., Kristmundsdóttir, S., et al. (2025) · Nature Genetics · doi:10.1038/s41588-025-02398-6 · Cited by 2
Self-citationCGG, CAG, and GAA: Genome-wide comparison of the disease linked trinucleotide short tandem repeats
Annear, D. J., Vandeweyer, G., & Kooy, R. F. (2026) · BMC Genomics · doi:10.1186/s12864-026-12651-9 · Cited by 1
Zhu, D. Y.-D., Sangesland, M., Okonkwo, V., Zhang, Z., Rosado, V. C., Ronsard, L., McCarthy, C., Alexander, C., Barnes, R. M., Rohrer, D., et al. (2026) · Cell Reports · doi:10.1016/j.celrep.2026.117224 · Cited by 1
Phenotypic prediction of missense variants via deep contrastive learning
Wen, J., Zeng, S., Bonzel, C.-L., Kobren, S. N., Du, J., 柴怡, Wang, H. Y., Zhu, M., Chen, S., Leng, F., et al. (2026) · Nature Biomedical Engineering · doi:10.1038/s41551-026-01636-4 · Cited by 3
WEAP: an automated and accelerated pipeline for analyzing large scale whole exome sequencing data
Sarma, R. J., & Kumar, N. S. (2026) · BMC Methods · doi:10.1186/s44330-026-00080-9 · Cited by 1
Resistant Hypertension Variants Link to Hyperaldosteronism and Potassium Levels
Tragante, V., Sulem, P., Þorleifsson, G., Frigge, M. L., Arthur, J. G., Asselbergs, F. W., Banasik, K., Brunak, S., Christensen, A. H., Crawford, D. C., et al. (2026) · Hypertension · doi:10.1161/hypertensionaha.123.22301 · Cited by 3
Self-citationMultiallelic Maximal Perfect Haplotype Blocks with Wildcards via PBWT
Bonizzoni, P., Vedova, G. D., Pirola, Y., Rizzi, R., & Sgro, M. (2023) · Lecture notes in computer science · doi:10.1007/978-3-031-34953-9_5 · Cited by 1
An expanded genomic database for identifying disease-related variants
Dhindsa, R. S., & Petrovski, S. (2023) · Nature · doi:10.1038/d41586-023-01598-6 · Cited by 1
Li, X. (2023) · XRDS Crossroads The ACM Magazine for Students · doi:10.1145/3637460 · Cited by 1
Genetic counseling and related issues
Park, K., & Kim, J. (2024) · Elsevier eBooks · doi:10.1016/b978-0-323-99417-0.00018-5 · Cited by 1
PERADIGM: Phenotype embedding similarity-based rare disease gene mapping
Zheng, W., Xie, Y., Gu, J., Li, H., Somlo, S., Besse, W., & Zhao, H. (2025) · PLoS Genetics · doi:10.1371/journal.pgen.1011976 · Cited by 1
Decoding Diversity from a “Small Rock” in the North Atlantic: An Interview with Kari Stefansson
Stefánsson, K., & Branca, M. A. (2022) · GEN Biotechnology · doi:10.1089/genbio.2022.29056.kst · Cited by 1
Editorial: Integrative Approaches to Analyze Cancer Based on Multi‐Omics
Shen, S. (2022) · Frontiers in Genetics · doi:10.3389/fgene.2022.1057408 · Cited by 1
μ -PBWT: Enabling the Storage and Use of UK Biobank Data on a Commodity LaptopPreprint
Cozzi, D., Rossi, M., Rubinacci, S., Köppl, D., Boucher, C. A., & Bonizzoni, P. (2023) · bioRxiv (Cold Spring Harbor Laboratory) · doi:10.1101/2023.02.15.528658 · Cited by 1
Li, X., Morel, J., Benegiamo, G., Poisson, J., Bachmann, A., Rapin, A., Sulc, J., Williams, E. G., Perino, A., Schoonjans, K., et al. (2023) · bioRxiv (Cold Spring Harbor Laboratory) · doi:10.1101/2023.03.22.533818 · Cited by 1
Bhérer, C., Eveleigh, R. J. M., Trajanoska, K., St-Cyr, J., Paccard, A., Ravindran, P. N., Caron, E. A., Asbah, N. B., Wei, C., Baumgärtner, I., et al. (2023) · bioRxiv (Cold Spring Harbor Laboratory) · doi:10.1101/2023.04.27.538531 · Cited by 1
He, G., Huang, Y., Chen, J., Wang, Z., Li, X., Duan, S., Sun, Q., Yan, J., Liu, C., & Wang, M. (2023) · doi:10.22541/au.168933511.19000548/v1
Westergaard, D., Steinthórsdóttir, V., Stefánsdóttir, L., Rohde, P. D., Wu, X., Geller, F., Tyrmi, J. S., Havulinna, A. S., Solé-Navais, P., Flatley, C. J., et al. (2023) · medRxiv · doi:10.1101/2023.08.10.23293932 · Cited by 1
Self-citationSequence composition and conservation predict the phenotypic relevance of transposable elementsPreprint
Cerruti, Y., Fusco, D., Jahanbin, M., Marnetto, D., & Provero, P. (2024) · bioRxiv (Cold Spring Harbor Laboratory) · doi:10.1101/2024.03.11.584453 · Cited by 1
Lockhart, S. M., Mušo, M., Zvetkova, I., Lam, B., Ferrari, A., Schoenmakers, E., Duckett, K., Leslie, J., Romartínez-Alonso, B., Tadross, J. A., et al. (2024) · bioRxiv (Cold Spring Harbor Laboratory) · doi:10.1101/2024.04.28.591512 · Cited by 1
Lorenzini, P. A., & Langley, S. R. (2024) · medRxiv · doi:10.1101/2024.05.30.24307732 · Cited by 1
Jiang, X., Hu, F., Zou, X. Z., Abbasi, A., Deevi, S. V. V., Atanur, S. S., O’Neill, A., Harrow, J., Fabre, M. A., Wang, Q., et al. (2024) · medRxiv · doi:10.1101/2024.07.23.24310892 · Cited by 1
GWAS on short tandem repeats identifies novel genetic mechanisms in Alzheimer’s diseasePreprint
Gmelin, D., Ohlei, O., Aslam, M., Parkkinen, L., Mullin, K., Prokopenko, D., Lill, C. M., Tanzi, R. E., Dobričić, V., & Bertram, L. (2025) · medRxiv · doi:10.1101/2025.03.13.25323833 · Cited by 1
Nyeo, S. S. Y., Cumming, E. M., Burren, O. S., Pagadala, M. S., Gutierrez, J. C., Ali, T. A., Kida, L. C., Chen, Y., Hu, F., Hollis, B., et al. (2025) · bioRxiv (Cold Spring Harbor Laboratory) · doi:10.1101/2025.07.18.665549 · Cited by 1
Whole-genome sequencing reveals variant associations with brain imaging phenotypesPreprint
Liu, B., Deng, Y., & Li, C. (2026) · bioRxiv (Cold Spring Harbor Laboratory) · doi:10.64898/2026.01.07.697998 · Cited by 1
The performance of genetic-constraint metrics varies significantly across the human noncoding genomePreprint
McHale, P. T., Goldberg, M. E., & Quinlan, A. R. (2026) · bioRxiv (Cold Spring Harbor Laboratory) · doi:10.64898/2026.01.28.701168 · Cited by 1
Selecting Chromosomes for Polygenic Traits: Algorithms and Complexity *Preprint
Zuk, O. (2022) · bioRxiv (Cold Spring Harbor Laboratory) · doi:10.1101/2022.11.14.516379
Seviiri, M. (2022) · Queensland University of Technology · doi:10.5204/thesis.eprints.236969
Williams, A. T., Chen, J., Coley, K., Batini, C., Izquierdo, A. G., Packer, R. J., Abner, E., Shepherd, D. J., Free, R. C., Hollox, E. J., et al. (2022) · medRxiv · doi:10.1101/2022.12.22.22283779
Mroczek, M., Liu, J., Sypniewski, M., Pieńkowski, T., Itrych, B., Stojak, J., Pronobis‐Szczylik, B., Stępień, M., Kaja, E., Dabrowski, M., et al. (2023) · Frontiers in Oncology · doi:10.3389/fonc.2023.1045817
Cannon, S. J., Hall, T., Hawkes, G., Colclough, K., Boggan, R. M., Wright, C. F., Pickett, S. J., Hattersley, A. T., Weedon, M., & Patel, K. A. (2023) · medRxiv · doi:10.1101/2023.06.12.23291273
Li, X., Morel, J., Benegiamo, G., Poisson, J., Bachmann, A., Rapin, A., Sulc, J., Williams, E. G., Perino, A., Schoonjans, K., et al. (2023) · eLife · doi:10.7554/elife.87569.2
Determinants and Consequences of Hearing Impairment and Tinnitus
Goderie, T. P. M. (2023) · doi:10.5463/thesis.239
Sørensen, D. (2023) · Statistics for biology and health · doi:10.1007/978-3-031-35851-7_1
The effect of protein levels of ABO on pregnancy related outcomes: a Mendelian randomization studyPreprint
Sun, Y., Zheng, H., Wang, M., Gu, R., Wu, X., Yang, Q., Zhao, H., Bi, Y., & Zheng, J. (2023) · medRxiv · doi:10.1101/2023.10.11.23296777
Johnson, N. (2023) · Evolution · doi:10.1093/evolut/qpad176
Characterizing the genetic architecture of chronic kidney disease
Tran, K. N. (2023) · Queensland University of Technology · doi:10.5204/thesis.eprints.244665
Lee, S., Kim, J.-H., & Ohn, J. H. (2023) · BMC Genomics · doi:10.1186/s12864-023-09903-3
A Lossless Compression Pipeline for Petabyte-Scale Whole Genome Sequencing Data
Bhat, A., Chadalavada, S. M., Jammula, N., Jain, C., & Simmhan, Y. L. (2023) · IEEE International Conference on High Performance Computing, Data, and Analytics · doi:10.1109/hipc58850.2023.00056
Simultaneous estimation of genotype error and uncalled deletion rates in whole genome sequence data
Masaki, N., Browning, S. R., & Browning, B. L. (2024) · PLoS Genetics · doi:10.1371/journal.pgen.1011297
WEAP: An automatic and accelerated pipeline for analysing multi-sample whole exome sequencing dataPreprint
Sarma, R. J., & Nachimuthu (2024) · Research Square · doi:10.21203/rs.3.rs-4512130/v1
Jang, H.-M., Hwang, M. Y., Park, Y. S., Kim, B.-J., & Kim, Y. J. (2024) · medRxiv · doi:10.1101/2024.08.28.24312708
A genotype-first approach identifies variants for orofacial clefts and other phenotypes in dogsPreprint
Buckley, R. M., Bilgen, N., Harris, A. C., Savolainen, P., Tepeli, C., Erdoğan, M., Armero, A. S., Dreger, D. L., van Steenbeek, F. G., Hytönen, M. K., et al. (2024) · bioRxiv (Cold Spring Harbor Laboratory) · doi:10.1101/2024.10.04.616687
Ellegaard, M. R., Ebenesersdóttir, S. S., Moore, K. H. S., Petersen, A., Vågene, Å. J., Bieker, V. C., Denham, S. D., Cavalleri, G. L., Gilbert, E. H., Werge, T. M., et al. (2024) · iScience · doi:10.1016/j.isci.2024.111076
Self-citationQuenez, O., Schramm, C., Cassinari, K., Nicolas, A., Groeneveld, J., Huguet, G., Grenier‐Boley, B., Hulsman, M., Walters, G. B., de Rojas, I., et al. (2024) · medRxiv · doi:10.1101/2024.10.28.24314051
Molecular Methods for Genetic Diagnosis of Inborn Errors of Immunity
Anzick, S. L., & Hsu, A. P. (2024) · doi:10.1002/9781683674023.ch2
Witt, S. H., & Zillich, L. (2024) · Elsevier eBooks · doi:10.1016/b978-3-437-21074-7.00004-6
GWAS and Post-GWAS: Single-Nucleotide Polymorphism Mapping and Analyses
Azimi, A., Batra, J., & Srinivasan, S. (2024) · Elsevier eBooks · doi:10.1016/b978-0-323-95502-7.00258-x
Genetics and Population Analysis
Balyan, P., Nisamudheen, N. A., Jan, Z., Velayutham, D., Balyan, M. K., & Jithesh, P. V. (2025) · Elsevier eBooks · doi:10.1016/b978-0-323-95502-7.00293-1
Arunachalam, V., Tran, K. N., Hoy, W. E., Lea, R. A., & Nagaraj, S. H. (2025) · European Journal of Human Genetics · doi:10.1038/s41431-025-01799-9
Predicting the Pathogenic Effects of Non-Synonymous Single Nucleotide Variants in Human Diseases
Nisamudheen, N. A., Balyan, P., Banu, A., Mohammed, F. K., Velayutham, D., Balyan, M. K., & Jithesh, P. V. (2025) · Elsevier eBooks · doi:10.1016/b978-0-323-95502-7.00291-8
Herkenhoff, M. E. (2025) · Genetics. · doi:10.5772/intechopen.1009878
Assembling unmapped reads reveals hidden variation in South Asian genomes
Das, A., Biddanda, A., McCoy, R. C., & Schatz, M. C. (2026) · Nature Communications · doi:10.1038/s41467-026-71755-8
Learning sequence to predict gain- or loss-of-function variantsPreprint
Ha, D., Kim, S.-N., Kwon, K., Chung, W., & Han, J. (2025) · Research Square · doi:10.21203/rs.3.rs-6705195/v1
Zanders, E. D. (2025) · Springer eBooks · doi:10.1007/978-3-031-93949-5_5
Enhancer Poising Enables Pathogenic Gene Activation by Noncoding VariantsPreprint
Hollingsworth, E. W., Chen, Z., Chen, C. X., Jacinto, S. H., Liu, T. A., & Kvon, E. Z. (2025) · bioRxiv (Cold Spring Harbor Laboratory) · doi:10.1101/2025.06.20.660819 · Cited by 1
Sørensen, D. (2025) · Statistics for biology and health · doi:10.1007/978-3-031-86274-8_1
Azidane, S., Eizaguerri, S., Gallego, X., Durham, L., Güney, E., & Pérez‐Cano, L. (2025) · International Journal of Molecular Sciences · doi:10.3390/ijms26157062
Jamilah, R. W., Andrianto, D., Pratama, R., Budhyanto, V. S. W., & Pudjas, N. T. G. (2025) · BIO Web of Conferences · doi:10.1051/bioconf/202518401017
Systematic Evaluation of Somatic Contamination in Germline GenomesPreprint
Ji, X., Bai, X., He, G. Q., Yan, K., Wang, E., Tang, Y., Chen, L., & Cui, Q. (2025) · bioRxiv (Cold Spring Harbor Laboratory) · doi:10.1101/2025.08.21.671542
Multifocal Genomic Reconstruction Leading to Germline Structural Variants
Hattori, A., & Fukami, M. (2025) · Methods in molecular biology · doi:10.1007/978-1-0716-4750-9_30
Chen, H., Liu, Z., Du, H., Zheng, M., Wan, Z., Zhao, N., Li, G., Bai, X., Wu, D., & Mi, J. (2025) · BMJ Open Gastroenterology · doi:10.1136/bmjgast-2025-001976
Loss-of-function Variants in CPT1C : No Support for a Causal Role in Hereditary Spastic ParaplegiaPreprint
Zhu, R., Liu, L., Estiar, M. A., Asayesh, F., Ahmad, J., Teferra, M., Yoon, G., Tarnopolsky, M. A., Boycott, K. M., Dupré, N., et al. (2025) · medRxiv · doi:10.1101/2025.09.18.25335173
Peng, W., Zhang, L., Tang, B., Liang, J., Liu, Z., Ye, L., Yuan, Y., Wang, Y., Tan, R., Lin, N., et al. (2025) · Genome biology · doi:10.1186/s13059-025-03730-3
gAIRR-wgs: An Algorithm to Genotype T Cell Receptor Alleles Using Whole Genome Sequencing DataPreprint
Huang, K.-T., Yang, Y.-H., Lin, M.-J., Lai, S.-K., Chou, T.-H., Lee, C.-Y., Hung, T.-K., Hsu, C., Yang, Y., Chen, C., et al. (2025) · bioRxiv (Cold Spring Harbor Laboratory) · doi:10.1101/2025.10.11.681280
Cheng, S., Kim, A., Deshpande, D., & Gazal, S. (2025) · medRxiv · doi:10.1101/2025.10.23.25338598
Rhodes, J. A., Bitter, M. C., Berardi, S., Beltz, J., Petrov, D. A., & Schmidt, P. (2025) · bioRxiv (Cold Spring Harbor Laboratory) · doi:10.1101/2025.11.04.686622
Mantey, R., Hu, J., Touhidinia, M., Butt, T., Sidky, A. M., Sobhani, R., Estrada, S., Händler, K., Domenico, E. D., Beyer, M., et al. (2026) · Genome Medicine · doi:10.1186/s13073-026-01702-1
A deep learning framework for building INDEL mutation rate mapsPreprint
Deng, S., Song, H., & Li, C. (2025) · bioRxiv (Cold Spring Harbor Laboratory) · doi:10.1101/2025.11.18.689146
Loss‐of‐Function Variants in CPT1C : No Support for a Causal Role in Hereditary Spastic Paraplegia
Zhu, R., Liu, L., Estiar, M. A., Asayesh, F., Ahmad, J., Teferra, M., Yoon, G., Tarnopolsky, M. A., Boycott, K. M., Dupré, N., et al. (2025) · Movement Disorders · doi:10.1002/mds.70144
Scaling the PBWT for Long-Range Shared Ancestry Detection in Large Haplotype PanelsPreprint
Islam, U. I., Cozzi, D., Gagie, T., Varki, R., Colonna, V., Garrison, E. P., Bonizzoni, P., & Boucher, C. A. (2025) · bioRxiv (Cold Spring Harbor Laboratory) · doi:10.64898/2025.12.01.691644
Lee, S., KIM, J., & Ohn, J. H. (2023) · Figshare · doi:10.6084/m9.figshare.26655751
Wang, J., Wu, J., Sun, Q., Wu, Q., Li, Y., Duan, S., Yang, L., Wu, W., Wang, Z., Liu, Y., et al. (2024) · Figshare · doi:10.6084/m9.figshare.26596664
Lee, S., KIM, J., & Ohn, J. H. (2024) · Figshare · doi:10.6084/m9.figshare.26655772
Maio, S. D., Zöscher, P., Weißensteiner, H., Forer, L., Schachtl‐Riess, J. F., Amstler, S., Streiter, G., Pfurtscheller, C., Paulweber, B., Kronenberg, F., et al. (2024) · Figshare · doi:10.6084/m9.figshare.26739420
Maio, S. D., Zöscher, P., Weißensteiner, H., Forer, L., Schachtl‐Riess, J. F., Amstler, S., Streiter, G., Pfurtscheller, C., Paulweber, B., Kronenberg, F., et al. (2024) · Figshare · doi:10.6084/m9.figshare.26739417
Maio, S. D., Zöscher, P., Weißensteiner, H., Forer, L., Schachtl‐Riess, J. F., Amstler, S., Streiter, G., Pfurtscheller, C., Paulweber, B., Kronenberg, F., et al. (2024) · Figshare · doi:10.6084/m9.figshare.26739402
Wang, J., Wu, J., Sun, Q., Wu, Q., Li, Y., Duan, S., Yang, L., Wu, W., Wang, Z., Liu, Y., et al. (2024) · Figshare · doi:10.6084/m9.figshare.26596673
Lee, S., KIM, J., & Ohn, J. H. (2024) · Figshare · doi:10.6084/m9.figshare.26655763
Maio, S. D., Zöscher, P., Weißensteiner, H., Forer, L., Schachtl‐Riess, J. F., Amstler, S., Streiter, G., Pfurtscheller, C., Paulweber, B., Kronenberg, F., et al. (2024) · Figshare · doi:10.6084/m9.figshare.26739405
Wang, J., Wu, J., Sun, Q., Wu, Q., Li, Y., Duan, S., Yang, L., Wu, W., Wang, Z., Liu, Y., et al. (2024) · Figshare · doi:10.6084/m9.figshare.26596640
Lee, S., KIM, J., & Ohn, J. H. (2024) · Figshare · doi:10.6084/m9.figshare.26655760
Wang, J., Wu, J., Sun, Q., Wu, Q., Li, Y., Duan, S., Yang, L., Wu, W., Wang, Z., Liu, Y., et al. (2024) · Figshare · doi:10.6084/m9.figshare.26596637
Additional file 1 of A phenome-wide scan reveals convergence of common and rare variant associations
Zhou, D., Zhou, Y., Xu, Y., Meng, R., & Gamazon, E. R. (2024) · Figshare · doi:10.6084/m9.figshare.26646301
Additional file 1 of The spectrum of TP53 mutations in Rwandan patients with gastric cancer
Nzitakera, A., Surwumwe, J. B., Ndoricyimpaye, E. L., Uwamungu, S., Uwamariya, D., Manirakiza, F., Ndayisaba, M. C., Ntakirutimana, G., Seminega, B., Dusabejambo, V., et al. (2024) · Figshare · doi:10.6084/m9.figshare.25374782
Lee, S., KIM, J., & Ohn, J. H. (2024) · Figshare · doi:10.6084/m9.figshare.26655766
Maio, S. D., Zöscher, P., Weißensteiner, H., Forer, L., Schachtl‐Riess, J. F., Amstler, S., Streiter, G., Pfurtscheller, C., Paulweber, B., Kronenberg, F., et al. (2024) · Figshare · doi:10.6084/m9.figshare.26739408
Wang, J., Wu, J., Sun, Q., Wu, Q., Li, Y., Duan, S., Yang, L., Wu, W., Wang, Z., Liu, Y., et al. (2024) · Figshare · doi:10.6084/m9.figshare.26596655
Metadata
- Authors
- Halldorsson, B. V., Eggertsson, H. P., Moore, K. H. S., Hauswedell, H., Eiriksson, O., Ulfarsson, M. O., Palsson, G., Hardarson, M. T., Oddsson, A., Jensson, B. O., Kristmundsdottir, S., Sigurpalsdottir, B. D., Stefansson, O. A., Beyter, D., Holley, G., Tragante, V., Gylfason, A., Olason, P. I., Zink, F., Asgeirsdottir, M., Sverrisson, S. T., Sigurdsson, B., Gudjonsson, S. A., Sigurdsson, G. T., Halldorsson, G. H., Sveinbjornsson, G., Norland, K., Styrkarsdottir, U., Magnusdottir, D. N., Snorradottir, S., Kristinsson, K., Sobech, E., Jonsson, H., Geirsson, A. J., Olafsson, I., Jonsson, P., Pedersen, O. B., Erikstrup, C., Brunak, S., Ostrowski, S. R., DBDS Genetic Consortium, Andersen, S., Banasik, K., Burgdorf, K., Didriksen, M., Dinh, K. M., Erikstrup, C., Gudbjartsson, D., Hansen, T. F., Hjalgrim, H., Jemec, G., Jennum, P., Johansson, P. I., Larsen, M. A. H., Mikkelsen, S., Nielsen, K. R., Nyegaard, M., Ostrowski, S. R., Sækmose, S., Sørensen, E., Thorsteinsdottir, U., Brun, M. T., Ullum, H., Werge, T., Thorleifsson, G., Jonsson, F., Melsted, P., Jonsdottir, I., Rafnar, T., Holm, H., Stefansson, H., Saemundsdottir, J., Gudbjartsson, D. F., Magnusson, O. T., Masson, G., Thorsteinsdottir, U., Helgason, A., Jonsson, H., Sulem, P., & Stefansson, K.
- Affiliations
- deCODE Genetics (Iceland) (IS)
- Reykjavík University (IS)
- Zealand University Hospital Køge (DK)
- University of Copenhagen (DK)
- Copenhagen Business School (DK)
- Copenhagen University Hospital (DK)
- Aarhus University Hospital (DK)
- Statens Serum Institut (DK)
- Zealand University Hospital (DK)
- Aalborg University Hospital (DK)
- Aarhus University (DK)
- Odense University Hospital (DK)
- Sankt Hans Hospital (DK)
- ORCID
- Halldorsson, Bjarni V.
- Eggertsson, Hannes P.
- Moore, Kristjan H. S.
- Hauswedell, Hannes
- Eiriksson, Ogmundur
- Ulfarsson, Magnus O.
- Palsson, Gunnar
- Hardarson, Marteinn T.
- Oddsson, Asmundur
- Jensson, Brynjar O.
- Sigurpalsdottir, Brynja D.
- Stefansson, Olafur A.
- Beyter, Doruk
- Holley, Guillaume
- Tragante, Vinicius
- Gylfason, Arnaldur
- Olason, Pall I.
- Gudjonsson, Sigurjon A.
- Halldorsson, Gisli H.
- Styrkarsdottir, Unnur
- Pedersen, Ole Birger
- Brunak, Søren
- Banasik, Karina
- Burgdorf, Kristoffer
- Didriksen, Maria
- Dinh, Khoa Manh
- Hansen, Thomas Folkmann
- Hjalgrim, Henrik
- Jemec, Gregor
- Jennum, Poul
- Johansson, Pär Ingemar
- Mikkelsen, Susan
- Nielsen, Kasper Rene
- Nyegaard, Mette
- Sækmose, Susanne
- Sørensen, Erik
- Ullum, Henrik
- Werge, Thomas
- Jonsdottir, Ingileif
- Rafnar, Thorunn
- Holm, Hilma
- Gudbjartsson, Daniel F.
- Helgason, Agnar
- Jonsson, Hakon
- Sulem, Patrick
- Venue
- Nature
- Published
- 2022-07-20
- Volume
- 607
- Issue
- 7920
- Pages
- 732-740
- ISSN
- 0028-0836 (ISSN-L)
- 1476-4687
- PMC
- PMC9329122
- OpenAlex
- W4286005461
- Cited by
- 448
- References
- 113
- Citations by year
- 2026: 68 · 2025: 101 · 2024: 121 · 2023: 120 · 2022: 37
- FWCI
- 60.78
- Type
- journal article
- Language
- en
- Open access
- hybrid
- doi.org
- Locations
- Nature (publishedVersion, cc-by)
- bioRxiv (Cold Spring Harbor Laboratory) (acceptedVersion, cc-by-nd)
- PubMed Central (publishedVersion, cc-by)
- PubMed (publishedVersion)
- Research at the University of Copenhagen (University of Copenhagen) (publishedVersion, cc-by)
- VBN Forskningsportal (Aalborg Universitet) (acceptedVersion, other-oa)
- University of Southern Denmark Research Portal (University of Southern Denmark) (acceptedVersion, other-oa)
- Opin vísindi (Opin vísindi) (submittedVersion, cc-by-nc-sa)
- RePEc: Research Papers in Economics (submittedVersion)
- Opin vísindi (Opin vísindi) (submittedVersion, other-oa)
- CBS Research Portal (Copenhagen Business School) (submittedVersion, cc-by)
- Funders
- Amgen
- AstraZeneca
- GlaxoSmithKline
- Wellcome Trust
- Government of the United Kingdom
- UK Research and Innovation
- Medical Research Council (MC_PC_17228)
- Topics
- Life Sciences › Biochemistry, Genetics and Molecular Biology › Genetics › Genetic Associations and Epidemiology
- Life Sciences › Biochemistry, Genetics and Molecular Biology › Genetics › Genomics and Rare Diseases
- Life Sciences › Biochemistry, Genetics and Molecular Biology › Molecular Biology › Genomics and Phylogenetic Studies
- Keywords
- UK Biobank, whole genome sequencing, human genetic variation, single nucleotide polymorphisms, indels, structural variants, microsatellite markers, haplotype reference panel, genotype imputation, natural selection, sequence conservation, rare variants, trait association, phenotypic diversity
- MeSH terms
- Whole Genome Sequencing, Africa, Asia, Exons, United Kingdom, Haplotypes, Humans, Ireland, Genetic Variation, Cohort Studies, Genome, Human, Conserved Sequence, Biological Specimen Banks, Microsatellite Repeats, Polymorphism, Single Nucleotide, Genomics, Databases, Genetic, INDEL Mutation
About these checks
Registry, retraction, Cites and statistics results are computed, not judged, with one exception: a printed reference that no index lists is read once by a model before it counts as a citation error. Claims are extracted by a model and kept only when their quote appears verbatim in the text; each cited source is then checked, with a model’s help, for whether it says what the claim relies on. Those verdicts can be wrong — read the claim’s quote and the cited source before relying on one.
Statistics and arithmetic are recomputed, not judged.
Confidence bands are shown only for fields calibrated on our annotated test set. None is calibrated yet, so no band is shown.
What counts as a claim ›How we measure confidence ›How we check this ›
Are you an author, or do you see a problem with this page? Request a review
