

The DOI matches its Crossref record; 64 of the 67 references it cites were found in a registry or an index.
Teixobactin kills bacteria by a two-pronged attack on the cell envelope
Open accessAbstract
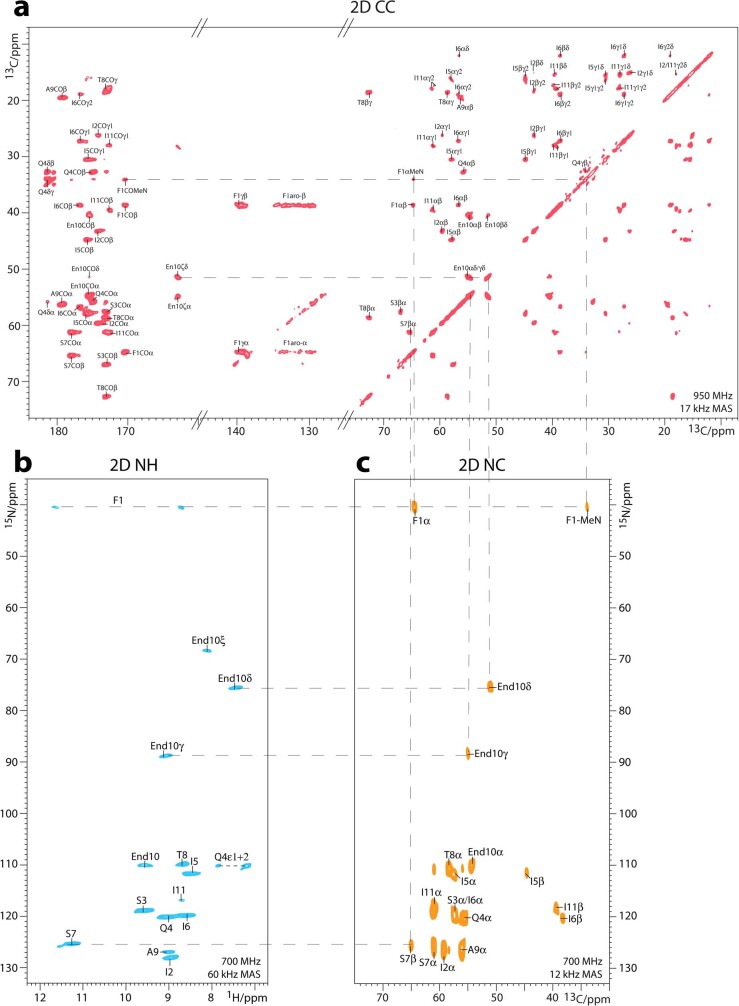
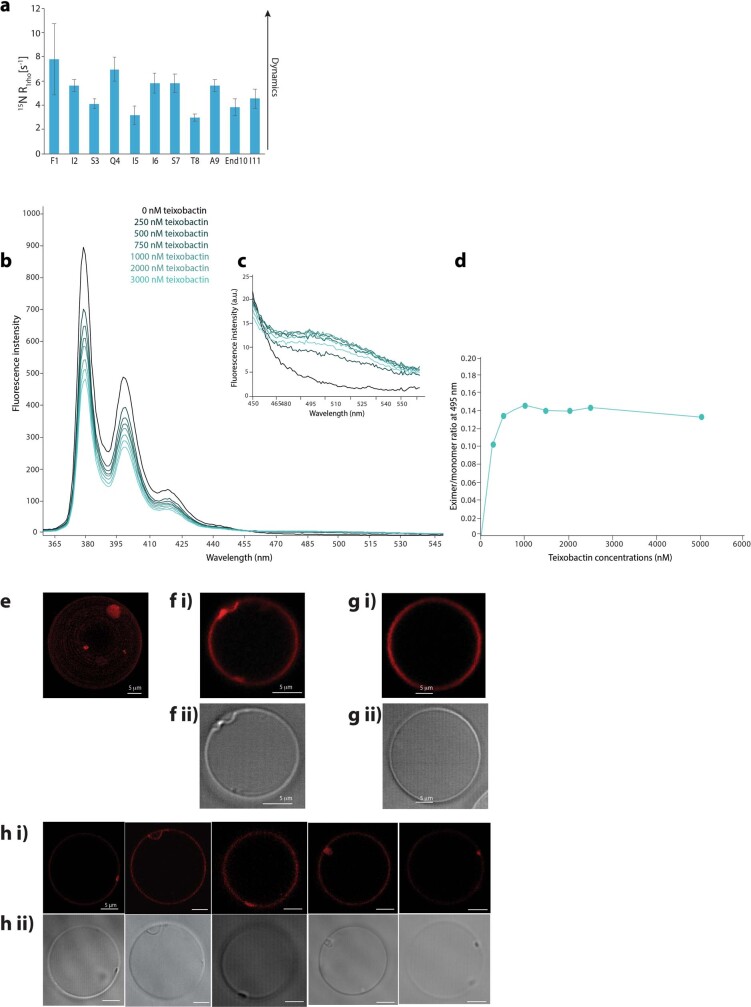
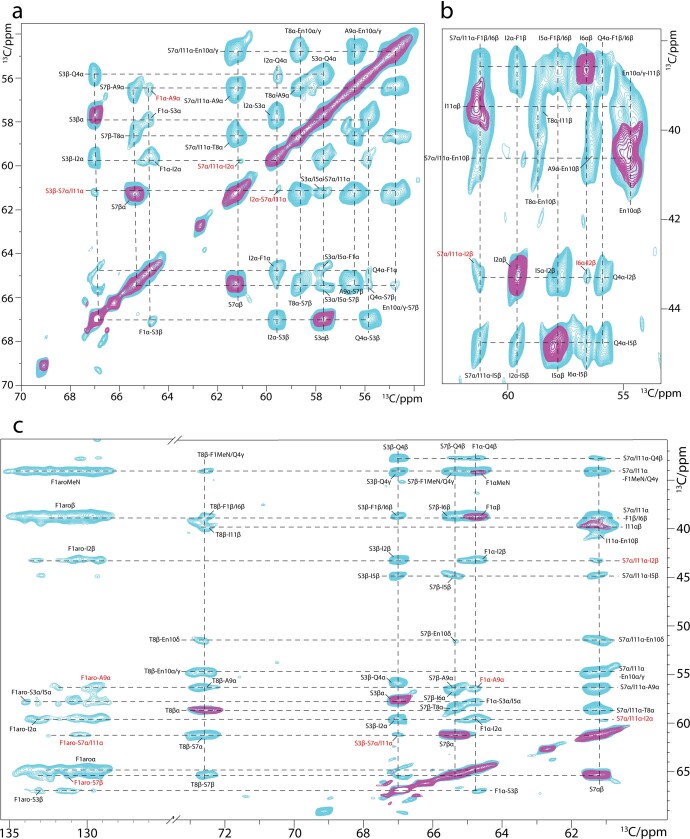
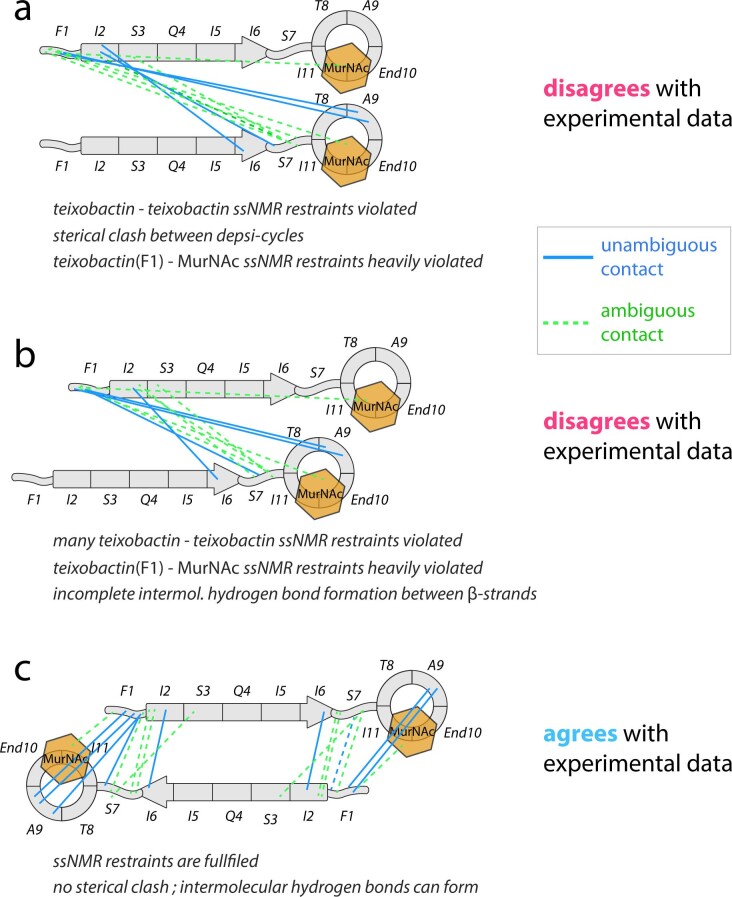
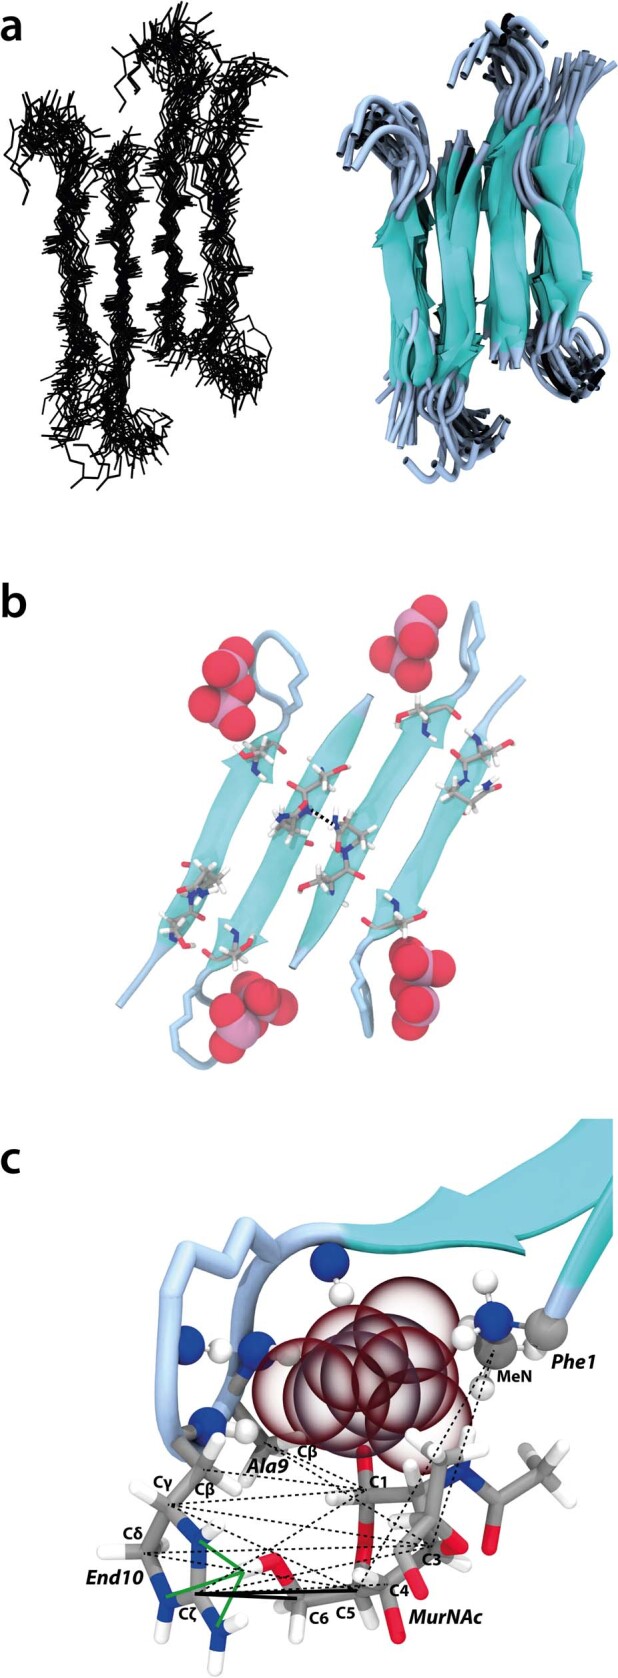
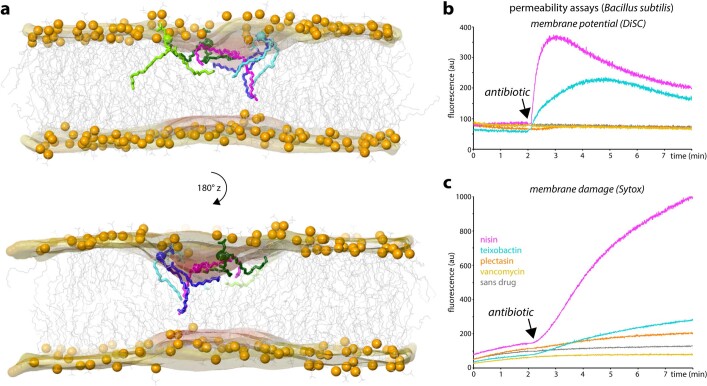
Antibiotics that use novel mechanisms are needed to combat antimicrobial resistance 1–3 . Teixobactin 4 represents a new class of antibiotics with a unique chemical scaffold and lack of detectable resistance. Teixobactin targets lipid II, a precursor of peptidoglycan 5 . Here we unravel the mechanism of teixobactin at the atomic level using a combination of solid-state NMR, microscopy, in vivo assays and molecular dynamics simulations. The unique enduracididine C-terminal headgroup of teixobactin specifically binds to the pyrophosphate-sugar moiety of lipid II, whereas the N terminus coordinates the pyrophosphate of another lipid II molecule. This configuration favours the formation of a β-sheet of teixobactins bound to the target, creating a supramolecular fibrillar structure. Specific binding to the conserved pyrophosphate-sugar moiety accounts for the lack of resistance to teixobactin 4 . The supramolecular structure compromises membrane integrity. Atomic force microscopy and molecular dynamics simulations show that the supramolecular structure displaces phospholipids, thinning the membrane. The long hydrophobic tails of lipid II concentrated within the supramolecular structure apparently contribute to membrane disruption. Teixobactin hijacks lipid II to help destroy the membrane. Known membrane-acting antibiotics also damage human cells, producing undesirable side effects. Teixobactin damages only membranes that contain lipid II, which is absent in eukaryotes, elegantly resolving the toxicity problem. The two-pronged action against cell wall synthesis and cytoplasmic membrane produces a highly effective compound targeting the bacterial cell envelope. Structural knowledge of the mechanism of teixobactin will enable the rational design of improved drug candidates.
Overview
The claims and statistics of this paper haven’t been checked yet.
Run the check — free, no account needed. It reads the open-access text and checks the sources it cites.
Integrity signals
Registry
Cites
Statistics
Figures
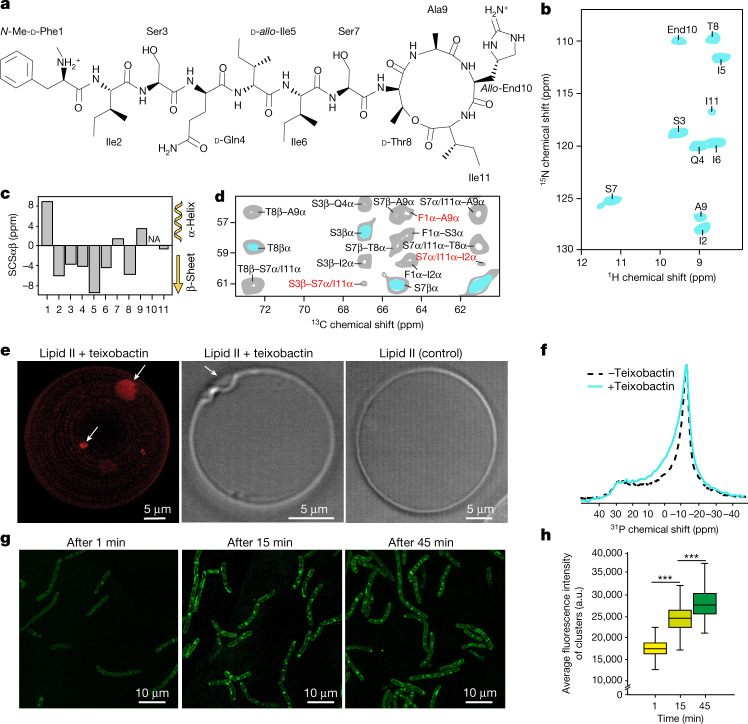
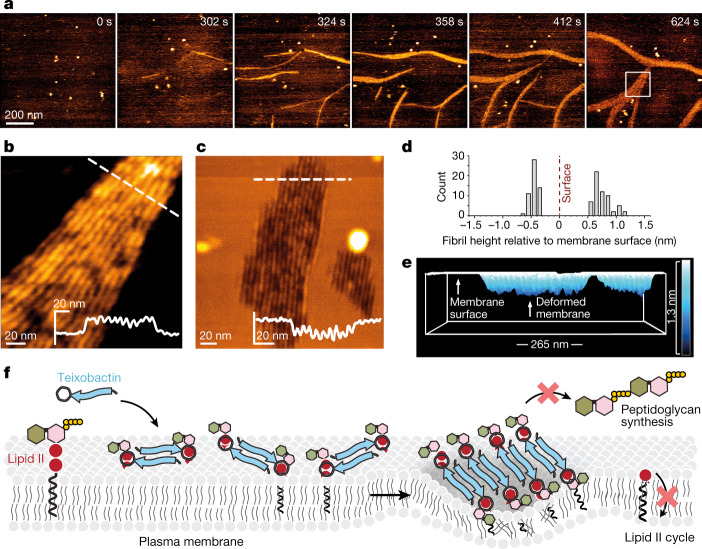
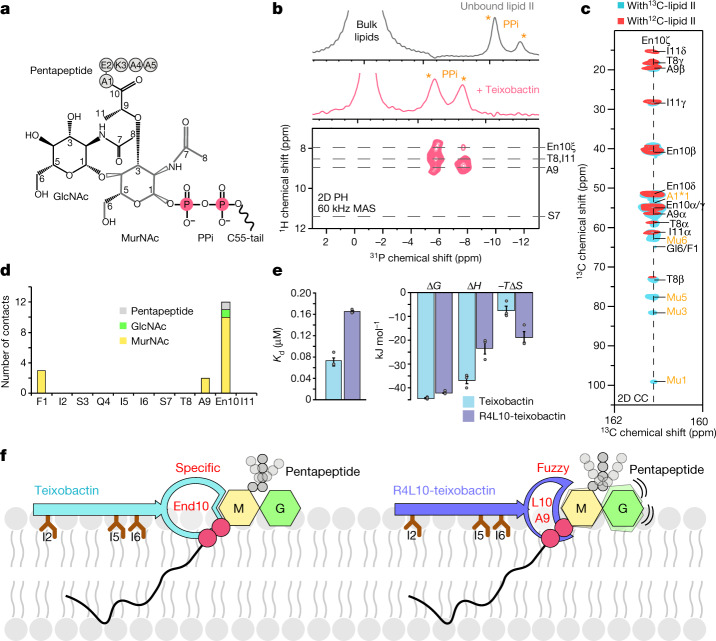
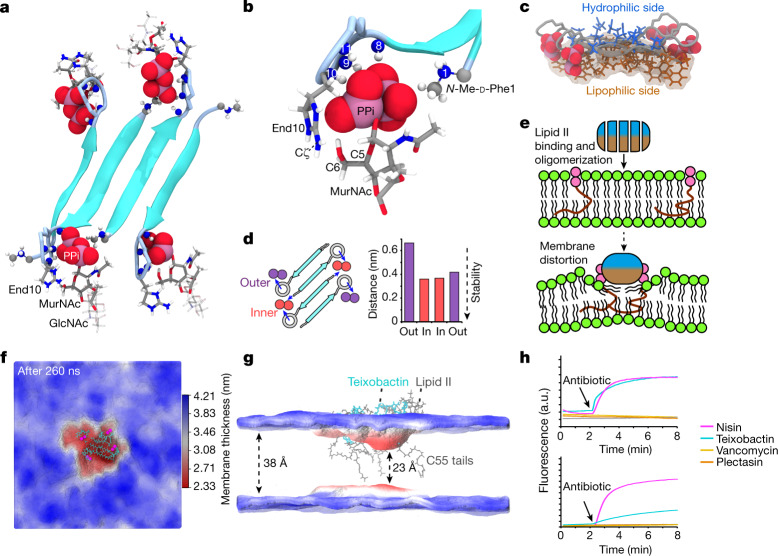
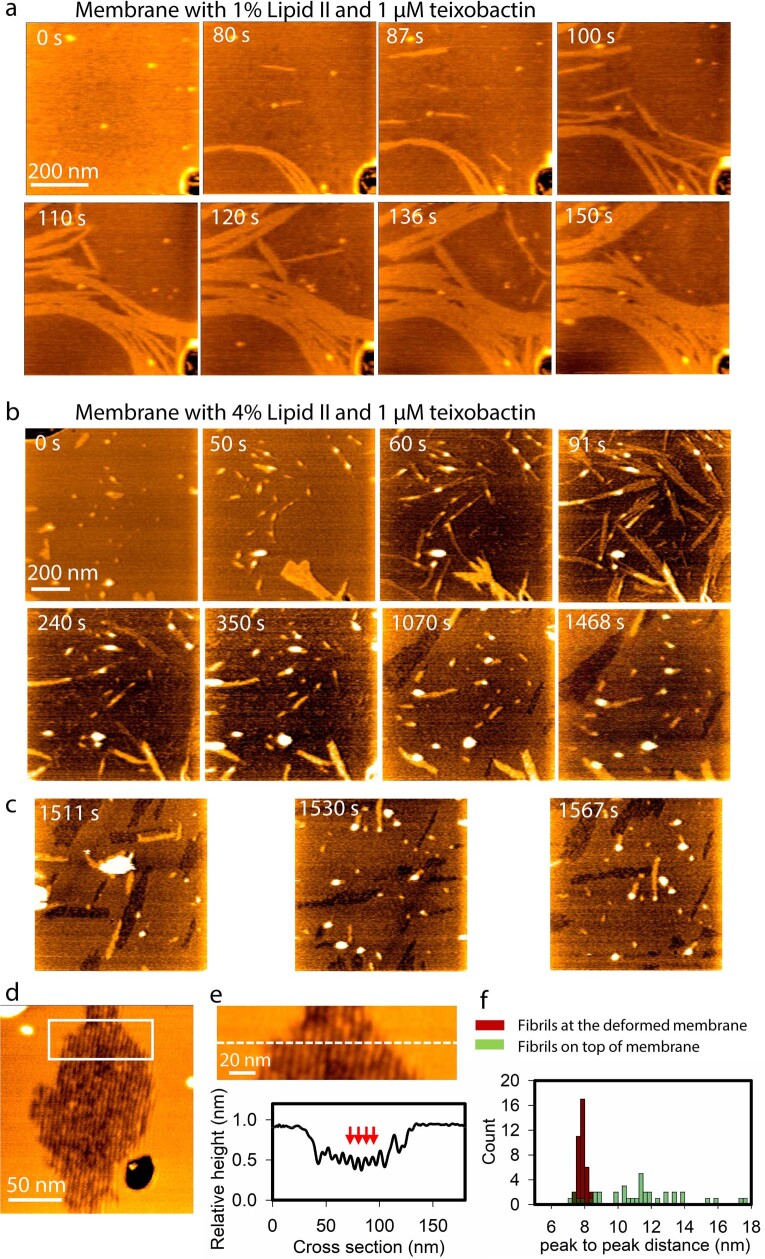
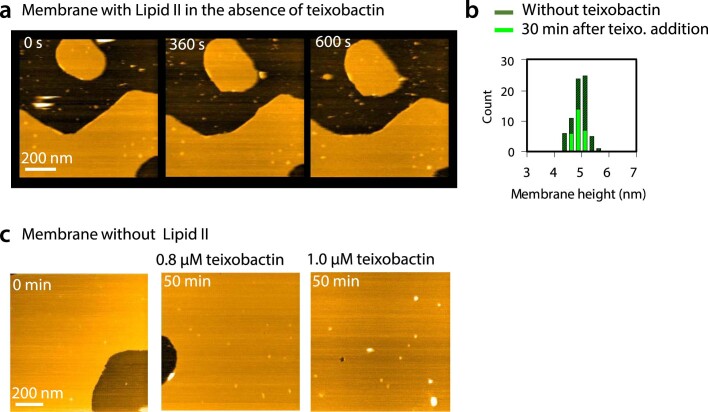
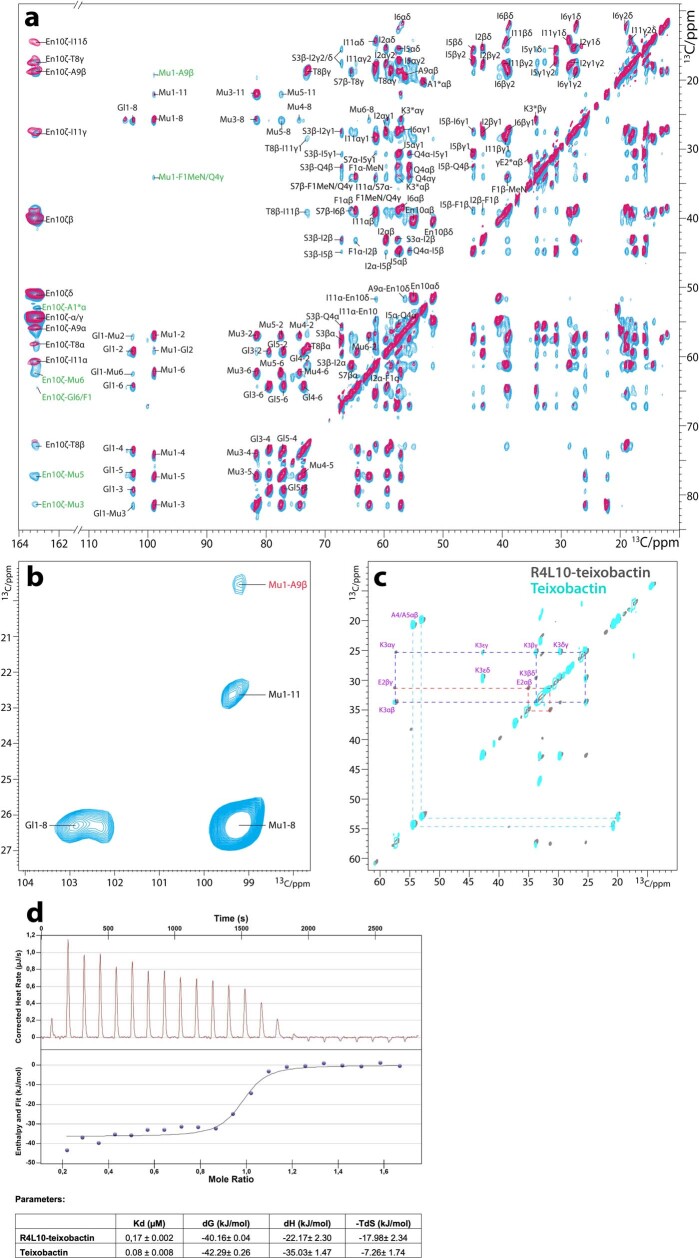
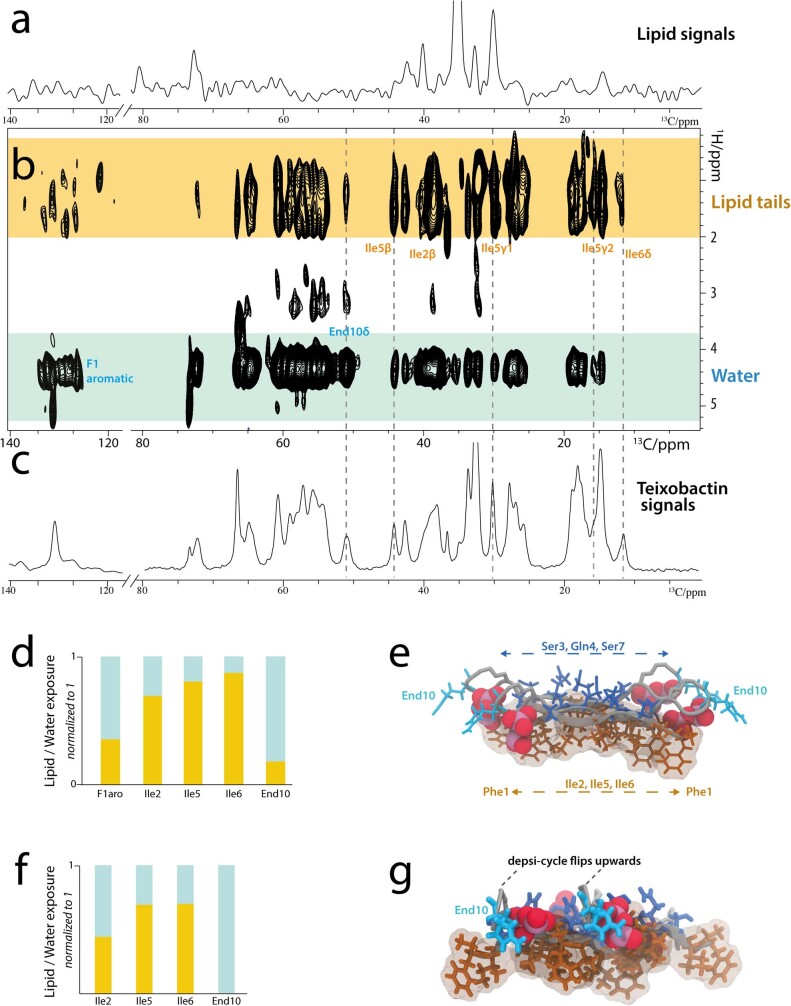
Verification
Claims the paper makes
The claims and statistics of this paper haven’t been checked yet.
Run the check — free, no account needed. It reads the open-access text and checks the sources it cites.
Claims other papers make about this one
Each is checked against this paper’s own text: does it say what the citing paper says it does?
The source backs part of the claim, not all of it — or backs it for a different population, condition or comparison.
In the citing paper
“Teixobactin exhibits a powerful inhibitory activity against S. aureus and Mycobacterium tuberculosis with no detectable resistance and acts through a unique mode of action.”
From Connecting metabolome and phenotype: recent advances in functional metabolomics tools for the identification of bioactive natural products (2024) · cites this paper as [50]
Experimental — accuracy not yet measured
Self-check
Percentages, sums and reported differences re-computed from the paper’s own numbers.
The self-check needs the paper’s full text.
Citations
Cites
Polymorphic transitions in single crystals: A new molecular dynamics method
Parrinello, M., & Rahman, A. (1981) · Journal of Applied Physics · doi:10.1063/1.328693 · Cited by 20,009
Rouser, G., Fleischer, S., & Yamamoto, A. (1970) · Lipids · doi:10.1007/bf02531316 · Cited by 3,280
Cassini, A., Högberg, L. D., Plachouras, D., Quattrocchi, A., Hoxha, A., Simonsen, G. S., Colomb-Cotinat, M., Kretzschmar, M., Devleesschauwer, B., Cecchini, M., et al. (2018) · The Lancet Infectious Diseases · doi:10.1016/s1473-3099(18)30605-4 · Cited by 2,951
The HADDOCK2.2 Web Server: User-Friendly Integrative Modeling of Biomolecular Complexes
van Zundert, G. C. P., Rodrigues, J. P. G. L. M., Trellet, M., Schmitz, C., Kastritis, P. L., Karaca, E., Melquiond, A. S. J., van Dijk, M., de Vries, S. J., & Bonvin, A. M. J. J. (2016) · Journal of Molecular Biology · doi:10.1016/j.jmb.2015.09.014 · Cited by 2,785
Self-citationDefinition and testing of the GROMOS force-field versions 54A7 and 54B7
Schmid, N., Eichenberger, A. P., Choutko, A., Riniker, S., Winger, M., Mark, A. E., & van Gunsteren, W. F. (2011) · European Biophysics Journal · doi:10.1007/s00249-011-0700-9 · Cited by 2,535
A new antibiotic kills pathogens without detectable resistance
Ling, L. L., Schneider, T., Peoples, A. J., Spoering, A. L., Engels, I., Conlon, B. P., Müller, A., Schäberle, T. F., Hughes, D. E., Epstein, S. S., et al. (2015) · Nature · doi:10.1038/nature14098 · Cited by 2,428
Self-citationAntibacterial drug discovery in the resistance era
Brown, E. D., & Wright, G. D. (2016) · Nature · doi:10.1038/nature17042 · Cited by 2,315
An Automated Force Field Topology Builder (ATB) and Repository: Version 1.0
Malde, A. K., Zuo, L., Breeze, M., Stroet, M., Poger, D., Nair, P. C., Oostenbrink, C., & Mark, A. E. (2011) · Journal of Chemical Theory and Computation · doi:10.1021/ct200196m · Cited by 1,897
Lewis, K. (2010) · Annual Review of Microbiology · doi:10.1146/annurev.micro.112408.134306 · Cited by 1,858
Self-citationIcy: an open bioimage informatics platform for extended reproducible research
de Chaumont, F., Dallongeville, S., Chenouard, N., Hervé, N., Pop, S., Provoost, T., Meas‐Yedid, V., Pankajakshan, P., Lecomte, T., Montagner, Y. L., et al. (2012) · Nature Methods · doi:10.1038/nmeth.2075 · Cited by 1,538
Research works printed but not linked: 1
- O’Neill, J. Antimicrobial resistance: tackling a crisis for the health and wealth of nations. jpiamr http://www.jpiamr.eu/wpcontent/uploads/2014/12/AMR-Review-Paper-Tackling-a-crisis-for-the-health-and-wealth-of-nations_1-2.pdf (2014).
Cited by
Sorted by citations
Items 101–200 of 201
Mining Microbial Dark Matter: Advanced Cultivation Techniques for Bioactive Compound Discovery
Ji, M., Ma, B., Dong, J., Liu, S., Shi, Y., Bu, M., Wang, L., & Liu, L. (2025) · Pharmaceuticals · doi:10.3390/ph18101583 · Cited by 6
Multi-arming ourselves against drug-resistant bacteria
Raherisoanjato, J., & Henke, M. T. (2023) · Cell Host & Microbe · doi:10.1016/j.chom.2023.06.011 · Cited by 6
A new antibiotic from an uncultured bacterium binds to an immutable targetPreprint
Shukla, R., Peoples, A. J., Ludwig, K. C., Maity, S., Derks, M. G. N., Benedetti, S. D., Krueger, A. M., Vermeulen, B. J. A., Lavore, F., Honorato, R. V., et al. (2023) · bioRxiv (Cold Spring Harbor Laboratory) · doi:10.1101/2023.05.15.540765 · Cited by 6
Self-citationHarnessing advances in mechanisms, detection, and strategies to combat antimicrobial resistance
Thakur, R., Aggarwal, K., Sood, N., Kumar, A., Joshi, S., Jindal, P., Maurya, R., Patel, P., & Kurmi, B. D. (2025) · The Science of The Total Environment · doi:10.1016/j.scitotenv.2025.179641 · Cited by 5
Enzymatic Mannich Reaction for the Synthesis of γ-Chiral Amino-Substituted α-Amino Acids
Wang, L., Zhang, D., Yin, K., Wu, G., Duan, X., Yang, C., Ma, L., Chen, X., & Xu, J. F. (2026) · ACS Catalysis · doi:10.1021/acscatal.5c07217 · Cited by 5
Joseph, B. (2024) · ChemBioChem · doi:10.1002/cbic.202400858 · Cited by 5
De novo evolution of antibiotic resistance to Oct-TriA1
Chowdhury, F. R., Mercado, L. D., Kharitonov, K., & Findlay, B. (2025) · Microbiological Research · doi:10.1016/j.micres.2025.128056 · Cited by 5
Nano-Scale Video Imaging of Motility Machinery by High-Speed Atomic Force Microscopy
McArthur, S. J., Umeda, K., & Kodera, N. (2025) · Biomolecules · doi:10.3390/biom15020257 · Cited by 6
Malkawi, E., Parmar, A., Das, S. K., Newire, E., Jones, C. M., Morrison, K. A., Karak, M., Blanc, F., Harper, N., Lakshminarayanan, R., et al. (2025) · Journal of Medicinal Chemistry · doi:10.1021/acs.jmedchem.5c01193 · Cited by 5
Self-citationVisualizing Molecular Dynamics by High-Speed Atomic Force Microscopy
van Ewijk, C., Maity, S., & Roos, W. H. (2023) · Methods in molecular biology · doi:10.1007/978-1-0716-3377-9_17 · Cited by 5
Self-citationInvestigation of Isobactin Analogues of Teixobactin
Jones, C. R., Lai, G. H., Padilla, M. S. T. L., & Nowick, J. S. (2024) · ACS Medicinal Chemistry Letters · doi:10.1021/acsmedchemlett.4c00215 · Cited by 5
Self-citationBacteriocinogenic Lactic Acid Bacteria and Antibacterial Mechanisms
Gu, Q. (2023) · Springer eBooks · doi:10.1007/978-981-99-2661-9_3 · Cited by 5
Anatolevich, K. I., Huster, D., & Scheidt, H. A. (2025) · Biophysical Reviews · doi:10.1007/s12551-025-01335-5 · Cited by 4
Mechanics of membrane targeting antimicrobials - Pore nucleation in bacterial membranes
Zou, G., Kim, W., & Gao, H. (2024) · Mechanics of Materials · doi:10.1016/j.mechmat.2024.104991 · Cited by 4
Xiao, X., Huang, Y., Liu, W., Liu, Y., Zhang, H., Meng, C., & Wang, Z. (2025) · Phytotherapy Research · doi:10.1002/ptr.8427 · Cited by 4
Redha, M. A., Sweih, N. A., & Albert, M. J. (2023) · Microorganisms · doi:10.3390/microorganisms11102610 · Cited by 4
Targeting the Plasmodium falciparum UCHL3 ubiquitin hydrolase using chemically constrained peptides
King, H. R., Bycroft, M., Nguyen, T., Kelly, G. P., Vinogradov, A. A., Rowling, P. J. E., Stott, K. M., Ascher, D. B., Suga, H., Itzhaki, L. S., et al. (2024) · Proceedings of the National Academy of Sciences · doi:10.1073/pnas.2322923121 · Cited by 4
Gillane, R., Daygon, V. D., Khalil, Z. G., & Marcellin, E. (2024) · Frontiers in Bioengineering and Biotechnology · doi:10.3389/fbioe.2024.1468974 · Cited by 4
Harmon, T. W., Song, J., Gulewicz, A. J., Di, Y. P., & Horne, W. S. (2024) · ChemBioChem · doi:10.1002/cbic.202400951 · Cited by 4
Antibiotic resistance and a dire need for novel and innovative therapies: The impending crisis
Bhaskar, P. (2023) · doi:10.52679/syncytia.2023.0w8yx9 · Cited by 4
Geministatins: new depside antibiotics from the fungus Austroacremonium gemini
Crombie, A., Kalaitzis, J. A., Chen, R., Vuong, D., Lacey, A. E., Lacey, E., Shivas, R. G., Tan, Y. P., Sbaraini, N., Chooi, Y., et al. (2024) · The Journal of Antibiotics · doi:10.1038/s41429-024-00755-x · Cited by 4
Omics-Based Approaches in Developing Treatments Against Antimicrobial Resistance
Wang, Z., Xie, W., Luo, D., Wang, L., Xu, Y., Rosenn, E. H., & Soni, V. (2024) · Springer eBooks · doi:10.1007/978-3-031-65986-7_12 · Cited by 4
Synthetic Strategies and Biological Activities of Teixobactin and its Analogs: A Review
Kumari, D., & Nagendra, G. (2025) · Current Topics in Medicinal Chemistry · doi:10.2174/0115680266344835241125074030 · Cited by 3
Liu, J., Ma, J., Pei, S., Bao, S., Hao, H., Bi, J., Hou, H., & Zhang, G. (2025) · LWT · doi:10.1016/j.lwt.2025.118433 · Cited by 3
Chang, T., Chen, Z., Sheng, L., Bian, X., He, P., He, X., Liu, S.-H., Zhang, J., Ren, H., Zhang, J., et al. (2025) · Journal of the American Chemical Society · doi:10.1021/jacs.5c14268 · Cited by 3
Guo, W., Zhao, Y., Yang, Y., Li, W., Wang, K., Zhou, F., Li, J., Li, X., Zhang, Y., Hu, B., et al. (2025) · BMC Microbiology · doi:10.1186/s12866-025-04475-6 · Cited by 5
High-speed atomic force microscopy of membrane and membrane protein dynamics
Alshammari, A. S. H., Mahamed, B., & Heath, G. R. (2026) · Current Opinion in Structural Biology · doi:10.1016/j.sbi.2026.103294 · Cited by 3
Chen, M., Li, Y., Huang, Y., Wang, J., Wang, Y., Yan, F., Guo, W., & Wang, X. (2025) · ACS Omega · doi:10.1021/acsomega.5c01228 · Cited by 3
Self-citationTransforming solid-state nuclear magnetic resonance towards a chemistry-ready technique
Coulon, R., Gajan, D., Papawassiliou, W., Pell, A. J., Schlagnitweit, J., Fayon, F., Florian, P., Dominique Massiot, A., Afrough, A., Juhl, D. W., et al. (2025) · Solid State Nuclear Magnetic Resonance · doi:10.1016/j.ssnmr.2025.102048 · Cited by 3
Self-citationSelective Membrane Remodeling and Fluidity Reduction by the Cationic Helical Peptide L10-MMBen
Xu, C., Ma, C., Zhang, Y., Zhang, W., Zhang, J., Li, G., Xiong, M., Wei, Y., Yang, K., & Yuan, B. (2025) · The Journal of Physical Chemistry Letters · doi:10.1021/acs.jpclett.5c00451 · Cited by 3
He, C., Jing, X., Liu, B., Liu, F., & Jin, K. (2025) · ACS Infectious Diseases · doi:10.1021/acsinfecdis.5c00458 · Cited by 2
Yang, Y., He, F.-J., Xie, S.-Y., Luo, X.-W., & Wang, X. (2025) · European Journal of Medicinal Chemistry · doi:10.1016/j.ejmech.2025.118119 · Cited by 2
Self-citationZHANG, B., Yimin, F. U., Zheng, C. H. E. N., Ao, S. H. I., & Min, Z. H. U. (2025) · Journal of Inorganic Materials · doi:10.15541/jim20250030 · Cited by 2
Lourenço, A. L. P., el Khatab, O. R., Falciani, C., Pini, A., Aragón, V., Cerdà‐Cuéllar, M., & Kochanowski, K. (2026) · Microbiology Spectrum · doi:10.1128/spectrum.03918-25 · Cited by 2
Molecular action of NZ2114, a superior plectasin derivative
Derks, M. G. N., Jekhmane, S., Maity, S., Charitou, V., Slingerland, C. J., Vermeer, B., van der Weijde, M., Ntallis, C., Martin, N. I., Roos, W. H., et al. (2026) · npj Antimicrobials and Resistance · doi:10.1038/s44259-026-00196-6 · Cited by 2
Self-citationAusbacher, D., Miller, L. A., Goeres, D. M., Stewart, P. S., Strøm, M. B., & Fallarero, A. (2023) · Biofilm · doi:10.1016/j.bioflm.2023.100151 · Cited by 2
Li, X., Wu, M., & Shuai, J. (2023) · 中国科学通报:英文版 · doi:10.1016/j.scib.2023.12.047 · Cited by 2
Supramolecular Interactions of Teixobactin Analogues in the Crystal State
Yang, H., Kreutzer, A. G., & Nowick, J. S. (2024) · The Journal of Organic Chemistry · doi:10.1021/acs.joc.3c02617 · Cited by 2
Self-citationDesign, synthesis and biological evaluation of Leu10-teixobactin analogues
Fan, Y., Chen, J., Chen, B., Bai, J., Yang, B., Liang, F., & Fang, L. (2024) · Chinese Chemical Letters · doi:10.1016/j.cclet.2024.110075 · Cited by 2
Technological developments driving industrial natural product discovery
Lewis, R., Hammond, R., Wilkinson, M., & Allenby, N. (2025) · Natural Product Reports · doi:10.1039/d4np00072b · Cited by 2
Wang, X., Hu, S., Fu, Y., Xie, W., Li, G., Kong, D., & Wang, X. (2025) · Biomaterials Science · doi:10.1039/d5bm00879d · Cited by 2
Self-citationDrug Design: Do Not Forget the Supramolecular Factor
Regen, S. L. (2024) · Biochemistry · doi:10.1021/acs.biochem.3c00721 · Cited by 2
Rose, F. O. T., Darnell, R. L., Morris, S. M., Paxie, O., Campbell, G., Cook, G. M., & Gebhard, S. (2022) · bioRxiv (Cold Spring Harbor Laboratory) · doi:10.1101/2022.12.05.519242 · Cited by 2
Solid-State Nmr 13c Sensitivity at High Magnetic FieldPreprint
Rienstra, C. M., Han, R., Borcik, C. G., Wang, S., Warmuth, O. A., Geohring, K., Mullen, C. G., Incitti, M., & Stringer, J. A. (2023) · SSRN Electronic Journal · doi:10.2139/ssrn.4603435 · Cited by 2
Teixobactin “Swapmers” with l Tail Stereochemistry Retain Antibiotic Activity
Griffin, J. H., Mendoza, A.-T., & Nowick, J. S. (2024) · The Journal of Organic Chemistry · doi:10.1021/acs.joc.4c01674 · Cited by 1
Self-citationHu, S., Li, J., Zhang, J., & Shi, C. (2025) · Journal of the American Chemical Society · doi:10.1021/jacs.5c09134 · Cited by 1
Gao, W., Zhang, Z., Yu, H., Li, X., Quan, C., Xue, Y., & Zhao, P. (2025) · Journal of Microbiology and Biotechnology · doi:10.4014/jmb.2503.02030 · Cited by 1
Shimoda, S., Sugiyama, A., Onishi, M., Tsugami, Y., Nagasawa, Y., Tobe, R., & Hiroshi Yoneyama, C. (2025) · Microbiology · doi:10.1099/mic.0.001589 · Cited by 1
Hijacking the Electron Train: Menaquinone‐Binding Antimicrobial Peptides
Matheson, E. J., & Cochrane, S. A. (2025) · ChemBioChem · doi:10.1002/cbic.202500478 · Cited by 1
Fhatonah, N., Rustandi, T., Abdelmohsen, U. R., Rasydy, L. O. A., Ma'sum, M., Elghanam, Y., Pashar, I., Nordin, Mahal, A., & Riski, A. (2025) · Frontiers in Pharmacology · doi:10.3389/fphar.2025.1694322 · Cited by 1
Darnell, R. L., Knottenbelt, M. K., Rose, O. E., Cleary, C. S. B., Rose, F. O. T., Hodgkinson, H., Wu, Y., Hussein, M. H., Velkov, T., Gebhard, S., et al. (2025) · Antimicrobial Agents and Chemotherapy · doi:10.1128/aac.00629-25 · Cited by 1
Impact of shared facilities in advancing solid-state NMR research: 2025 edition.
Schurko, R., Rienstra, C. M., Jaroniec, C., Hansen, A. L., Franks, W., Bryce, D. L., Brinkmann, A., Terskikh, V., Brown, S. P., Iuga, D., et al. (2025) · Solid State Nuclear Magnetic Resonance · doi:10.1016/j.ssnmr.2025.102053 · Cited by 1
Self-citationJorgenson, M. A. (2025) · Journal of Bacteriology · doi:10.1128/jb.00451-25 · Cited by 1
Baravkar, S., Thombare, V. J., Wu, Y., & Patil, N. A. (2026) · Frontiers in Chemistry · doi:10.3389/fchem.2026.1790990 · Cited by 1
Discovery of novel antimicrobials within microbiomes
Weisberg, E., Friedman, A., de la Fuente‐Núñez, C., & Levy, A. (2026) · Current Opinion in Microbiology · doi:10.1016/j.mib.2026.102781 · Cited by 2
Dai, J., Xue, S., Bai, M., Chiu, T., Aziz, T. A., Al‐Asmari, F., Jalal, R. S., Cui, H., & Lin, L. (2026) · Food Bioscience · doi:10.1016/j.fbio.2026.109422 · Cited by 1
Synthetic drug kills fungi but spares kidney cells
(2023) · Nature · doi:10.1038/d41586-023-03358-y · Cited by 1
Chimie des substances naturelles et pharmacie : à la croisée des chemins
Beniddir, M. A., & Poupon, E. (2024) · Comptes Rendus Chimie · doi:10.5802/crchim.275 · Cited by 1
Chen, L., Lai, I.-L., Murugan, K., & Shyu, D. J. H. (2024) · Elsevier eBooks · doi:10.1016/b978-0-443-15508-6.00011-7 · Cited by 1
Saad, A., Jiang, J.-Q., Raya, J., & Bechinger, B. (2025) · Biomacromolecules · doi:10.1021/acs.biomac.5c00554 · Cited by 1
Campoccia, D., Donno, A. D., Bottau, G., Bua, G., Ravaioli, S., Capponi, E., Sotgiu, G., Pegreffi, F., Costantini, S., & Arciola, C. R. (2025) · International Journal of Molecular Sciences · doi:10.3390/ijms26167745 · Cited by 1
A Resistance-Evading Antibiotic for Treating AnthraxPreprint
Hughes, D. E., Lawrence, W. S., Peel, J. L., de Winter, R., Ling, L. L., Niiti, N., Peoples, A. J., Shukla, R., MacGillavry, H. D., Heine, H. S., et al. (2024) · Research Square · doi:10.21203/rs.3.rs-3991430/v1 · Cited by 1
Self-citationSilver, L. L. (2024) · doi:10.1002/9781394182862.ch10 · Cited by 1
Melcrová, A., Woudstra, W., Wenzel, M., Gabler, M., Stensen, W., Svendsen, J. S. M., Roos, W. H., & Schirhagl, R. (2025) · bioRxiv (Cold Spring Harbor Laboratory) · doi:10.1101/2025.10.27.684379 · Cited by 1
Self-citationBacteria, Viruses, and the Microbiome
Anisman, H., Hayley, S. P., & Kusnecov, A. W. (2024) · Elsevier eBooks · doi:10.1016/b978-0-443-23565-8.00020-x
Stekovic, B., Anderson, K., Lancaster, D., Stuck, E., Getachew, T., Venugopal, M., & Dingmann, B. J. (2023) · Current Clinical Microbiology Reports · doi:10.1007/s40588-023-00209-2
Illuminating assembly dynamics regulating short-range order optics in extremely long-lived proteins
Bergman, M. R. (2023) · Digital Repository Service (Northeastern University) · doi:10.17760/d20486926
Membrane Effects of Antimicrobial Peptides
Wang, X. (2023) · doi:10.33540/2009
Self-citationLosung, F., Ginting, E. L., Abdjul, D. B., Kapojos, M. M., Maarisit, W., Mentang, F., Sumilat, D. A., Balansa, W., & Mangindaan, R. E. P. (2023) · Biodiversitas Journal of Biological Diversity · doi:10.13057/biodiv/d241212
Kumar, R., Breukink, E. J., & Weingarth, M. H. (2024) · ChemBioChem · doi:10.1002/cbic.202400543
Self-citation(2024) · Elsevier eBooks · doi:10.1016/b978-0-443-23565-8.09996-8
De novo evolution of antibiotic resistance to Oct-TriA 1Preprint
Chowdhury, F. R., Mercado, L. D., Kharitonov, K., & Findlay, B. (2024) · bioRxiv (Cold Spring Harbor Laboratory) · doi:10.1101/2024.12.17.628969
Wang, H., Yao, M., Geng, M., Nan, S., Zhang, L., Zhang, W., & Nie, C. (2025) · Food Bioscience · doi:10.1016/j.fbio.2025.107234
Unmasking Conformationally Adaptable Lipids as Drug Receptors
Regen, S. L. (2025) · Journal of Medicinal Chemistry · doi:10.1021/acs.jmedchem.5c01035
Jafarinejad, S., Fida, M., & Najafzadeh, M. (2025) · Royal Society of Chemistry eBooks · doi:10.1039/9781837676989-00343
Alternative Approaches to Combat Antimicrobial Resistance and Improve Antimicrobial Efficacy
Fuad, F. A., & Zerin, T. (2025) · Journal of Preventive Diagnostic and Treatment Strategies in Medicine · doi:10.4103/jpdtsm.jpdtsm_90_25
Lipid Intermediates in Bacterial Peptidoglycan Biosynthesis
Barreteau, H., Bal, L. M., Blanot, D., Folcher, V., & Touzé, T. (2026) · Springer eBooks · doi:10.1007/978-3-319-43676-0_11-2
The SUF Machinery from Mycobacterium tuberculosis as a new target for anti-tubercular drugs
Elchennawi, I. (2024) · theses.fr (ABES) · doi:10.70675/10d8c735zda57z4935z8973z81c71d13f3cb
Kharrat, O. (2025) · theses.fr (ABES) · doi:10.70675/c47e5b02ze7d4z4d9cz9fd6z03e321b9669f
Biomimetic antimicrobial peptides capture and kill methicillin-resistant Staphylococcus aureus
Li, Y.-T., Tian-Ci-Wei, Yuan, J.-X., Yang, P.-P., Han, M., Feng, J.-Q., Shen, Y.-B., Wang, L., & Tang, S. (2026) · Results in Chemistry · doi:10.1016/j.rechem.2026.103344
Purssell, E. (2026) · Springer eBooks · doi:10.1007/978-3-032-03964-4_6
Case Study: Illuminating the Nanoscale World of Microbiology
Syed, P., Schembri, M. A., McCann, A. J., & Meunier, F. A. (2026) · Methods in molecular biology · doi:10.1007/978-1-0716-5268-8_14
Old antibiotics are being revived to fight new threats
Bourzac, K. (2026) · Nature · doi:10.1038/d41586-026-01379-x
Zhang, X., Ren, J., Gao, Q., Liu, J., Zhang, L., Li, S., Tang, Y., Ren, F., Jiao, X., & Huang, J. (2026) · Microbial Pathogenesis · doi:10.1016/j.micpath.2026.108570
Dual-target antibacterial agents: Bridging molecular relationships to synergistic mechanisms
Li, Y., Wang, S.-X., & Liang, J. (2026) · European Journal of Medicinal Chemistry · doi:10.1016/j.ejmech.2026.119004
ZHANG, Y., Zou, Y., & Yang, J. (2026) · Biochimica et Biophysica Acta (BBA) - Biomembranes · doi:10.1016/j.bbamem.2026.184554
Understanding the Role of Macrocycle Size and Amide Linkage in Teixobactin Analogues
Malkawi, R., Weldon-Bee, J., Kiptoo, E., Das, S. K., Chen, Y., Iyer, A., Lakshminarayanan, R., Zhang, Q., Parmar, A., & Singh, I. S. (2026) · Biomolecules · doi:10.3390/biom16070970
Zhang, H., Yi-dan, C., Xie, Y., Li, Y., Fan, X.-N., Diao, Q., Liang, Y.-J., He, L.-R., Zhong, Z.-X., Xia, L.-J., et al. (2026) · Virulence · doi:10.1080/21505594.2026.2707759
Xi, L., Bian, Q., Yang, P., Wu, H., Shi, X., Guo, B., Fan, Y., & Zhang, J. (2026) · Emerging Microbes & Infections · doi:10.1080/22221751.2026.2698241
Kumar, G., & Engle, K. (2026) · Bioorganic Chemistry · doi:10.1016/j.bioorg.2026.110343
Abdallah, E. M., Al-Mijalli, S. H., Hakawati, N. A., & Khatib, A. A. (2026) · Frontiers in Cellular and Infection Microbiology · doi:10.3389/fcimb.2026.1881716
The multifaceted role of atomic force microscopy in bacteriology
Borrelli, C., Douglas, E. J. A., Edwards, A. M., & Hoogenboom, B. W. (2026) · Trends in Microbiology · doi:10.1016/j.tim.2026.08.005
From Soil to Shelf: Teixobactin at Ten─Mechanism, SAR, and the Road to Clinical Application
Binette, R., Lacasse, E., Malouin, F., & Boudreault, P. (2026) · ACS Infectious Diseases · doi:10.1021/acsinfecdis.6c00389
Unlocking microbial dark matter: A biotechnology framework for replenishing the antibiotic pipeline
Hamed, A. A., & Khalil, Z. G. (2026) · Biotechnology Advances · doi:10.1016/j.biotechadv.2026.109054
NRPS megasynthases – the A to X of assembling peptide antibiotics
Jian, X., Hansen, M. H., Murray, L. A. M., & Cryle, M. J. (2026) · Natural Product Reports · doi:10.1039/d6np00070c
Trends in optimizing antibacterial cationic amphiphiles
Olaosebikan, O. J., Babalola, J. O., & Urner, L. H. (2026) · Biological Chemistry · doi:10.1515/hsz-2026-0159
Jiang, Y., Mo, S., Zhao, Y., Guo, X., Li, Y., Xia, K., Peng, X., Li, C., Zhao, Y., 王鑫彤, et al. (2026) · Archives of Microbiology · doi:10.1007/s00203-026-05251-4
A review of antimicrobial peptides: Discovery, design strategies, and translational applications
Chen, T.-T., Luo, B., Li, B., Li, C.-M., Xie, T., Chen, W., Guo, J., & Wang, Y. (2026) · European Journal of Medicinal Chemistry · doi:10.1016/j.ejmech.2026.119422
Elshahawi, S. I. (2026) · Studies in natural products chemistry · doi:10.1016/b978-0-443-51068-7.00004-0
Metadata
- Authors
- Shukla, R., Lavore, F., Maity, S., Derks, M. G. N., Jones, C. R., Vermeulen, B. J. A., Melcrová, A., Morris, M. A., Becker, L. M., Wang, X., Kumar, R., Medeiros-Silva, J., van Beekveld, R. A. M., Bonvin, A. M. J. J., Lorent, J. H., Lelli, M., Nowick, J. S., MacGillavry, H. D., Peoples, A. J., Spoering, A. L., Ling, L. L., Hughes, D. E., Roos, W. H., Breukink, E., Lewis, K., & Weingarth, M.
- Affiliations
- Utrecht University (NL)
- University of Groningen (NL)
- University of California, Irvine (US)
- Consorzio Interuniversitario Risonanze Magnetiche di Metallo Proteine (IT)
- NovoBiotic Pharmaceuticals (US)
- Northeastern University (US)
- Corresponding author
- Weingarth, Markus
- ORCID
- Shukla, Rhythm
- Lavore, Francesca
- Maity, Sourav
- Derks, Maik G. N.
- Jones, Chelsea R.
- Vermeulen, Bram J. A.
- Melcrová, Adéla
- Morris, Michael A.
- Becker, Lea Marie
- Wang, Xiaoqi
- Kumar, Raj
- Medeiros-Silva, João
- van Beekveld, Roy A. M.
- Bonvin, Alexandre M. J. J.
- Lorent, Joseph H.
- Lelli, Moreno
- Nowick, James S.
- MacGillavry, Harold D.
- Peoples, Aaron J.
- Ling, Losee L.
- Hughes, Dallas E.
- Roos, Wouter H.
- Breukink, Eefjan
- Lewis, Kim
- Weingarth, Markus
- Venue
- Nature
- Published
- 2022-08-03
- Volume
- 608
- Issue
- 7922
- Pages
- 390-396
- ISSN
- 0028-0836 (ISSN-L)
- 1476-4687
- PMC
- PMC9365693
- OpenAlex
- W4289638129
- Cited by
- 201
- References
- 67
- Citations by year
- 2026: 30 · 2025: 65 · 2024: 53 · 2023: 48 · 2022: 5
- FWCI
- 26.73
- Type
- journal article
- Language
- en
- Open access
- hybrid
- doi.org
- Locations
- Nature (publishedVersion, cc-by)
- PubMed Central (publishedVersion, cc-by)
- PubMed (publishedVersion)
- RePEc: Research Papers in Economics (submittedVersion)
- Utrecht University Repository (Utrecht University) (submittedVersion, other-oa)
- eScholarship (California Digital Library) (submittedVersion, cc-by)
- Florence Research (University of Florence) (submittedVersion, other-oa)
- University of Groningen research database (University of Groningen / Centre for Information Technology) (submittedVersion, cc-by)
- Funders
- Dipartimenti di Eccellenza (Dipartimenti di Eccellenza 2018-2022, 2018–2022)
- European Commission (675728, 101045485, 823830, 2018-2022, HORIZON2020, 871037)
- Nederlandse Organisatie voor Wetenschappelijk Onderzoek (711.018.001, 680-91-007, 723.014.003, 718.015.001, 184.032.207)
- Università degli Studi di Firenze
- Topics
- Life Sciences › Immunology and Microbiology › Microbiology › Antimicrobial Peptides and Activities
- Life Sciences › Immunology and Microbiology › Applied Microbiology and Biotechnology › Antimicrobial agents and applications
- Life Sciences › Immunology and Microbiology › Applied Microbiology and Biotechnology › Microbial Natural Products and Biosynthesis
- Keywords
- teixobactin, lipid II, peptidoglycan precursor, antibiotic mechanism of action, bacterial cell envelope, membrane damage, antimicrobial resistance
- MeSH terms
- Sugars, Alanine, Anti-Bacterial Agents, Bacteria, Cell Membrane, Cell Wall, Humans, Lipids, Microbial Sensitivity Tests, Diphosphates, Pyrrolidines, Protein Structure, Secondary, Microscopy, Atomic Force, Nuclear Magnetic Resonance, Biomolecular, Drug Resistance, Bacterial, Depsipeptides, Microbial Viability, Molecular Dynamics Simulation
About these checks
Registry, retraction, Cites and statistics results are computed, not judged, with one exception: a printed reference that no index lists is read once by a model before it counts as a citation error. Claims are extracted by a model and kept only when their quote appears verbatim in the text; each cited source is then checked, with a model’s help, for whether it says what the claim relies on. Those verdicts can be wrong — read the claim’s quote and the cited source before relying on one.
Statistics and arithmetic are recomputed, not judged.
Confidence bands are shown only for fields calibrated on our annotated test set. None is calibrated yet, so no band is shown.
What counts as a claim ›How we measure confidence ›How we check this ›
Are you an author, or do you see a problem with this page? Request a review
