A rise-to-threshold process for a relative-value decision
Open accessPublished version of a preprint
The DOI matches its Crossref record; 105 of the 105 references it cites were found in a registry or an index.
Abstract
Whereas progress has been made in the identification of neural signals related to rapid, cued decisions 1–3 , less is known about how brains guide and terminate more ethologically relevant decisions in which an animal’s own behaviour governs the options experienced over minutes 4–6 . Drosophila search for many seconds to minutes for egg-laying sites with high relative value 7,8 and have neurons, called oviDNs, whose activity fulfills necessity and sufficiency criteria for initiating the egg-deposition motor programme 9 . Here we show that oviDNs express a calcium signal that (1) dips when an egg is internally prepared (ovulated), (2) drifts up and down over seconds to minutes—in a manner influenced by the relative value of substrates—as a fly determines whether to lay an egg and (3) reaches a consistent peak level just before the abdomen bend for egg deposition. This signal is apparent in the cell bodies of oviDNs in the brain and it probably reflects a behaviourally relevant rise-to-threshold process in the ventral nerve cord, where the synaptic terminals of oviDNs are located and where their output can influence behaviour. We provide perturbational evidence that the egg-deposition motor programme is initiated once this process hits a threshold and that subthreshold variation in this process regulates the time spent considering options and, ultimately, the choice taken. Finally, we identify a small recurrent circuit that feeds into oviDNs and show that activity in each of its constituent cell types is required for laying an egg. These results argue that a rise-to-threshold process regulates a relative-value, self-paced decision and provide initial insight into the underlying circuit mechanism for building this process.
Overview
The claims and statistics of this paper haven’t been checked yet.
Free: it reads the open-access text and checks the first 5 claims that cite a source we can check. Create a free account to check every claim.
Integrity signals
Registry
Cites
Statistics
Figures
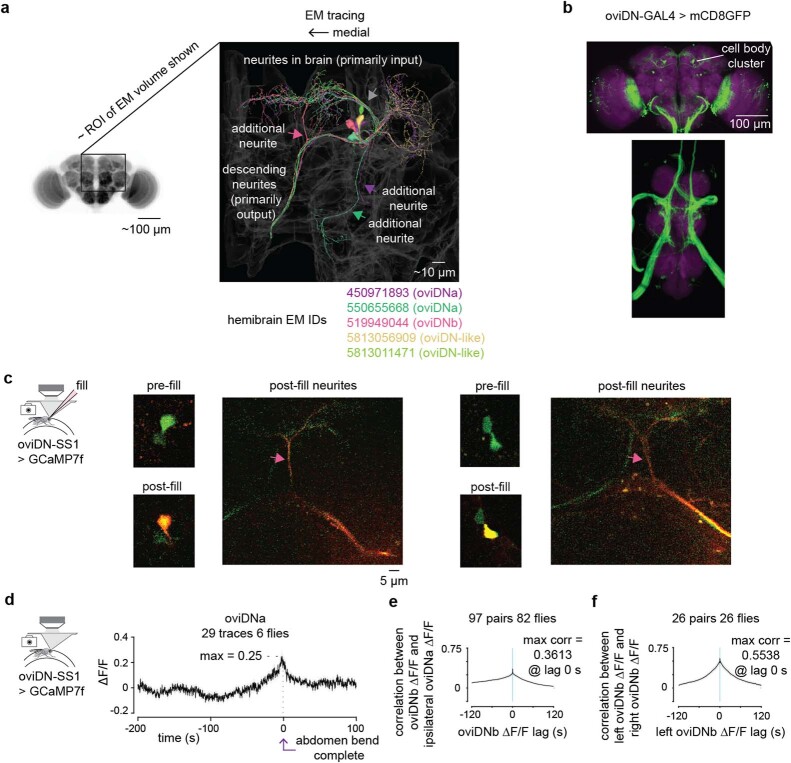
![Fig. 1 oviDN [Ca2+] dips during ovulation, rises for seconds to minutes and peaks immediately before the abdomen bend for egg deposition. a, Behavioural sequence of egg laying. b, Egg expressing GCaMP3 in the body. Steps correspond to a. Insets show close-ups, with over/undersaturated pixels in red/blue; main panels show over/undersaturated pixels in white/black. c, Behavioural progression. Lines connect single egg-laying sequences. d, Schematic of wheel. e, Single oviDNb traced from light microscopy images. Blue arrow indicates soma in brain, green arrow indicates outputs in the abdominal ganglion. f, oviDN somas on the right side of the brain labelled by oviDN-SS1. g, oviDN ∆F/F and behaviour during laying of two eggs by the same fly. ∆F/F is smoothed with a 2 s boxcar filter. Images are z-projection of selected imaging slices, with labels referring to oviDNa and oviDNb (oviDNa is partially obscured by oviDNb). h, Population-averaged oviDNb ∆F/F aligned to the end of the abdomen bend for egg laying. Light grey shading represents ±s.e.m. throughout; 43 imaging traces from 41 egg-laying events associated with nine cells in eight flies. The number of traces exceeds the number of egg-laying events because for two eggs we imaged oviDNb on both sides of the brain. Behavioural events shown below. i, Schematic of abdomen bend. θ denotes ‘body angle’ and length is neck–ovipositor distance. j–l, Mean oviDN ∆F/F and behaviour aligned to events in h: ‘ovulation start’ (j), ‘search start’ (k) and completion of abdomen bend (l). ‘Normalized length’ is the length given in i divided by its median (Methods). Shorter, thicker arrows indicate when abdomen bend for egg deposition is complete. A subsequent (stronger) bend is, presumably, for cleaning the ovipositor. m, oviDN ∆F/F during individual egg-laying events, smoothed with a 5 s boxcar filter. Black line, mean. n, Mean oviDN ∆F/F during egg laying for all seven flies that laid three or more eggs, smoothed with a 5 s boxcar filter. A single GCaMP7b fly is shown in grey. NP, Nippon Project; Ave., average; 2-p, two-photon; Ephys, electrophysiology; Max., maximum.](https://figures.cochat.ai/paper-figures/87121171d3db43c787f7124cc3f1889c/a-rise-to-threshold-process-for-a-relative-value-decision-figure-1.jpg)
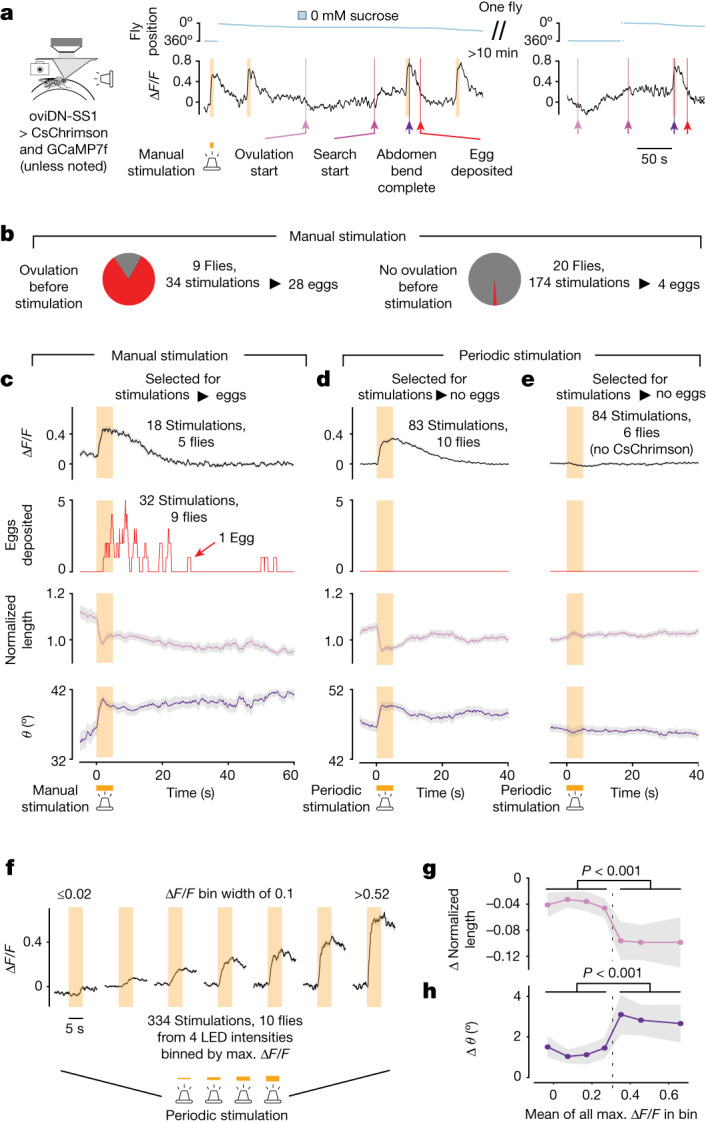
![Fig. 2 Evidence for a threshold in the ability of oviDNs to trigger the egg-deposition motor programme. a, oviDN ∆F/F and behaviour during high-intensity 5 s CsChrimson stimulation. ∆F/F is smoothed with a 2 s boxcar filter. b, High-intensity stimulations separated on the basis of whether ovulation was observed previously. Stimulations resulting in eggs were defined as those in which egg deposition occurred within 60 s of light onset. All four eggs without ovulation observed previously were from the first stimulation of a fly, and ovulation may have occurred before the session. c, Mean oviDN ∆F/F and behaviour for manually triggered, high-intensity stimulations that resulted in eggs. Light grey shading represents ±s.e.m. throughout. Behaviour, 32 stimulations in nine flies; ∆F/F, 18 stimulations in five flies. Differences in number of traces are explained in Methods. The peak in oviDN ∆F/F slightly lags behind initiation of the abdomen bend, potentially because [Ca2+] at the synaptic active zones rises faster than at the soma with optogenetic stimulation. d, Mean oviDN ∆F/F and behaviour for periodically triggered, high-intensity stimulations that did not result in eggs. Five of 88 stimulations that resulted in eggs are not shown so that changes independent of egg deposition could be analysed. e, Same as d but with flies not expressing CsChrimson (0 of 84 stimulations → eggs). f, oviDN ∆F/F during stimulation binned by maximum ∆F/F 1–3 s after start of stimulation. Four light intensities were triggered periodically. Stimulations were included regardless of whether egg deposition occurred (nine of 334 stimulations → eggs). The first and last bins include data below 0.02 and above 0.52, respectively. g,h, Change in mean body length (g) and body angle (h) for each of the bins in f. Mean behavioural signal 2–4 s after start of stimulation was subtracted from mean behavioural signal 0–2 s before stimulation. Two-sided Wilcoxon rank-sum test, P = 7.2 × 10⁻⁴ and 5.0 × 10⁻⁴. LED, light-emitting diode.](https://figures.cochat.ai/paper-figures/912cfd96a95846fda18b5ec6642fa7b9/a-rise-to-threshold-process-for-a-relative-value-decision-figure-2.jpg)
![Fig. 3 Flies search for an egg-deposition site with high relative value in the time period when the oviDN [Ca2+] signal rises. a, Y position and egg-deposition events from a fly in a high-throughput egg-laying choice chamber20. b, Fraction of eggs on the lower-sucrose option with 95% confidence interval. X axis indicates sucrose concentration (mM). One dot represents one fly. c, Eggs laid per fly. Mean ±s.e.m. indicated. One dot represents one fly. d, Each row represents a single egg-laying event in a 0 versus 500 mM sucrose chamber, aligned to egg deposition, with the fly’s speed indicated by colour intensity. Rows have been ordered based on the search duration; start of the search period is in magenta. Eighteen flies were tested, one of which did not lay eggs. e, Same data as in d, but the substrate on which the fly was residing is indicated by white and black pixels. f–h, Mean egg-laying rate during the search period aligned to a transition from higher to lower sucrose (lighter blues) or lower to higher sucrose (darker blues) in three separate choice conditions (0 versus 500 mM (f), 0 versus 200 mM (g) and 200 versus 500 mM (h)), with 90% confidence intervals (Methods): 771 eggs from 17 flies (f, 18 flies tested of which one did not lay eggs), 1,863 eggs from 42 flies (g, 47 flies tested of which five did not lay eggs) and 1,345 eggs from 30 flies (h, 30 flies tested). Egg-laying rate requires around 10 s to reach maximum after a fly transitions to the higher-relative-value option, at least partially because flies do not lay eggs on the (approximately) 2.5 mm plastic boundary between substrates (Extended Data Fig. 7e,f) and because there is a delay of about 3 s between when the fly bends its abdomen and deposits the egg (Extended Data Fig. 7g and Fig. 1c). Thus, the fly’s internal sense of relative value probably changes more rapidly after a transition than the slowly increasing egg-laying-rate curve would suggest.](https://figures.cochat.ai/paper-figures/da511086f2804f6da62067c631d505eb/a-rise-to-threshold-process-for-a-relative-value-decision-figure-3.jpg)


![Extended Data Fig. 2 Egg-laying wheel and tethered egg-laying behavioral sequence with oviDN [Ca2+]. a, Schematic of egg-laying wheel. b, Schematic of agarose-injecting mold, which is used to load agarose onto the wheel with a pipette. c, Schematic of egg-laying wheel assembly secured in a custom humidification chamber under the microscope objective. d, Fraction of eggs on the lower sucrose option for control substrates: colored dye infused substrates and 3D-printer material (VisiJet M3 Crystal) bases vs. acrylic bases. Error bars represent 95% confidence intervals. Each dot is one fly. These data suggest that the dyes and plastics involved in fabricating the egg-laying wheel should not cause abnormal substrate choice behavior. e, Fraction of eggs on the lower sucrose option for flies expressing GCaMP7f in oviDNs and by those pre-treated for tethered wheel experiments. Error bars represent 95% confidence intervals. Each dot is one fly. These data show that the flies we used in our imaging experiments exhibit normal substrate choice during free-behavior egg laying. f, Behavioral sequence of tethered egg laying as in Fig. 1a. Stills from a single egg-laying event. Overlaid and zoomed-in schematics of the tip of the abdomen from 3 frames is shown at the bottom right. g, Mean oviDN ∆F/F aligned to the moment abdomen bending to lay an egg is complete. 43 traces from 9 cells in 8 flies (41 eggs). Light grey shading is ± s.e.m. for all panels in this figure. Behavior shown below. h–n, Mean oviDN ∆F/F and behavior aligned to events in the behavioral sequence shown in panel g. Locomotor speed is smoothed with a 5 s boxcar filter. o, Mean oviDN ∆F/F aligned to when abdomen bend is complete with all data points before the start of the search omitted from the average.](https://figures.cochat.ai/paper-figures/1256c6f1063741adb80b3161abcd26c8/a-rise-to-threshold-process-for-a-relative-value-decision-figure-8.jpg)

![Extended Data Fig. 4 oviDN [Ca2+] traces from individual egg-laying events. a, OviDN ∆F/F showing all individual traces that were averaged in Fig. 1h (43 imaging traces from 41 egg-laying events associated with 9 cells in 8 flies). Grey lines are individual traces smoothed with a 5 s boxcar filter. Black line is the average of the non-smoothed individual traces. b, Each row represents a single egg-laying event. Rows have been ordered based on the search duration. Individual traces are smoothed as in panel a and behavioral annotations are overlayed. Individual traces corresponding to Fig. 1g and Fig. 1m (fly 3) are highlighted. Individual eggs that are part of the analysis in Fig. 4e, f are marked with an asterisk. c, Same as panel b but with a colormap where white is centered on a ∆F/F of 0 which is the average baseline in our normalization (Methods). Individual traces tend to (1) dip below baseline during ovulation (blue color after light pink/magenta line); (2) return to baseline around the time of search start (white color near dark pink/purple line); and (3) increase past baseline around or after the search start (red color after dark pink/purple line). These trends are captured by the average analysis presented in Fig. 1j–l. d, Normalized oviDN ∆F/F showing all individual traces in Fig. 1h (43 imaging traces from 41 egg-laying events associated with 9 cells in 8 flies). Grey lines are individual traces smoothed with a 5 s boxcar filter and then normalized such that the maximum and minimum ∆F/F in the 100 s window preceding the abdomen bend are set to 1 and 0, respectively. Black line is the average of the smoothed individual traces. e, Same as panel b but displaying ∆F/F normalized as in panel d.](https://figures.cochat.ai/paper-figures/6043d13809874aa5851920b6df32c61c/a-rise-to-threshold-process-for-a-relative-value-decision-figure-10.jpg)

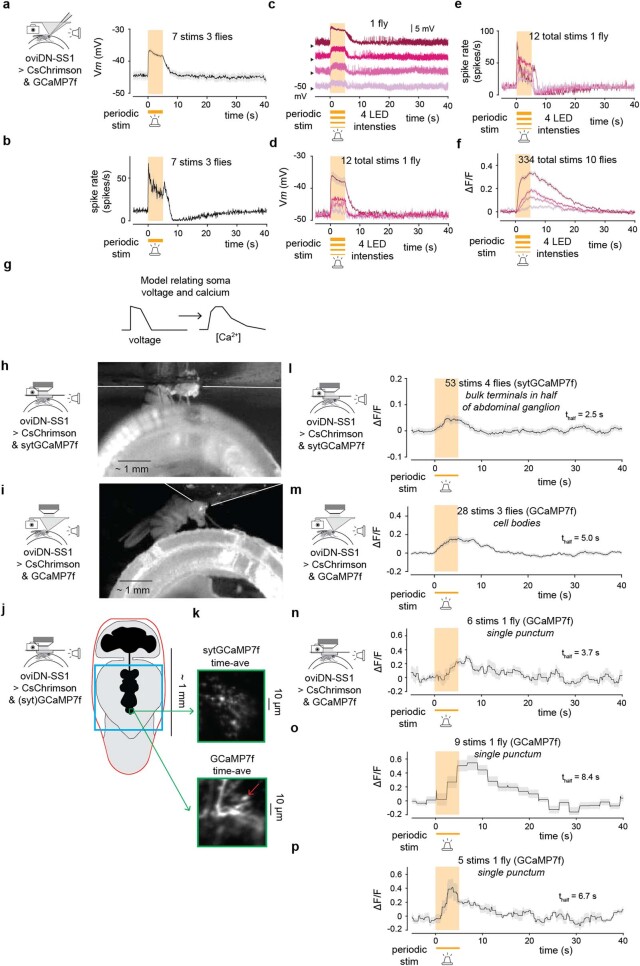
![Extended Data Fig. 6 [Ca2+] changes in the oviDN soma and presynaptic terminals lag changes in electrical activity. a, Mean oviDN Vm during periodically triggered high-intensity 5 s CsChrimson stimulations. Light grey shading is ± s.e.m. for all panels in this figure. b, Mean oviDN spike rate during periodically triggered high-intensity 5 s CsChrimson stimulations. c, OviDN single-trial Vm traces during periodically triggered 5 s CsChrimson stimulations at four different intensities in the same fly. Intensities are the same as in Fig. 2f–h. Traces have been shifted on the y-axis for clarity, with –50 mV indicated for each trace (black arrowhead). d, Mean oviDN Vm during periodically triggered 5 s CsChrimson stimulations at four different intensities (same fly as panel c). e, Mean oviDN spike rate during periodically triggered 5 s CsChrimson stimulations at four different intensities (same fly as panel c). f, Mean oviDN ∆F/F during periodically triggered 5 s CsChrimson stimulations at four different intensities (same data as Fig. 2f). g, Graphical model of the link between voltage and calcium in oviDN somas using evidence from panels a to f. Increases in voltage lead to slower increases in calcium and decreases in voltage lead to slower decreases in calcium. To first order calcium ∆F/F signals appear to be a low-pass filtered, delayed version of the voltage changes observed. Since CsChrimson does not permeate calcium79, changes in [Ca2+] observed during stimulation are likely due to opening of voltage-gated calcium channels. h, Preparation to image oviDN presynaptic terminals in the abdominal ganglion of the ventral nerve cord (Methods). i, Standard preparation for imaging the oviDN cell body in brain. j, Schematic (top view) of the holder in panel h. An outline of the hole in which the thorax, head, and anterior abdomen are inserted is shown in red. The dissected region is indicated in blue. A typical calcium imaging region is shown in green. k, Z-projections of representative calcium imaging regions. Compare to region indicated by green arrow in Fig. 1e. sytGCaMP7f80,81 was used to bias GCaMP expression to presynaptic compartments for bulk imaging of presynaptic terminals. Note that sytGCaMP biases GCaMP expression to terminals, but not necessarily to active zones81. Red arrow points to the punctum quantified in panel n. l, Mean oviDN ∆F/F in bulk presynaptic compartments during periodically triggered CsChrimson stimulation, using 2nd lowest intensity from panels c to f. A low stimulation intensity was applied such that subthreshold calcium accumulation could be investigated. Presynaptic compartments from oviDNa and oviDNb could not be distinguished and are thus averaged together. m, Mean oviDN ∆F/F in cell bodies during periodically triggered CsChrimson stimulation. To aide comparison with panel l, this experiment was done at a similar time, with similar conditions (Methods), and with ROIs encompassing both oviDNa and oviDNb cell bodies. n–p, Mean oviDN ∆F/F in selected single presynaptic compartments, from three different flies, during periodically triggered CsChrimson stimulation using the subthreshold intensity in panels l and m. ROIs were drawn around individual puncta in GCaMP7f expressing flies, which had a stronger florescence signal than sytGCaMP7f flies.](https://figures.cochat.ai/paper-figures/f3bb126e7919451aa7abf8a8d5f4bc37/a-rise-to-threshold-process-for-a-relative-value-decision-figure-12.jpg)


Verification
Claims the paper makes
The claims and statistics of this paper haven’t been checked yet.
Free: it reads the open-access text and checks the first 5 claims that cite a source we can check. Create a free account to check every claim.
Claims other papers make about this one
Each is checked against this paper’s own text: does it say what the citing paper says it does?
In the citing paper
“The OviDNs accumulate sensory information over time, and when they reach an excitation threshold, their activation initiates the motor sequence for egg laying [88].”
From Descending control of motor sequences in Drosophila (2024) · cites this paper as [88]
In the citing paper
“The OviDNs accumulate sensory information over time, and when they reach an excitation threshold, their activation initiates the motor sequence for egg laying [88].”
From Descending control of motor sequences in Drosophila (2024) · cites this paper as [88]
Self-check
Percentages, sums and reported differences re-computed from the paper’s own numbers.
The self-check needs the paper’s full text.
Citations
Cites
DeepLabCut: markerless pose estimation of user-defined body parts with deep learning
Mathis, A., Mamidanna, P., Cury, K. M., Abe, T., Murthy, V. N., Mathis, M. W., & Bethge, M. (2018) · Nature Neuroscience · doi:10.1038/s41593-018-0209-y · Cited by 5,187
The Neural Basis of Decision Making
Gold, J. I., & Shadlen, M. N. (2007) · Annual Review of Neuroscience · doi:10.1146/annurev.neuro.29.051605.113038 · Cited by 3,764
Independent optical excitation of distinct neural populations
Klapoetke, N. C., Murata, Y., Kim, S. S., Pulver, S. R., Birdsey-Benson, A., Cho, Y. K., Morimoto, T. K., Chuong, A. S., Carpenter, E. J., Tian, Z., et al. (2014) · Nature Methods · doi:10.1038/nmeth.2836 · Cited by 2,344
Cortical substrates for exploratory decisions in humans
Daw, N. D., O'Doherty, J. P., Dayan, P., Seymour, B., & Dolan, R. J. (2006) · Nature · doi:10.1038/nature04766 · Cited by 2,224
Calcium - a life and death signal
Berridge, M. J., Bootman, M. D., & Lipp, P. (1998) · Nature · doi:10.1038/27094 · Cited by 2,063
Imaging neural activity in worms, flies and mice with improved GCaMP calcium indicators
Tian, L., Hires, S. A., Mao, T., Huber, D., Chiappe, M. E., Chalasani, S. H., Petreanu, L., Akerboom, J., McKinney, S. A., Schreiter, E. R., et al. (2009) · Nature Methods · doi:10.1038/nmeth.1398 · Cited by 1,967
Computer Control of Microscopes Using µManager
Edelstein, A., Amodaj, N., Hoover, K., Vale, R., & Stuurman, N. (2010) · Current Protocols in Molecular Biology · doi:10.1002/0471142727.mb1420s92 · Cited by 1,670
Roitman, J. D., & Shadlen, M. N. (2002) · The Journal of Neuroscience · doi:10.1523/jneurosci.22-21-09475.2002 · Cited by 1,589
Spatiotemporal Rescue of Memory Dysfunction in Drosophila
McGuire, S. E., Le, P. T., Osborn, A. J., Matsumoto, K., & Davis, R. L. (2003) · Science · doi:10.1126/science.1089035 · Cited by 1,316
Co‐operative action of calcium ions in transmitter release at the neuromuscular junction
Dodge, F. A., & Rahamimoff, R. (1967) · The Journal of Physiology · doi:10.1113/jphysiol.1967.sp008367 · Cited by 1,308
Cited by
Muscles that move the retina augment compound eye vision in Drosophila
Fenk, L. M., Avritzer, S. C., Weisman, J. L., Nair, A., Randt, L., Mohren, T. L., Siwanowicz, I., & Maimon, G. (2022) · Nature · doi:10.1038/s41586-022-05317-5 · Cited by 83
The spatial and temporal structure of neural activity across the fly brain
Schaffer, E. S., Mishra, N., Whiteway, M. R., Li, W., Vancura, M. B., Freedman, J., Patel, K. B., Voleti, V., Paninski, L., Hillman, E. M. C., et al. (2023) · Nature Communications · doi:10.1038/s41467-023-41261-2 · Cited by 53
Motor control on the move: from insights in insects to general mechanisms
Büschges, A., & Ache, J. M. (2024) · Physiological Reviews · doi:10.1152/physrev.00009.2024 · Cited by 58
Flexible neural control of transition points within the egg-laying behavioral sequence in Drosophila
Cury, K. M., & Axel, R. (2023) · Nature Neuroscience · doi:10.1038/s41593-023-01332-5 · Cited by 40
Huang, Y.-C., Luo, J., Huang, W., Baker, C. M., Gomes, M. A., Meng, B., Byrne, A. B., & Flavell, S. W. (2023) · Current Biology · doi:10.1016/j.cub.2023.08.088 · Cited by 38
Metadata
- Authors
- Vijayan, V., Wang, F., Wang, K., Chakravorty, A., Adachi, A., Akhlaghpour, H., Dickson, B. J., & Maimon, G.
- Affiliations
- Howard Hughes Medical Institute (US)
- California Institute of Technology (US)
- Corresponding author
- Vijayan, Vikram
- Maimon, Gaby
- ORCID
- Venue
- Nature
- Published
- 2023-07-05
- Volume
- 619
- Issue
- 7970
- Pages
- 563-571
- ISSN
- 0028-0836 (ISSN-L)
- 1476-4687
- PMC
- PMC10356611
- OpenAlex
- W4383265722
- Cited by
- 49
- References
- 103
- Citations by year
- 2026: 3 · 2025: 14 · 2024: 17 · 2023: 10
- FWCI
- 5.31
- Type
- journal article
- Language
- en
- Open access
- hybrid
- doi.org
- Licence
- cc-by
- creativecommons.org/licenses/by/4.0 (tdm)
- creativecommons.org/licenses/by/4.0 (vor)
- Locations
- Nature (publishedVersion, cc-by)
- bioRxiv (Cold Spring Harbor Laboratory) (acceptedVersion, cc-by)
- PubMed Central (publishedVersion, cc-by)
- PubMed (publishedVersion)
- CaltechAUTHORS (California Institute of Technology) (submittedVersion, cc-by)
- RePEc: Research Papers in Economics (submittedVersion)
- Funders
- Leon Levy Foundation
- National Institutes of Health (P400D018537)
- National Institute of Neurological Disorders and Stroke (RF1NS121904, R01NS121904)
- Topics
- Life Sciences › Neuroscience › Cellular and Molecular Neuroscience › Neurobiology and Insect Physiology Research
- Life Sciences › Neuroscience › Cognitive Neuroscience › Neural dynamics and brain function
- Life Sciences › Neuroscience › Cellular and Molecular Neuroscience › Neuroscience and Neuropharmacology Research
- Keywords
- Drosophila, calcium imaging, oviposition, ventral nerve cord, recurrent circuits, decision threshold, ovulation
- MeSH terms
- Animals, Decision Making, Drosophila melanogaster, Female, Neural Pathways, Neurons, Oviposition, Psychomotor Performance, Presynaptic Terminals, Calcium Signaling
About these checks
Registry, retraction, Cites and statistics results are computed, not judged, with one exception: a printed reference that no index lists is read once by a model before it counts as a citation error. Claims are extracted by a model and kept only when their quote appears verbatim in the text; each cited source is then checked, with a model’s help, for whether it says what the claim relies on. Those verdicts can be wrong — read the claim’s quote and the cited source before relying on one.
Statistics and arithmetic are recomputed, not judged.
Confidence bands are shown only for fields calibrated on our annotated test set. None is calibrated yet, so no band is shown.
What counts as a claim ›How we measure confidence ›How we check this ›
Are you an author, or do you see a problem with this page? Request a review
How to cite
Cite CoChat for the checks on this page, and the paper for its own findings.
- This page
- CoChat. (2026). Citation check: A rise-to-threshold process for a relative-value decision. https://app.cochat.ai/papers/10.1038/s41586-023-06271-6
- The paper
- Vijayan, V., Wang, F., Wang, K., Chakravorty, A., Adachi, A., Akhlaghpour, H., Dickson, B. J., & Maimon, G. (2023). A rise-to-threshold process for a relative-value decision. Nature. https://doi.org/10.1038/s41586-023-06271-6
Data sources
Bibliographic data: Semantic Scholar, OpenAlex, Crossref.
Contains information from the Semantic Scholar Academic Graph Datasets, made available under the ODC Attribution License (ODC-BY 1.0).
Semantic Scholar’s data is described in: Kinney, R., et al. (2023). The Semantic Scholar Open Data Platform. arXiv:2301.10140.