Cited by 65

The DOI matches its Crossref record; 12 of the 12 references it cites were found in a registry or an index.

Synonymous mutations reveal genome-wide levels of positive selection in healthy tissues

Poon, Gladys Y. P., Watson, Caroline J., Fisher, Daniel S., Blundell, Jamie R.·2021·Nature Genetics

Published version of a preprint

Overview

The claims and statistics of this paper haven’t been checked yet.

Run the check — free, no account needed. It reads the open-access text and checks the sources it cites.

A few free checks a day · papers already verified open instantly · results are public

Integrity signals

Registry

Crossref · 10.1038/s41588-021-00957-1

Cites

12 of 12 references verified0 citation errors · 0 not checkable

Statistics

Figures
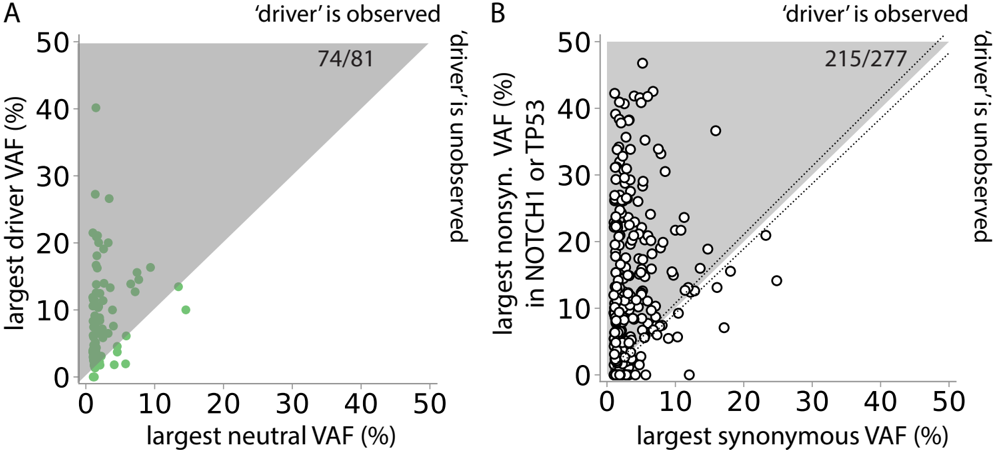
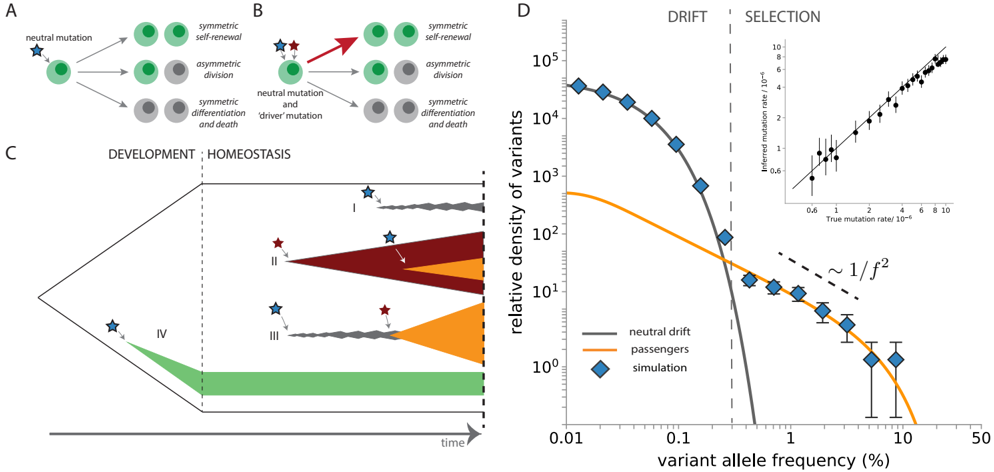
Fig. 1 A model of genetic hitchhiking ( A ) In a stochastic branching model of stem cell dynamics, self-renewal and differentiation rates remain balanced in cells harbouring neutral synonymous mutations. ( B ) A synonymous mutation (blue star) which co-occurs with a 'driver' mutation (maroon star) is termed a 'passenger'. The 'driver' causes a skew in cell fates towards self-renewal which also impacts the passenger due to genetic linkage. ( C ) A schematic depicting the four different classes of synonymous mutations that are considered here: (I) a synonymous mutation arising in adulthood not linked to any driver mutation performs neutral drift and remains at low VAF. (II) an expanding clone with a 'driver' mutation subsequently acquires a synonymous passenger mutation which hitchhikes to high VAF. (III) a neutral clone with a synonymous mutation subsequently acquires a 'driver' mutation and hitchhikes to high VAF. (IV) synonymous mutations that occur early during development can reach high VAF. ( D ) VAF spectra of neutral mutations (blue data points) from stochastic simulations are overlaid with theoretical predictions for drift ('neutral drift', grey line) and hitchhiking ('passengers', orange line). The amplitude of the high VAF synonymous variants accurately recovers the true rate of driver mutations (Inset). The main figure shows an instance of simulation (Supplementary note 2) with 'driver' mutation rate µ b =3 × 10 -6 per year at age 70 for the case where for τ =1 year.
Fig. 1 A model of genetic hitchhiking ( A ) In a stochastic branching model of stem cell dynamics, self-renewal and differentiation rates remain balanced in cells harbouring neutral synonymous mutations. ( B ) A synonymous mutation (blue star) which co-occurs with a 'driver' mutation (maroon star) is termed a 'passenger'. The 'driver' causes a skew in cell fates towards self-renewal which also impacts the passenger due to genetic linkage. ( C ) A schematic depicting the four different classes of synonymous mutations that are considered here: (I) a synonymous mutation arising in adulthood not linked to any driver mutation performs neutral drift and remains at low VAF. (II) an expanding clone with a 'driver' mutation subsequently acquires a synonymous passenger mutation which hitchhikes to high VAF. (III) a neutral clone with a synonymous mutation subsequently acquires a 'driver' mutation and hitchhikes to high VAF. (IV) synonymous mutations that occur early during development can reach high VAF. ( D ) VAF spectra of neutral mutations (blue data points) from stochastic simulations are overlaid with theoretical predictions for drift ('neutral drift', grey line) and hitchhiking ('passengers', orange line). The amplitude of the high VAF synonymous variants accurately recovers the true rate of driver mutations (Inset). The main figure shows an instance of simulation (Supplementary note 2) with 'driver' mutation rate µ b =3 × 10 -6 per year at age 70 for the case where for τ =1 year.CC-BY-ND · From the PDF
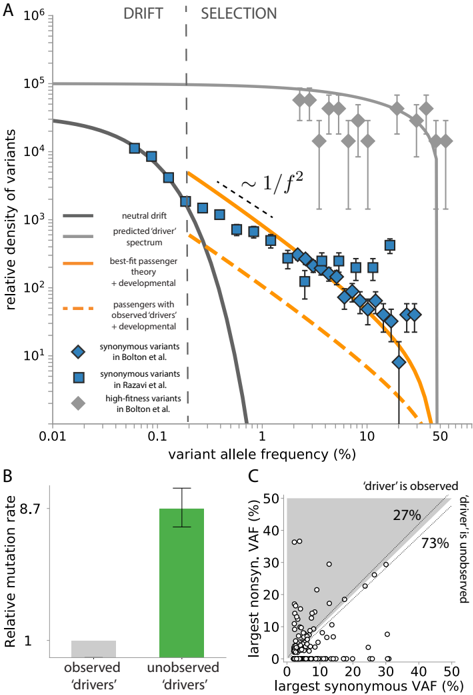
Fig. 2 Synonymous variants in healthy blood. ( A ) The density of synonymous variants (data points) from 14,15 are compared to the hitchhiker prediction based on 468 cancerassociated genes (orange dashed line) and best fit (solid line). The neutral drift prediction is based on Nτ =50 , 000 and µ n = 8 . 1 × 10 -4 both inferred from Razavi et al. 15 (Supplementary note 3C). The density of 20 high-fitness variants (grey data points) from Bolton et al. 14 decline with a scaling closer to ∼ 1 /f (flat in this log-log plot) in agreement with strong positive selection 17 . ( B ) The rate of unobserved 'driver' mutation is ∼ 9 -fold higher than the rate of observed 'driver' mutation (those occurring in the 468 cancer associated genes from 14 ). ( C ) Correlation of the highest nonsynonymous VAF and the highest synonymous VAF within the same individual in untreated patients ( n = 200 ) harbouring at least one synonymous variant in Bolton et al. 14 . Approximately 55 ± 10 individuals out of 200 ( ∼ 20 -30% ) harbour a putative 'driver' mutation detected at a higher VAF than the highest VAF synonymous variant. The diagonal dashed lines indicate the upper and lower error due to sampling noise for exactly same VAFs.
Fig. 2 Synonymous variants in healthy blood. ( A ) The density of synonymous variants (data points) from 14,15 are compared to the hitchhiker prediction based on 468 cancerassociated genes (orange dashed line) and best fit (solid line). The neutral drift prediction is based on Nτ =50 , 000 and µ n = 8 . 1 × 10 -4 both inferred from Razavi et al. 15 (Supplementary note 3C). The density of 20 high-fitness variants (grey data points) from Bolton et al. 14 decline with a scaling closer to ∼ 1 /f (flat in this log-log plot) in agreement with strong positive selection 17 . ( B ) The rate of unobserved 'driver' mutation is ∼ 9 -fold higher than the rate of observed 'driver' mutation (those occurring in the 468 cancer associated genes from 14 ). ( C ) Correlation of the highest nonsynonymous VAF and the highest synonymous VAF within the same individual in untreated patients ( n = 200 ) harbouring at least one synonymous variant in Bolton et al. 14 . Approximately 55 ± 10 individuals out of 200 ( ∼ 20 -30% ) harbour a putative 'driver' mutation detected at a higher VAF than the highest VAF synonymous variant. The diagonal dashed lines indicate the upper and lower error due to sampling noise for exactly same VAFs.CC-BY-ND · From the PDF
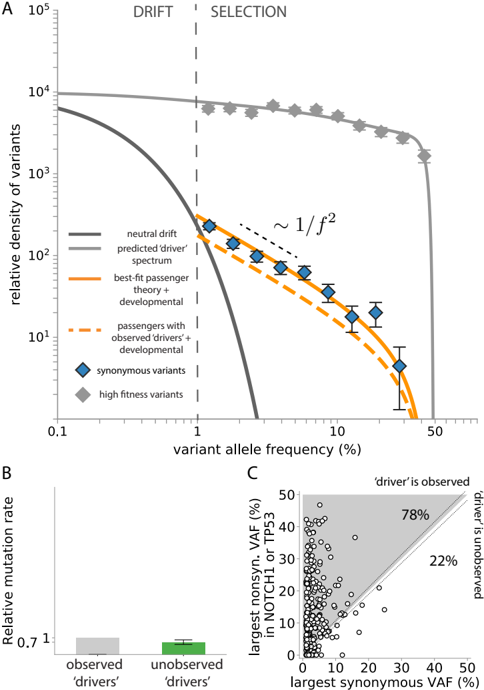
Fig. 3 Synonymous variants in healthy oesophagus. ( A ) The density of synonymous variants (blue data points) from 5 are compared to the hitchhiker prediction accounting for selection from NOTCH1 and TP53 only (orange dashed line) and a best fit (solid line). The neutral drift prediction (dark grey line) is based on Nτ inferred by considering the TP53 nonsynonymous VAF spectrum (Supplementary note 5B).The density of NOTCH1 nonsynonymous variants (grey data points) decline much less rapidly with VAF , in agreement with strong selection 17 . ( B ) The number of observed synonymous passengers is only ∼ 1 . 7 -fold higher than can be accounted for by considering only 'driver' mutation in NOTCH1 and TP53 . ( C ) Correlation of the highest NOTCH1 or TP53 nonsynonymous VAF and the highest synonymous VAF within samples ( n =277 ) harbouring any detected synonymous variant. Approximately 209 -222 individuals out of 277 ( ∼ 75 -80% ) harbour a putative 'driver' mutation detected at a higher VAF than the highest VAF synonymous variant. The diagonal dashed lines indicate the upper and lower error due to sampling noise for exactly same VAFs.
Fig. 3 Synonymous variants in healthy oesophagus. ( A ) The density of synonymous variants (blue data points) from 5 are compared to the hitchhiker prediction accounting for selection from NOTCH1 and TP53 only (orange dashed line) and a best fit (solid line). The neutral drift prediction (dark grey line) is based on Nτ inferred by considering the TP53 nonsynonymous VAF spectrum (Supplementary note 5B).The density of NOTCH1 nonsynonymous variants (grey data points) decline much less rapidly with VAF , in agreement with strong selection 17 . ( B ) The number of observed synonymous passengers is only ∼ 1 . 7 -fold higher than can be accounted for by considering only 'driver' mutation in NOTCH1 and TP53 . ( C ) Correlation of the highest NOTCH1 or TP53 nonsynonymous VAF and the highest synonymous VAF within samples ( n =277 ) harbouring any detected synonymous variant. Approximately 209 -222 individuals out of 277 ( ∼ 75 -80% ) harbour a putative 'driver' mutation detected at a higher VAF than the highest VAF synonymous variant. The diagonal dashed lines indicate the upper and lower error due to sampling noise for exactly same VAFs.CC-BY-ND · From the PDF
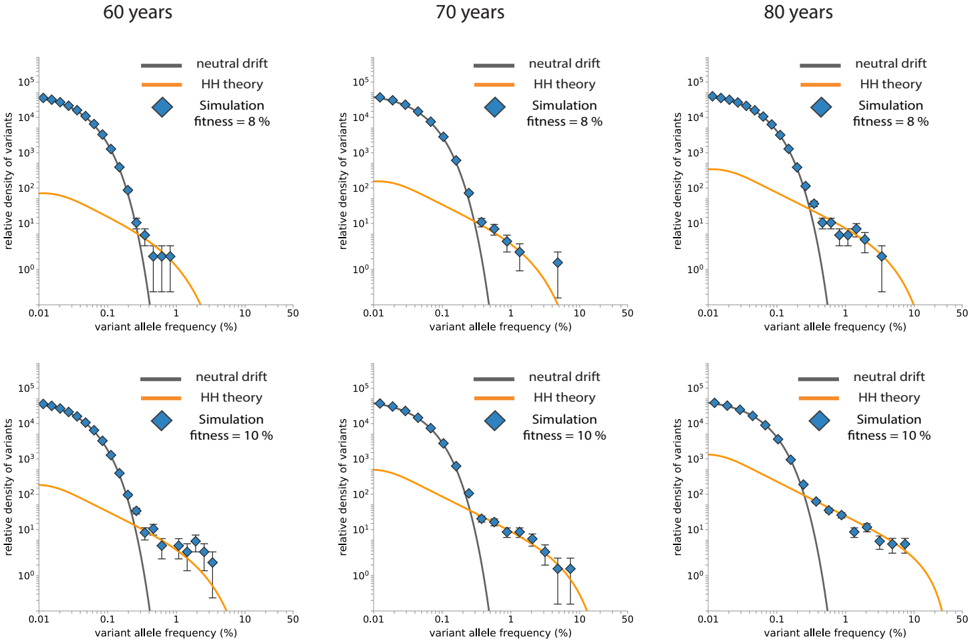
Fig. S1 Validation of neutral drift. The neutral drift prediction (dark grey line) VAF spectra matches with the distribution of lowfrequency neutral mutations in simulation (blue diamonds) at different times ( T =60 , 70 , 80 years for τ =1 year, µ b =10 -5 , µ n =10 -4 , N = 10 5 ) The passenger prediction (orange line) matches with the distribution of high-frequency neutral mutations (blue diamonds) at different selection levels (row 1 corresponds to sτ =0 . 08 and row 2 corresponds to sτ =0 . 1 , for τ =1 year). The passenger VAF spectrum is more age-dependent than the neutral drift VAF spectrum. For each set of parameters, 15000 simulations were performed for each set of parameters.
Fig. S1 Validation of neutral drift. The neutral drift prediction (dark grey line) VAF spectra matches with the distribution of lowfrequency neutral mutations in simulation (blue diamonds) at different times ( T =60 , 70 , 80 years for τ =1 year, µ b =10 -5 , µ n =10 -4 , N = 10 5 ) The passenger prediction (orange line) matches with the distribution of high-frequency neutral mutations (blue diamonds) at different selection levels (row 1 corresponds to sτ =0 . 08 and row 2 corresponds to sτ =0 . 1 , for τ =1 year). The passenger VAF spectrum is more age-dependent than the neutral drift VAF spectrum. For each set of parameters, 15000 simulations were performed for each set of parameters.CC-BY-ND · From the PDF
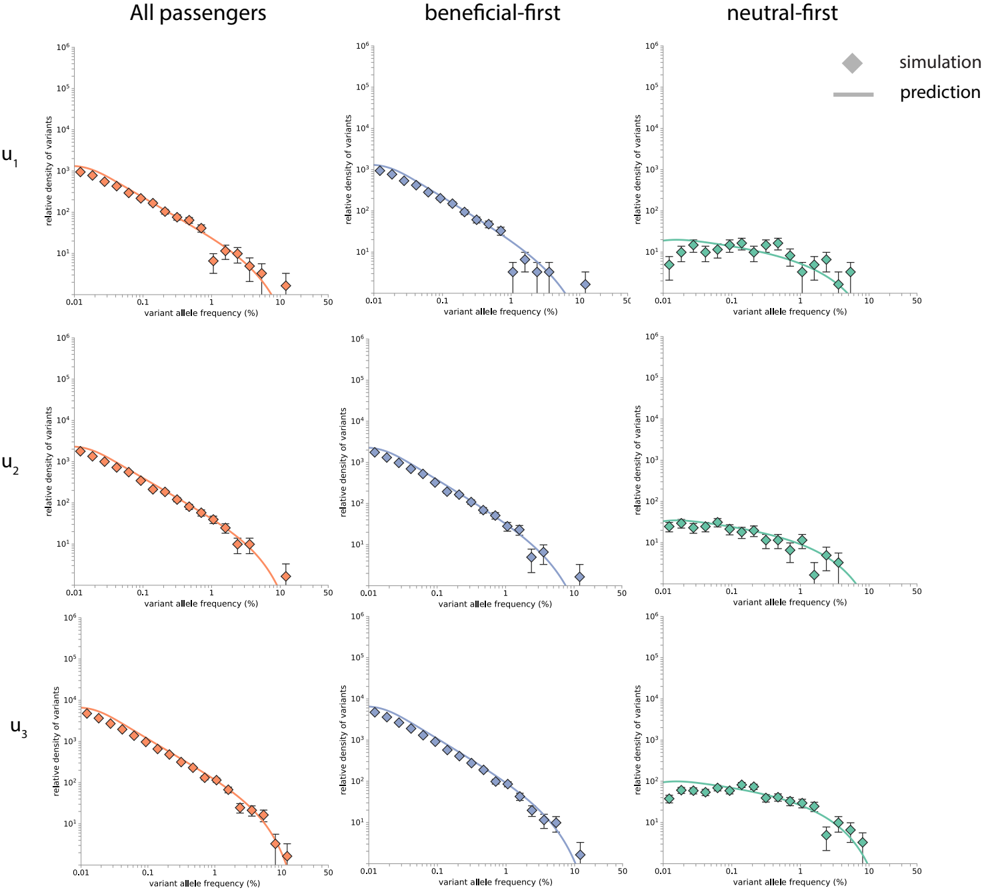
Fig. S2 Validation of two classes of passengers. Predicted VAF spectra for passengers via 'beneficial-first' and 'neutral-first' route match with simulations. There are 15000 simulation runs corresponding to µ b = u 1 = 4 × 10 -6 , µ b = u 2 = 7 × 10 -6 , and µ b = u 3 =2 × 10 -5 respectively, all with the same neutral mutation rate µ n =10 -4 , sτ =0 . 1 , N =10 5 , and examined at T =70 for τ =1 year. Their total in the simulations also matches with the prediction of the total passenger VAF spectra.
Fig. S2 Validation of two classes of passengers. Predicted VAF spectra for passengers via 'beneficial-first' and 'neutral-first' route match with simulations. There are 15000 simulation runs corresponding to µ b = u 1 = 4 × 10 -6 , µ b = u 2 = 7 × 10 -6 , and µ b = u 3 =2 × 10 -5 respectively, all with the same neutral mutation rate µ n =10 -4 , sτ =0 . 1 , N =10 5 , and examined at T =70 for τ =1 year. Their total in the simulations also matches with the prediction of the total passenger VAF spectra.CC-BY-ND · From the PDF
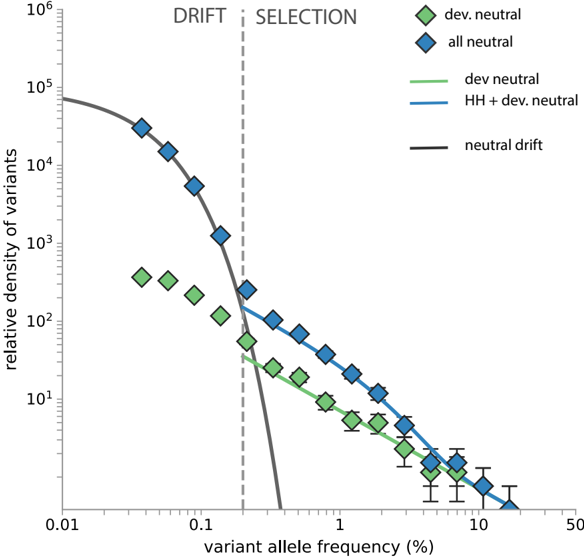
Fig. S3 Validation of developmental theory. Our theoretical prediction (Supplementary note 1B) for high VAF developmental mutations matches with the simulated VAF spectra of neutral mutations that arise during development (green diamonds). The VAF spectrum of developmental mutations is a 1 /f 2 relation. Its amplitude depends on developmental mutation rates and is not agedependent. The simulated neutral VAF spectrum (blue diamonds) can be accounted for by effects of neutral drift at low frequencies (grey curve), and contribution from genetic hitchhiking and development (blue curve) above the observed drift limit Ψ = 2 × 10 -3 , i.e. the VAF at which the abundance of mutants driven by drift become less than that of hitchhiking mutants (Supplementary note 3C, vertical grey dashed line). (parameters: r = 1 . 2 , T = 70 for τ = 1 year, N = 10 5 , sτ = 0 . 1 ; beneficial and neutral mutation rates u b =1 . 7 × 10 -6 and u n =0 . 00010 per generation during development; u b =1 × 10 -5 and u n =0 . 0006 per generation during homeostasis).
Fig. S3 Validation of developmental theory. Our theoretical prediction (Supplementary note 1B) for high VAF developmental mutations matches with the simulated VAF spectra of neutral mutations that arise during development (green diamonds). The VAF spectrum of developmental mutations is a 1 /f 2 relation. Its amplitude depends on developmental mutation rates and is not agedependent. The simulated neutral VAF spectrum (blue diamonds) can be accounted for by effects of neutral drift at low frequencies (grey curve), and contribution from genetic hitchhiking and development (blue curve) above the observed drift limit Ψ = 2 × 10 -3 , i.e. the VAF at which the abundance of mutants driven by drift become less than that of hitchhiking mutants (Supplementary note 3C, vertical grey dashed line). (parameters: r = 1 . 2 , T = 70 for τ = 1 year, N = 10 5 , sτ = 0 . 1 ; beneficial and neutral mutation rates u b =1 . 7 × 10 -6 and u n =0 . 00010 per generation during development; u b =1 × 10 -5 and u n =0 . 0006 per generation during homeostasis).CC-BY-ND · From the PDF
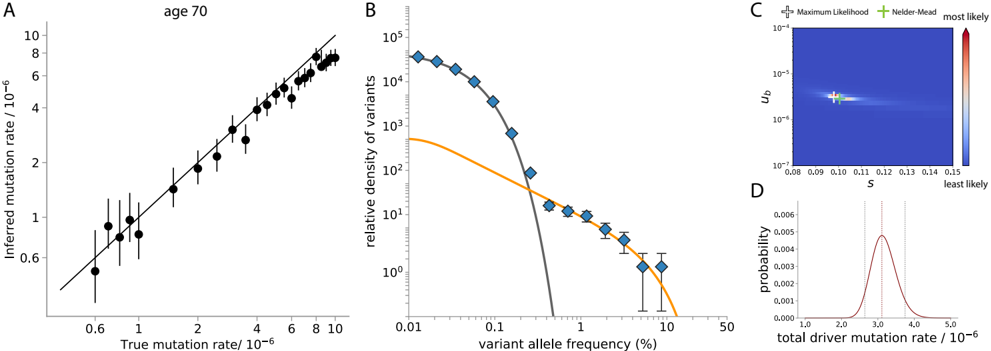
Fig. S4 Model performance in recovering driver mutation rates in simulations. (A) Our method is able to recover 'driver' mutation rates accurately across a range of mutation rates. At higher 'driver' mutation rate, it is mainly limited by clonal interference which causes clones to reach sizes lower than that predicted by our theory. (B) An instance of the simulation run at 'driver' mutation rate µ b = 3 × 10 -6 ( τ = 1 year). The neutral mutation frequency spectrum above Ψ = 3 × 10 -3 (dotted vertical line) is fitted with our passenger prediction to infer the underlying 'driver' mutation rates driving the expansions. (C) The likelihood plot shows the fit for the 'driver' mutation rate and fitness by examining the 'nonsynonymous' variant allele (i.e. 'driver' mutation) frequency spectrum only. It is overlaid with the maximum likelihood value (white cross) and best-fit value found by the Nelder-Mead optimization algorithm (green cross). (D) The likelihood plot shows the best-fit value as well as 95% confidence intervals for the inferred total 'driver' mutation rate from the 'synonymous' variant allele (neutral mutation) frequency spectrum based on the inferred fitness.
Fig. S4 Model performance in recovering driver mutation rates in simulations. (A) Our method is able to recover 'driver' mutation rates accurately across a range of mutation rates. At higher 'driver' mutation rate, it is mainly limited by clonal interference which causes clones to reach sizes lower than that predicted by our theory. (B) An instance of the simulation run at 'driver' mutation rate µ b = 3 × 10 -6 ( τ = 1 year). The neutral mutation frequency spectrum above Ψ = 3 × 10 -3 (dotted vertical line) is fitted with our passenger prediction to infer the underlying 'driver' mutation rates driving the expansions. (C) The likelihood plot shows the fit for the 'driver' mutation rate and fitness by examining the 'nonsynonymous' variant allele (i.e. 'driver' mutation) frequency spectrum only. It is overlaid with the maximum likelihood value (white cross) and best-fit value found by the Nelder-Mead optimization algorithm (green cross). (D) The likelihood plot shows the best-fit value as well as 95% confidence intervals for the inferred total 'driver' mutation rate from the 'synonymous' variant allele (neutral mutation) frequency spectrum based on the inferred fitness.CC-BY-ND · From the PDF
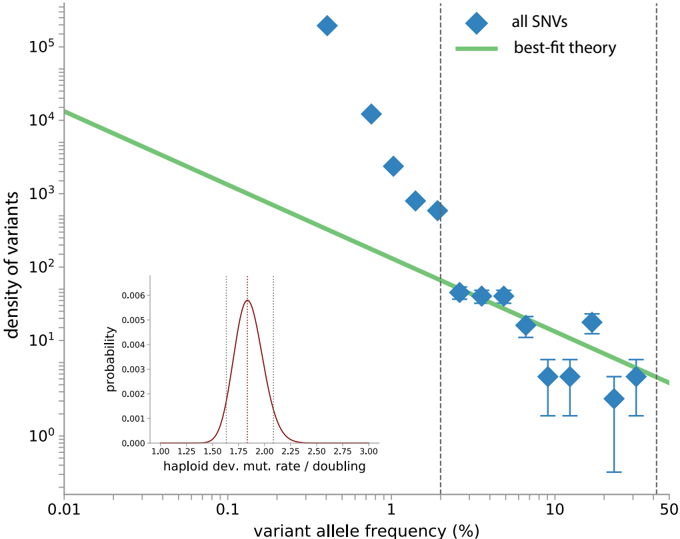
Fig. S5 Developmental mutation rates averages to 2 -4 across entire genome per cell doubling. Best-fitting to the reverse cumulative density (blue diamonds) - not normalized by mutation rates - is performed for SNV data obtained through single-cell whole genome sequencing down to f ′ =2% VAF and below ∼ 42% (grey dashed lines). The haploid developmental mutation rate is 1 . 8 ( 95% CI interval: 1 . 6 -2 . 1 ) per cell doubling (green line). Inset: Likelihood plot of best-fit.
Fig. S5 Developmental mutation rates averages to 2 -4 across entire genome per cell doubling. Best-fitting to the reverse cumulative density (blue diamonds) - not normalized by mutation rates - is performed for SNV data obtained through single-cell whole genome sequencing down to f ′ =2% VAF and below ∼ 42% (grey dashed lines). The haploid developmental mutation rate is 1 . 8 ( 95% CI interval: 1 . 6 -2 . 1 ) per cell doubling (green line). Inset: Likelihood plot of best-fit.CC-BY-ND · From the PDF
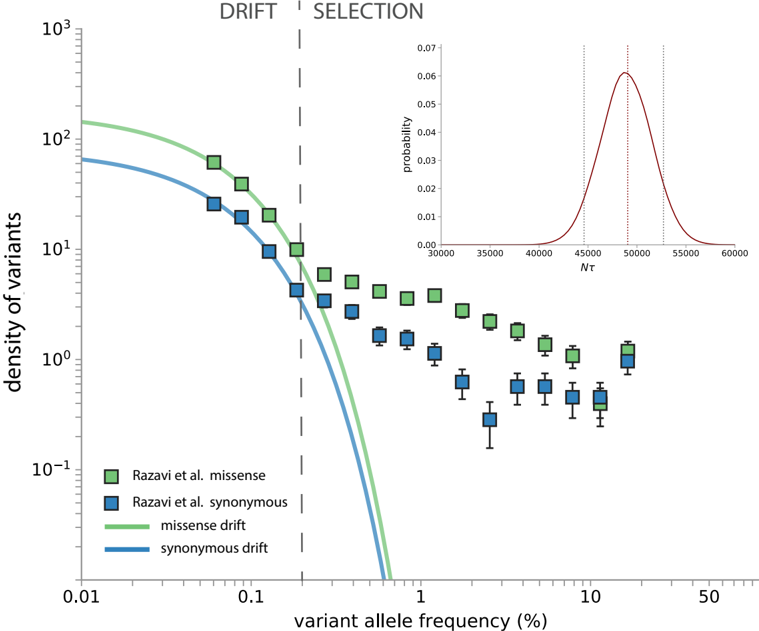
Fig. S6 Drift-selection boundary is evident in Razavi et al. data Variant data of all synonymous (blue squares) and missense variants (green squares) between VAF 0 . 05% and 20% from Razavi et al. 15 is plotted without normalizing by study-specific mutation rates. Transition from drift to selection is evident at VAF ≈ 0 . 2% . Best-fit predictions are shown ( Nτ =4 . 9 × 10 4 ( 95% CI= 4 . 5 × 10 4 -5 . 3 × 10 4 ) years, haploid synonymous mutation rate =8 . 1 × 10 -4 and haploid missense mutation rate =1 . 8 × 10 -3 per year).
Fig. S6 Drift-selection boundary is evident in Razavi et al. data Variant data of all synonymous (blue squares) and missense variants (green squares) between VAF 0 . 05% and 20% from Razavi et al. 15 is plotted without normalizing by study-specific mutation rates. Transition from drift to selection is evident at VAF ≈ 0 . 2% . Best-fit predictions are shown ( Nτ =4 . 9 × 10 4 ( 95% CI= 4 . 5 × 10 4 -5 . 3 × 10 4 ) years, haploid synonymous mutation rate =8 . 1 × 10 -4 and haploid missense mutation rate =1 . 8 × 10 -3 per year).CC-BY-ND · From the PDF
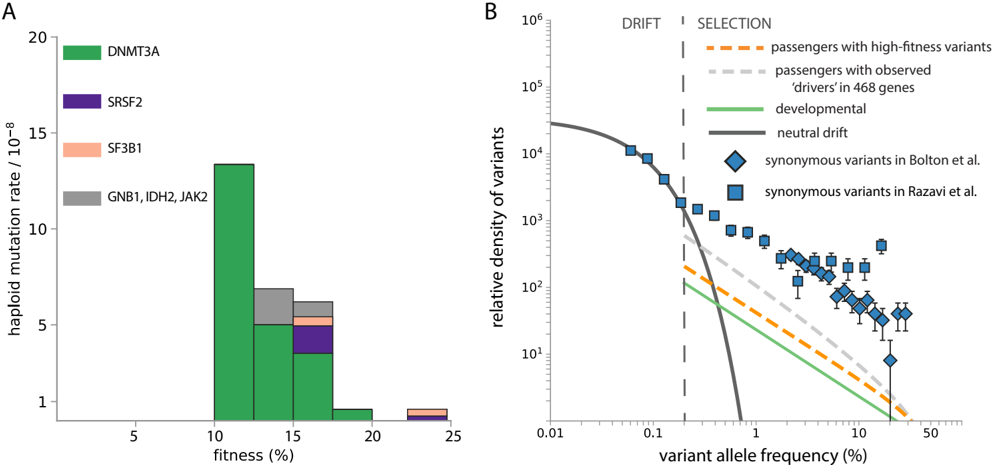
Fig. S7 Predicting passengers VAF spectra due to 20 common high-fitness variants in clonal haematopoiesis 17 (A) The fitness landscape of the top 20 discrete drivers in 17 binned in 2 . 5% fi tness intervals. These top variants belong to DNMT3A, SRSF2, SF3B1, GNB1, IDH2, and JAK2. (B) The shape of the predicted passenger VAF spectrum is consistent with 1 /f 2 only considering strong drivers but still underestimates the observed synonymous variant abundance at high and intermediate VAFs.
Fig. S7 Predicting passengers VAF spectra due to 20 common high-fitness variants in clonal haematopoiesis 17 (A) The fitness landscape of the top 20 discrete drivers in 17 binned in 2 . 5% fi tness intervals. These top variants belong to DNMT3A, SRSF2, SF3B1, GNB1, IDH2, and JAK2. (B) The shape of the predicted passenger VAF spectrum is consistent with 1 /f 2 only considering strong drivers but still underestimates the observed synonymous variant abundance at high and intermediate VAFs.CC-BY-ND · From the PDF
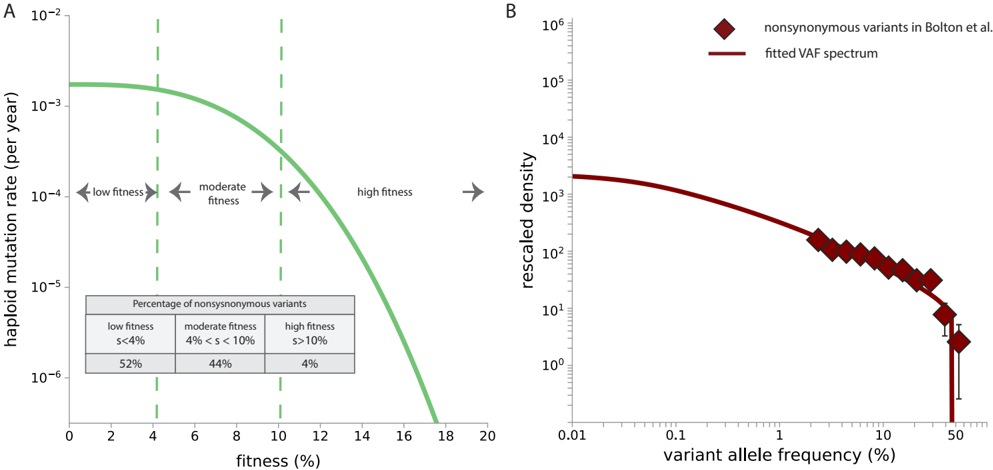
Fig. S8 Distribution of fitness effects of nonysynonymous variants in Bolton et al. 14 . Only individuals sequenced on the 468 -gene panel are considered in the fitting of the DFE. (A) Best-fit DFE ( p =2 . 9 , σ =0 . 08 , α =0 . 02 ) implies 2% of all nonsynonymous variants on the panel are functional (functional driver mutation rate is 3 . 5 × 10 -5 per year per haploid - the exact value is dependent on the shape of DFE), among which 4% are of high fitness ( s > 10% ), 44% are of moderate fitness ( 4% <s< 10% ) and 52% are of low fitness ( s < 4% ). (B) The best-fit nonsynonymous VAF spectrum predicted for the 269 nonsynonymous variants based on the exact distribution of ages.
Fig. S8 Distribution of fitness effects of nonysynonymous variants in Bolton et al. 14 . Only individuals sequenced on the 468 -gene panel are considered in the fitting of the DFE. (A) Best-fit DFE ( p =2 . 9 , σ =0 . 08 , α =0 . 02 ) implies 2% of all nonsynonymous variants on the panel are functional (functional driver mutation rate is 3 . 5 × 10 -5 per year per haploid - the exact value is dependent on the shape of DFE), among which 4% are of high fitness ( s > 10% ), 44% are of moderate fitness ( 4% <s< 10% ) and 52% are of low fitness ( s < 4% ). (B) The best-fit nonsynonymous VAF spectrum predicted for the 269 nonsynonymous variants based on the exact distribution of ages.CC-BY-ND · From the PDF
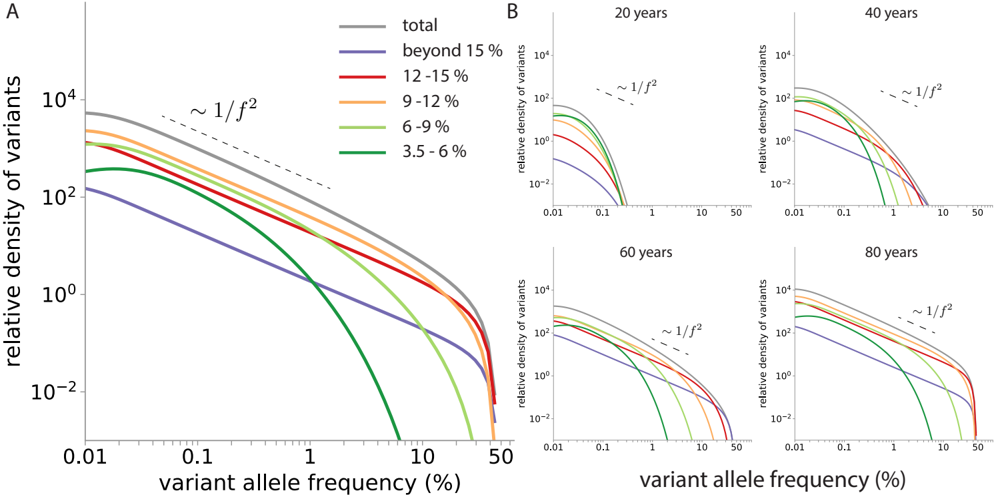
Fig. S9 Predicting the passenger VAF spectra contributed by different parts of the DFE (A) For the age distribution of the 590 individuals in Bolton et al. 14 , the passenger VAF prediction above VAF > 2% is dominated by the fraction of 'driver' mutation with fitness 9% <s< 15% for the inferred DFE in healthy blood (Supplementary note 3E). (B) The contribution of 'driver' mutations with different fitness in the DFE changes for each person as they age. The total (grey line) represents the total passenger VAF spectrum contributed by 'driver' mutation fitness s > 3 . 5% .
Fig. S9 Predicting the passenger VAF spectra contributed by different parts of the DFE (A) For the age distribution of the 590 individuals in Bolton et al. 14 , the passenger VAF prediction above VAF > 2% is dominated by the fraction of 'driver' mutation with fitness 9% <s< 15% for the inferred DFE in healthy blood (Supplementary note 3E). (B) The contribution of 'driver' mutations with different fitness in the DFE changes for each person as they age. The total (grey line) represents the total passenger VAF spectrum contributed by 'driver' mutation fitness s > 3 . 5% .CC-BY-ND · From the PDF
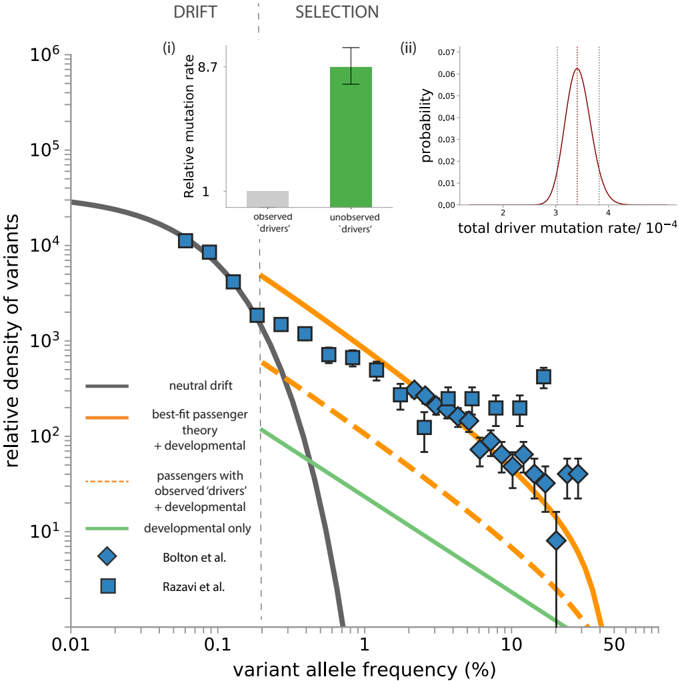
Fig. S10 Synonymous variants in healthy blood Synonymous variant data from 14,15 are compared to the passenger prediction for those that hitchhiked with observed 'drivers'. The prediction for passengers based on 468 cancer-associated genes (orange dashed line, passengers with observed 'drivers') underestimates numbers of high-frequency synonymous variants in healthy blood. Developmental mutations are estimated to be a small contribution (green line). The best fit (orange solid line, best-fit passenger theory + developmental) total driver haploid mutation rate per year for the DFE form used (Figure S8) is 3 . 4 × 10 -4 ( 95% CI: 3 . 0 × 10 -4 -3 . 8 × 10 -4 ) from fitting to Bolton data alone. The neutral drift prediction is based on estimates of HSC population size and study-specific synonymous mutation rate inferred from the drift-selection boundary (section C). The predictions are overlaid with data from Bolton et al. 14 as well as Razavi et al. 15 . (i) There are 8 . 7 ( 95% CI: 7 . 6 -9 . 9 ) fold more unobserved 'drivers' compared to the contribution from the 468 cancer-associated genes. (ii) Likelihood plot shows the 95% confidence interval for one-parameter fitting of the total functional 'driver' mutation rate across the fitness landscape with respect to the DFE form in section E.
Fig. S10 Synonymous variants in healthy blood Synonymous variant data from 14,15 are compared to the passenger prediction for those that hitchhiked with observed 'drivers'. The prediction for passengers based on 468 cancer-associated genes (orange dashed line, passengers with observed 'drivers') underestimates numbers of high-frequency synonymous variants in healthy blood. Developmental mutations are estimated to be a small contribution (green line). The best fit (orange solid line, best-fit passenger theory + developmental) total driver haploid mutation rate per year for the DFE form used (Figure S8) is 3 . 4 × 10 -4 ( 95% CI: 3 . 0 × 10 -4 -3 . 8 × 10 -4 ) from fitting to Bolton data alone. The neutral drift prediction is based on estimates of HSC population size and study-specific synonymous mutation rate inferred from the drift-selection boundary (section C). The predictions are overlaid with data from Bolton et al. 14 as well as Razavi et al. 15 . (i) There are 8 . 7 ( 95% CI: 7 . 6 -9 . 9 ) fold more unobserved 'drivers' compared to the contribution from the 468 cancer-associated genes. (ii) Likelihood plot shows the 95% confidence interval for one-parameter fitting of the total functional 'driver' mutation rate across the fitness landscape with respect to the DFE form in section E.CC-BY-ND · From the PDF
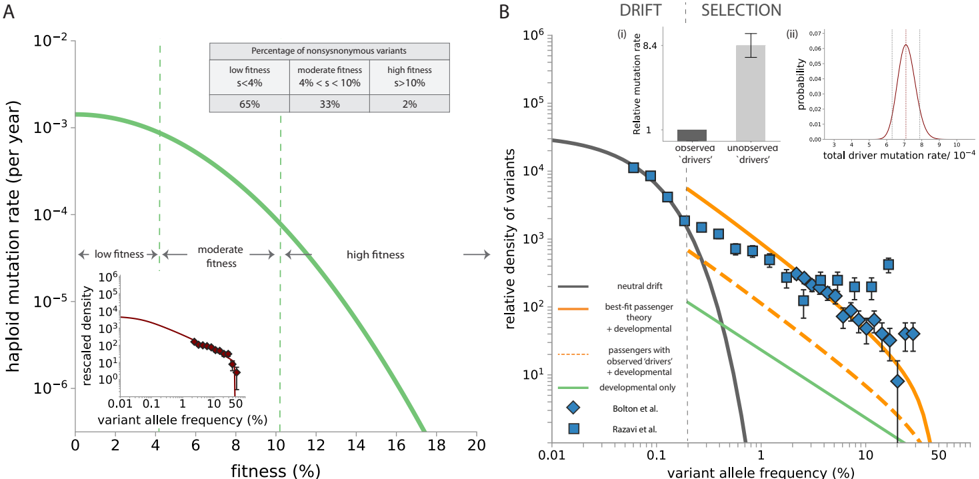
Fig. S11 DFE form with p =2 (A) Parameters of the DFE ( p =2 , σ =0 . 06 , α =0 . 05 ) are estimated from the nonsynonymous VAF spectrum in 'Bolton et al.' 14 . Among variants that are non-neutral (which constitute a haploid functional 'driver' mutation rate 7 . 6 × 10 -5 per year), 2% are of high fitness ( s > 10% ), 33% are of moderate fitness ( 4% < s < 10% ) and 65% are of low fitness ( s < 4% ). Inset: The best-fit nonsynonymous VAF spectrum predicted for the 269 nonsynonymous variants based on this DFE. (B) Theoretical predictions for neutral drift (grey line), passengers (orange lines) and developmental mutations (green line) are compared with observed data in 'Bolton et al.' 14 (blue diamonds) and "Razavi et al.' 15 (blue squares). (i) There are 8 . 4 ( 95% CI: 7 . 3 -9 . 4 ) fold more unobserved 'drivers' compared to the contribution from the 468 cancer-associated genes. (ii) Likelihood plot shows the 95% confidence interval for one-parameter fitting of the total functional 'driver' mutation rate across the fitness landscape with respect to this DFE form where p =2 .The best-fit total functional 'driver' mutation rate is 7 . 1 × 10 -4 ( 95% CI: 6 . 3 × 10 -4 -7 . 9 × 10 -4 ) per year (haploid).
Fig. S11 DFE form with p =2 (A) Parameters of the DFE ( p =2 , σ =0 . 06 , α =0 . 05 ) are estimated from the nonsynonymous VAF spectrum in 'Bolton et al.' 14 . Among variants that are non-neutral (which constitute a haploid functional 'driver' mutation rate 7 . 6 × 10 -5 per year), 2% are of high fitness ( s > 10% ), 33% are of moderate fitness ( 4% < s < 10% ) and 65% are of low fitness ( s < 4% ). Inset: The best-fit nonsynonymous VAF spectrum predicted for the 269 nonsynonymous variants based on this DFE. (B) Theoretical predictions for neutral drift (grey line), passengers (orange lines) and developmental mutations (green line) are compared with observed data in 'Bolton et al.' 14 (blue diamonds) and "Razavi et al.' 15 (blue squares). (i) There are 8 . 4 ( 95% CI: 7 . 3 -9 . 4 ) fold more unobserved 'drivers' compared to the contribution from the 468 cancer-associated genes. (ii) Likelihood plot shows the 95% confidence interval for one-parameter fitting of the total functional 'driver' mutation rate across the fitness landscape with respect to this DFE form where p =2 .The best-fit total functional 'driver' mutation rate is 7 . 1 × 10 -4 ( 95% CI: 6 . 3 × 10 -4 -7 . 9 × 10 -4 ) per year (haploid).CC-BY-ND · From the PDF
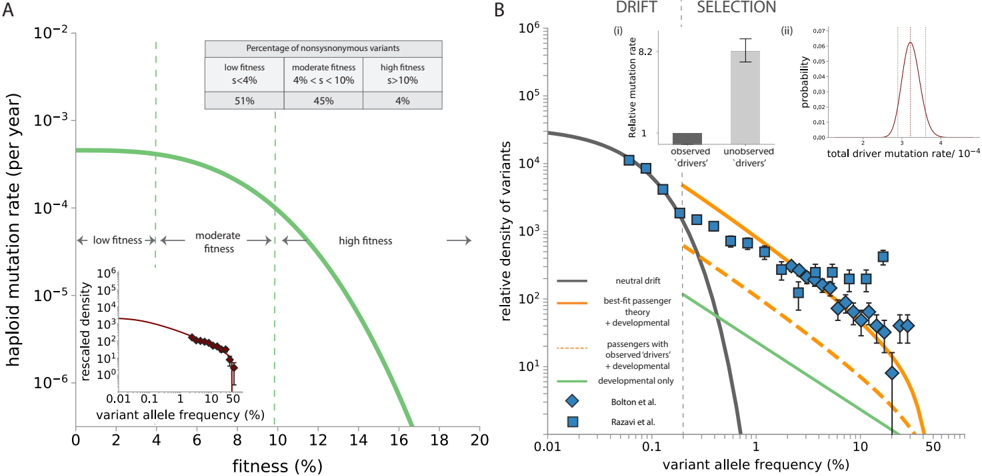
Fig. S12 DFE form with p =3 (A) Parameters of the DFE ( p =3 , σ =0 . 086 , α =0 . 02 ) are estimated from the nonsynonymous VAF spectrum in 'Bolton et al.' 14 . Among variants that are non-neutral (which constitute a haploid functional 'driver' mutation rate 3 . 5 × 10 -5 per year), 4% are of high fitness ( s > 10% ), 45% are of moderate fitness ( 4% < s < 10% ) and 51% are of low fitness ( s < 4% ). Inset: The best-fit nonsynonymous VAF spectrum predicted for the 269 nonsynonymous variants based on this DFE. (B) Theoretical predictions for neutral drift (grey line), passengers (orange lines) and developmental mutations (green line) are compared with observed data in 'Bolton et al.' 14 (blue diamonds) and "Razavi et al.' 15 (blue squares). (i) There are 8 . 2 ( 95% CI: 7 . 3 -9 . 3 ) fold more unobserved 'drivers' compared to the contribution from the 468 cancer-associated genes. (ii) Likelihood plot shows the 95% confidence interval for one-parameter fitting of the total functional 'driver' mutation rate across the fitness landscape with respect to this DFE form where p =3 .The best-fit total functional 'driver' mutation rate is 3 . 2 × 10 -4 ( 95% CI: 2 . 9 × 10 -4 -3 . 6 × 10 -4 ) per year (haploid).
Fig. S12 DFE form with p =3 (A) Parameters of the DFE ( p =3 , σ =0 . 086 , α =0 . 02 ) are estimated from the nonsynonymous VAF spectrum in 'Bolton et al.' 14 . Among variants that are non-neutral (which constitute a haploid functional 'driver' mutation rate 3 . 5 × 10 -5 per year), 4% are of high fitness ( s > 10% ), 45% are of moderate fitness ( 4% < s < 10% ) and 51% are of low fitness ( s < 4% ). Inset: The best-fit nonsynonymous VAF spectrum predicted for the 269 nonsynonymous variants based on this DFE. (B) Theoretical predictions for neutral drift (grey line), passengers (orange lines) and developmental mutations (green line) are compared with observed data in 'Bolton et al.' 14 (blue diamonds) and "Razavi et al.' 15 (blue squares). (i) There are 8 . 2 ( 95% CI: 7 . 3 -9 . 3 ) fold more unobserved 'drivers' compared to the contribution from the 468 cancer-associated genes. (ii) Likelihood plot shows the 95% confidence interval for one-parameter fitting of the total functional 'driver' mutation rate across the fitness landscape with respect to this DFE form where p =3 .The best-fit total functional 'driver' mutation rate is 3 . 2 × 10 -4 ( 95% CI: 2 . 9 × 10 -4 -3 . 6 × 10 -4 ) per year (haploid).CC-BY-ND · From the PDF
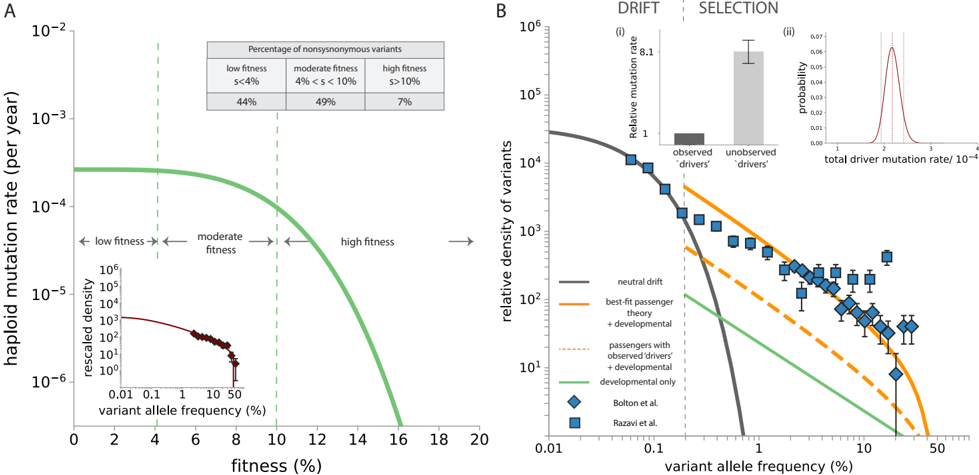
Fig. S13 DFE form with p = 4 (A) Parameters of the DFE ( p = 4 , σ = 0 . 10 , α = 0 . 015 ) are estimated from the nonsynonymous VAF spectrum in 'Bolton et al.' 14 . Among variants that are non-neutral (which constitute a haploid functional 'driver' mutation rate 2 . 4 × 10 -5 per year), 7% are of high fitness ( s > 10% ), 49% are of moderate fitness ( 4% < s < 10% ) and 44% are of low fitness ( s < 4% ). Inset: The best-fit nonsynonymous VAF spectrum predicted for the 269 nonsynonymous variants based on this DFE. (B) Theoretical predictions for neutral drift (grey line), passengers (orange lines) and developmental mutations (green line) are compared with observed data in 'Bolton et al.' 14 (blue diamonds) and "Razavi et al.' 15 e (blue squares). (i) There are 8 . 1 ( 95% CI: 7 . 0 -9 . 0 ) fold more unobserved 'drivers' compared to the contribution from the 468 cancer-associated genes. (ii) Likelihood plot shows the 95% confidence interval for one-parameter fitting of the total functional 'driver' mutation rate across the fitness landscape with respect to this DFE form where p =4 .The best-fit total functional 'driver' mutation rate is 2 . 2 × 10 -4 ( 95% CI: 1 . 9 × 10 -4 -2 . 4 × 10 -4 ) per year (haploid).
Fig. S13 DFE form with p = 4 (A) Parameters of the DFE ( p = 4 , σ = 0 . 10 , α = 0 . 015 ) are estimated from the nonsynonymous VAF spectrum in 'Bolton et al.' 14 . Among variants that are non-neutral (which constitute a haploid functional 'driver' mutation rate 2 . 4 × 10 -5 per year), 7% are of high fitness ( s > 10% ), 49% are of moderate fitness ( 4% < s < 10% ) and 44% are of low fitness ( s < 4% ). Inset: The best-fit nonsynonymous VAF spectrum predicted for the 269 nonsynonymous variants based on this DFE. (B) Theoretical predictions for neutral drift (grey line), passengers (orange lines) and developmental mutations (green line) are compared with observed data in 'Bolton et al.' 14 (blue diamonds) and "Razavi et al.' 15 e (blue squares). (i) There are 8 . 1 ( 95% CI: 7 . 0 -9 . 0 ) fold more unobserved 'drivers' compared to the contribution from the 468 cancer-associated genes. (ii) Likelihood plot shows the 95% confidence interval for one-parameter fitting of the total functional 'driver' mutation rate across the fitness landscape with respect to this DFE form where p =4 .The best-fit total functional 'driver' mutation rate is 2 . 2 × 10 -4 ( 95% CI: 1 . 9 × 10 -4 -2 . 4 × 10 -4 ) per year (haploid).CC-BY-ND · From the PDF
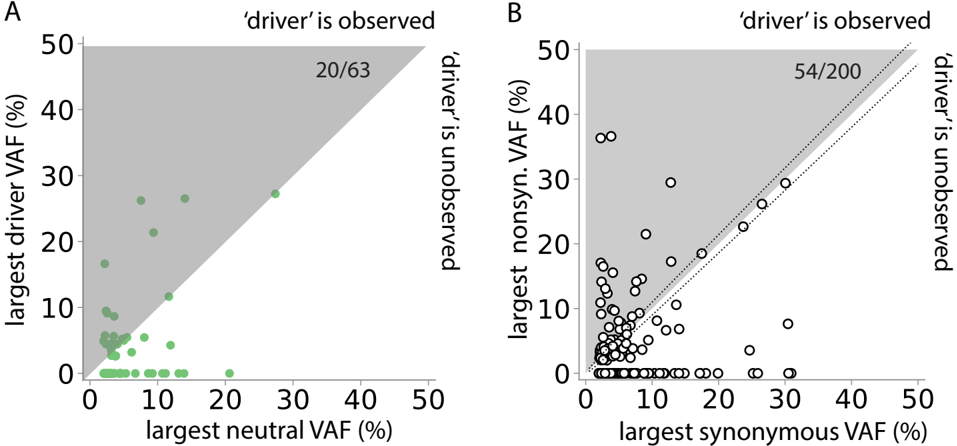
Fig. S14 VAF correlation in healthy blood (A) Green points represent simulated results ( τ = 1 year). The highest VAF neutral and driver mutations were recorded in each simulation run according to the DFE inferred from blood (Supplementary note 3G) for 590 individuals (ran twice) with the exact same age distribution as the Bolton et al. 14 cohort, and neutral mutation rate is equal to the study-specific haploid synonymous mutation rate in Bolton et al. Only mutations above detection limit, i.e. 2% VAF and one in every six drivers was recorded in each individual (i.e. unobserved 'drivers' are 5 folds of observed 'drivers'). Hence only 63 individuals resulted in detectable neutral mutations. The largest observed 'driver' and the largest neutral mutation VAF are plotted and 32% ( 20 / 63 ) lie above the diagonal. (B) In Bolton et al. 14 , there are 200 untreated patients who harbour at least 1 synonymous variant before data trimming. 54 harbour a nonsynonymous variant in any gene on the MSK-IMPACT panel that is at a higher VAF than their highest VAF synonymous variant. Most data points are expected to lie below the diagonal if most synonymous variants hitchhike with variants outside these genes, which is indeed the case as only 54 data points are above the diagonal ( 54 / 200 = 27% ). The diagonal dashed lines indicate the upper and lower error due to sampling noise for exactly same VAFs. Taking into account sampling errors due to finite coverage ∼ 500 x, this fraction ranges from 42 -67 out of 200 ( 21 -33% ). This suggests that a significant portion of major clonal expansions are driven by 'drivers' outside the 468 -gene MASK-IMPACT panel or are caused by more complex mutations.
Fig. S14 VAF correlation in healthy blood (A) Green points represent simulated results ( τ = 1 year). The highest VAF neutral and driver mutations were recorded in each simulation run according to the DFE inferred from blood (Supplementary note 3G) for 590 individuals (ran twice) with the exact same age distribution as the Bolton et al. 14 cohort, and neutral mutation rate is equal to the study-specific haploid synonymous mutation rate in Bolton et al. Only mutations above detection limit, i.e. 2% VAF and one in every six drivers was recorded in each individual (i.e. unobserved 'drivers' are 5 folds of observed 'drivers'). Hence only 63 individuals resulted in detectable neutral mutations. The largest observed 'driver' and the largest neutral mutation VAF are plotted and 32% ( 20 / 63 ) lie above the diagonal. (B) In Bolton et al. 14 , there are 200 untreated patients who harbour at least 1 synonymous variant before data trimming. 54 harbour a nonsynonymous variant in any gene on the MSK-IMPACT panel that is at a higher VAF than their highest VAF synonymous variant. Most data points are expected to lie below the diagonal if most synonymous variants hitchhike with variants outside these genes, which is indeed the case as only 54 data points are above the diagonal ( 54 / 200 = 27% ). The diagonal dashed lines indicate the upper and lower error due to sampling noise for exactly same VAFs. Taking into account sampling errors due to finite coverage ∼ 500 x, this fraction ranges from 42 -67 out of 200 ( 21 -33% ). This suggests that a significant portion of major clonal expansions are driven by 'drivers' outside the 468 -gene MASK-IMPACT panel or are caused by more complex mutations.CC-BY-ND · From the PDF
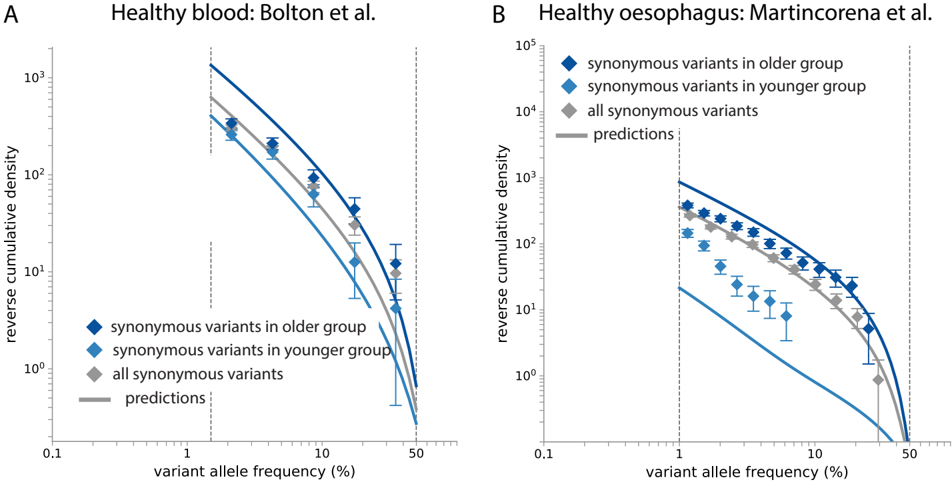
Fig. S15 Age dependence of synonymous VAF spectra. Reverse cumulatives of the synonymous VAF spectra are compared with predictions based on the best-fit in our analyses (Supplementary Figure S10 and S17) within the VAF window where we consider there to be low false negative rates (region between the vertical grey lines). The data shows age dependence in both Bolton et al. 14 and Martincorena et al. 5 . (A) Bolton et al. 14 is chosen to represent healthy blood because it comprises the vast majority of the entire cohort analyzed in the main text ( 590 people). There are 194 controls with age 64 -72 (younger group) and 201 controls with age larger than 72 (older group). (B) The younger age group in Martincorena et al. 5 consists of 3 healthy donors of age 21 . 5 , 25 . 5 , 37 . 5 (sample number is 273 ) and the older age group consists of 3 oldest healthy donors of age 57 . 5 , 69 . 5 , 73 . 5 (sample number is 284 ).
Fig. S15 Age dependence of synonymous VAF spectra. Reverse cumulatives of the synonymous VAF spectra are compared with predictions based on the best-fit in our analyses (Supplementary Figure S10 and S17) within the VAF window where we consider there to be low false negative rates (region between the vertical grey lines). The data shows age dependence in both Bolton et al. 14 and Martincorena et al. 5 . (A) Bolton et al. 14 is chosen to represent healthy blood because it comprises the vast majority of the entire cohort analyzed in the main text ( 590 people). There are 194 controls with age 64 -72 (younger group) and 201 controls with age larger than 72 (older group). (B) The younger age group in Martincorena et al. 5 consists of 3 healthy donors of age 21 . 5 , 25 . 5 , 37 . 5 (sample number is 273 ) and the older age group consists of 3 oldest healthy donors of age 57 . 5 , 69 . 5 , 73 . 5 (sample number is 284 ).CC-BY-ND · From the PDF
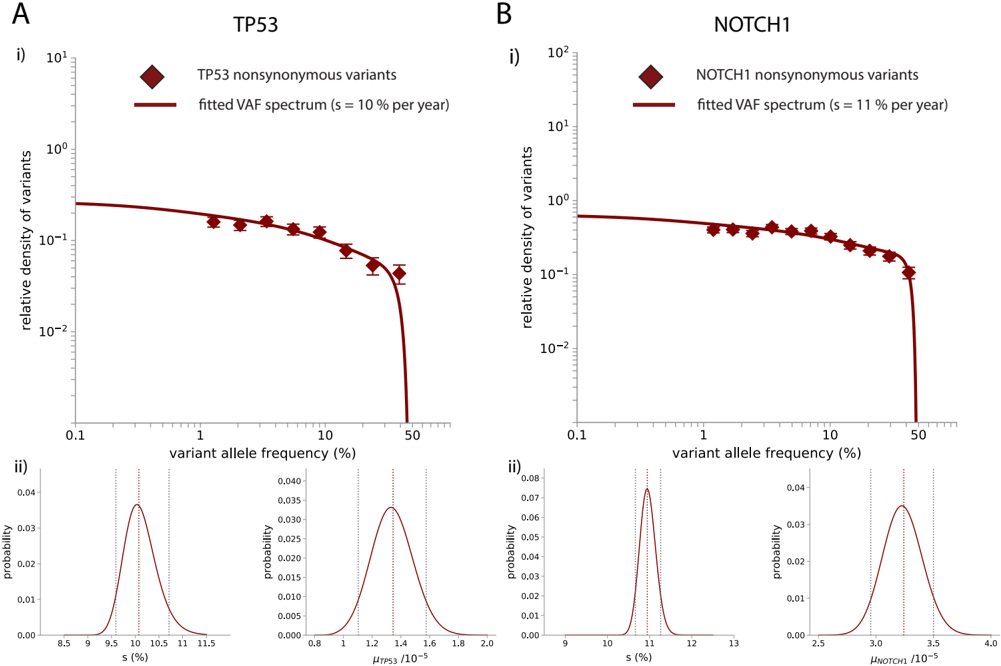
Fig. S16 Nonsynonymous variants in healthy oesophagus. (A) Nonsynonymous variants (maroon diamonds) at VAF > 1% in TP53 are fitted with predictions for driver mutations (maroon solid line). Based on Nτ =1 × 10 4 years from a 3-parameter best-fit of the TP53 nonsynonymous VAF spectrum, it is estimated that µ TP53 =1 . 4 × 10 -5 ( 95% CI : 1 . 1 -1 . 6 × 10 -5 ) per year per haploid and s =0 . 10 per year ( 95% CI : 0 . 096 -0 . 107 ) for TP53. (B) Nonsynonymous variants (maroon diamonds) at VAF > 1% in NOTCH1 are fitted with predictions for driver mutations (maroon solid line). Based on Nτ =10 4 years, it is estimated that µ NOTCH1 =3 . 3 × 10 -5 ( 95% CI : 3 . 0 -3 . 6 × 10 -5 ) per year per haploid and s =0 . 11 per year ( 95% CI : 0 . 107 -0 . 112 ) (CI from 2-parameter fit) for NOTCH1.
Fig. S16 Nonsynonymous variants in healthy oesophagus. (A) Nonsynonymous variants (maroon diamonds) at VAF > 1% in TP53 are fitted with predictions for driver mutations (maroon solid line). Based on Nτ =1 × 10 4 years from a 3-parameter best-fit of the TP53 nonsynonymous VAF spectrum, it is estimated that µ TP53 =1 . 4 × 10 -5 ( 95% CI : 1 . 1 -1 . 6 × 10 -5 ) per year per haploid and s =0 . 10 per year ( 95% CI : 0 . 096 -0 . 107 ) for TP53. (B) Nonsynonymous variants (maroon diamonds) at VAF > 1% in NOTCH1 are fitted with predictions for driver mutations (maroon solid line). Based on Nτ =10 4 years, it is estimated that µ NOTCH1 =3 . 3 × 10 -5 ( 95% CI : 3 . 0 -3 . 6 × 10 -5 ) per year per haploid and s =0 . 11 per year ( 95% CI : 0 . 107 -0 . 112 ) (CI from 2-parameter fit) for NOTCH1.CC-BY-ND · From the PDF
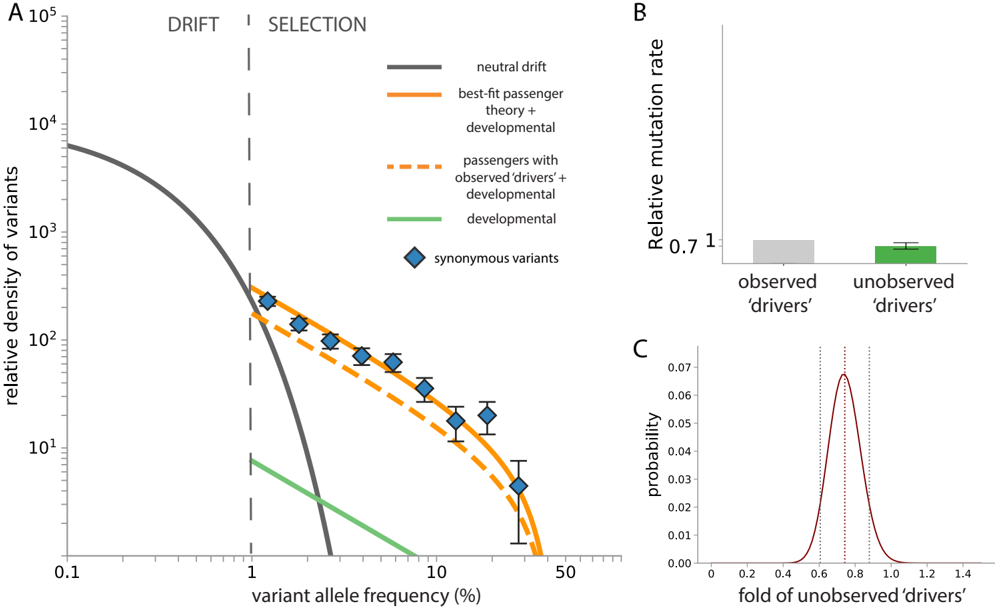
Fig. S17 Synonymous variants in healthy oesophagus. (A) Synonymous SNVs reported in 5 (blue diamonds) are plotted as VAF densities after normalization by 2 µ syn where µ syn =6 . 8 × 10 -4 is the estimated annual haploid synonymous mutation rate across the sequencing panel. The developmental contribution (green line) is small relative to somatic contributions. The abundance of synonymous passengers predicted driven by NOTCH1 and TP53 'drivers' (orange dashed line) is close to what is observed (blue diamonds). The total genome-wide annual haploid driver mutation rate that fully explains the abundance of passengers (solid orange line) assuming other 'drivers' follow the same DFE is found to be 1 . 7 ( 95% CI : 1 . 6 -1 . 9 ) fold more than the contribution from nonsynonymous NOTCH1 and TP53 variants alone. The neutral drift prediction is based on the actual ages of the donor samples and Nτ inferred in supplementary note 5B. (B) Relative mutation rates of observed 'drivers' and unobserved 'drivers' in healthy oesophagus. (C) Likelihood plot for the one-parameter fit for the fold of unobserved 'drivers': 0 . 7 ( 95% CI : 0 . 6 -0 . 9 ).
Fig. S17 Synonymous variants in healthy oesophagus. (A) Synonymous SNVs reported in 5 (blue diamonds) are plotted as VAF densities after normalization by 2 µ syn where µ syn =6 . 8 × 10 -4 is the estimated annual haploid synonymous mutation rate across the sequencing panel. The developmental contribution (green line) is small relative to somatic contributions. The abundance of synonymous passengers predicted driven by NOTCH1 and TP53 'drivers' (orange dashed line) is close to what is observed (blue diamonds). The total genome-wide annual haploid driver mutation rate that fully explains the abundance of passengers (solid orange line) assuming other 'drivers' follow the same DFE is found to be 1 . 7 ( 95% CI : 1 . 6 -1 . 9 ) fold more than the contribution from nonsynonymous NOTCH1 and TP53 variants alone. The neutral drift prediction is based on the actual ages of the donor samples and Nτ inferred in supplementary note 5B. (B) Relative mutation rates of observed 'drivers' and unobserved 'drivers' in healthy oesophagus. (C) Likelihood plot for the one-parameter fit for the fold of unobserved 'drivers': 0 . 7 ( 95% CI : 0 . 6 -0 . 9 ).CC-BY-ND · From the PDF
Fig. S18 VAF correlation in healthy oesophagus (A) Green points represent simulated results ( τ =1 year). The highest VAF neutral and driver mutations are recorded in each simulation run ( n =844 , ran twice) with the same age distribution as the Martincorena et al. 5 samples. In the simulations mutation rates correspond to the haploid mutation rates of NOTCH1 and TP53 (with corresponding fitnesses) and the study-specific haploid synonymous mutation rate in Martincorena et al. 5 . The ratio of observed 'drivers' versus unobserved 'drivers' is set to 1 and only mutations above detection limit, i.e. 1% VAF, are recorded. Simulation results show 81 samples harbour at least one detectable neutral mutation. (B) In Martincorena et al., 277 out of 844 samples contain any detected synonymous variants on the sequencing panel. 215 out of these 277 pairs of data lie above the black diagonal ( 215 / 277 = 78% ). Taking into account sampling errors due to finite coverage ∼ 870 x, this fraction ranges from 209 -222 out of 277 ( 75 -80% ). The diagonal dashed lines indicate the upper and lower error due to sampling noise for exactly same VAFs.
Fig. S18 VAF correlation in healthy oesophagus (A) Green points represent simulated results ( τ =1 year). The highest VAF neutral and driver mutations are recorded in each simulation run ( n =844 , ran twice) with the same age distribution as the Martincorena et al. 5 samples. In the simulations mutation rates correspond to the haploid mutation rates of NOTCH1 and TP53 (with corresponding fitnesses) and the study-specific haploid synonymous mutation rate in Martincorena et al. 5 . The ratio of observed 'drivers' versus unobserved 'drivers' is set to 1 and only mutations above detection limit, i.e. 1% VAF, are recorded. Simulation results show 81 samples harbour at least one detectable neutral mutation. (B) In Martincorena et al., 277 out of 844 samples contain any detected synonymous variants on the sequencing panel. 215 out of these 277 pairs of data lie above the black diagonal ( 215 / 277 = 78% ). Taking into account sampling errors due to finite coverage ∼ 870 x, this fraction ranges from 209 -222 out of 277 ( 75 -80% ). The diagonal dashed lines indicate the upper and lower error due to sampling noise for exactly same VAFs.CC-BY-ND · From the PDF
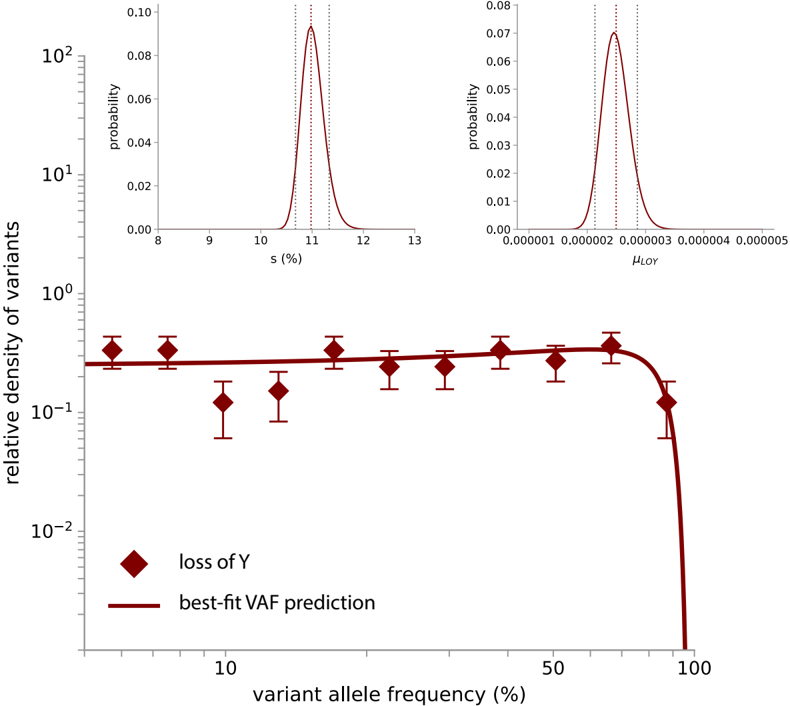
Fig. S19 The best-fit to account for Y-loss mosaicism 29 predicts that loss of Y chromosome occurs at µ LOY =2 . 5 × 10 -6 ( 95% CI = 2 . 1 -2 . 9 × 10 -6 ) per cell per year and with fitness s =11 . 0% per year ( 95% CI = 10 . 7% -11 . 3% ) (for Nτ =1 × 10 5 years). Theories are modified to account for non-diploidy and data is trimmed below VAF 5% . Inset: Likelihood plots of the two-parameter optimization.
Fig. S19 The best-fit to account for Y-loss mosaicism 29 predicts that loss of Y chromosome occurs at µ LOY =2 . 5 × 10 -6 ( 95% CI = 2 . 1 -2 . 9 × 10 -6 ) per cell per year and with fitness s =11 . 0% per year ( 95% CI = 10 . 7% -11 . 3% ) (for Nτ =1 × 10 5 years). Theories are modified to account for non-diploidy and data is trimmed below VAF 5% . Inset: Likelihood plots of the two-parameter optimization.CC-BY-ND · From the PDF

Verification

Claims the paper makes

The claims and statistics of this paper haven’t been checked yet.

Run the check — free, no account needed. It reads the open-access text and checks the sources it cites.

A few free checks a day · papers already verified open instantly · results are public

Claims other papers make about this one

Each is checked against this paper’s own text: does it say what the citing paper says it does?

Self-check

Percentages, sums and reported differences re-computed from the paper’s own numbers.

The self-check needs the paper’s full text.

Citations

Cites

Show all 12 references

Research works printed but not linked: 36

  1. Martincorena, I. et al. Somatic mutant clones colonize the human esophagus with age. Science 362, 911–917 (2018). · DOI · Paper page
  2. Martincorena, I. et al. Universal patterns of selection in cancer and somatic tissues. Cell 171, 1029–1041.e21 (2017). · DOI · Paper page
  3. Young, A. L., Tong, R. S., Birmann, B. M. & Druley, T. E. Clonal haematopoiesis and risk of acute myeloid leukemia. Haematologica https://doi.org/10.3324/haematol.2018.215269 (2019). · DOI
  4. Loh, P.-R. et al. Insights into clonal haematopoiesis from 8,342 mosaic chromosomal alterations. Nature 559, 350–355 (2018). · DOI · Paper page
  5. Loh, P.-R., Genovese, G. & McCarroll, S. A. Monogenic and polygenic inheritance become instruments for clonal selection. Nature https://doi.org/10.1038/s41586-020-2430-6 (2020). · DOI · Paper page
  6. Bolton, K. L. et al. Cancer therapy shapes the fitness landscape of clonal hematopoiesis. Nat. Genet. https://doi.org/10.1038/s41588-020-00710-0 (2020). · DOI · Paper page
  7. Razavi, P. et al. High-intensity sequencing reveals the sources of plasma circulating cell-free DNA variants. Nat. Med. 25, 1928–1937 (2019). · DOI
  8. Williams, M. J. et al. Measuring the distribution of fitness effects in somatic evolution by combining clonal dynamics with dN/dS ratios. eLife 9, e48714 (2020). · DOI
  9. Hess, J. M. et al. Passenger hotspot mutations in cancer. Preprint at bioRxiv https://doi.org/10.1101/675801 (2019). · DOI
  10. Luria, S. E. & Delbrück, M. Mutations of bacteria from virus sensitivity to virus resistance. Genetics 28, 491–511 (1943). · DOI · Paper page
  11. Desai, M. M. & Fisher, D. S. Beneficial mutation–selection balance and the effect of linkage on positive selection. Genetics 176, 1759–1798 (2007). · DOI
  12. Williams, M. J., Werner, B., Barnes, C. P., Graham, T. A. & Sottoriva, A. Identification of neutral tumor evolution across cancer types. Nat. Genet. 48, 238–244 (2016). · DOI
  13. Loeb, L. A. et al. Extensive subclonal mutational diversity in human colorectal cancer and its significance. Proc. Natl Acad. Sci. USA 116, 26863–26872 (2019). · DOI
  14. Blundell, J. R. et al. The dynamics of adaptive genetic diversity during the early stages of clonal evolution. Nat. Ecol. Evol. 3, 293–301 (2019). · DOI
  15. Fusco, D., Gralka, M., Kayser, J., Anderson, A. & Hallatschek, O. Excess of mutational jackpot events in expanding populations revealed by spatial Luria–Delbrück experiments. Nat. Commun. 7, 12760 (2016). · DOI
  16. Schreck, C. F. et al. Impact of crowding on the diversity of expanding populations. Preprint at bioRxiv https://doi.org/10.1101/743534 (2019). · DOI
  17. Lohmueller, K. E. et al. Natural selection affects multiple aspects of genetic variation at putatively neutral sites across the human genome. PLoS Genet. 7, e1002326 (2011). · DOI
  18. Simons, B. D. Deep sequencing as a probe of normal stem cell fate and preneoplasia in human epidermis. Proc. Natl Acad. Sci. USA 113, 128–133 (2016). · DOI
  19. Chapman, M. S. et al. Lineage tracing of human embryonic development and foetal haematopoiesis through somatic mutations. Preprint at bioRxiv https://doi.org/10.1101/2020.05.29.088765 (2020). · DOI
  20. Gao, T. et al. Interplay between chromosomal alterations and gene mutations shapes the evolutionary trajectory of clonal hematopoiesis. Nat. Commun. 12, 338 (2021). · DOI
  21. Danielsson, M. et al. Longitudinal changes in the frequency of mosaic chromosome Y loss in peripheral blood cells of aging men varies profoundly between individuals. Eur. J. Hum. Genet. 28, 349–357 (2020). · DOI
  22. Thompson, D. J. et al. Genetic predisposition to mosaic Y chromosome loss in blood. Nature 575, 652–657 (2019). · DOI
  23. Miyamoto, T., Weissman, I. L. & Akashi, K. AML1/ETO-expressing nonleukemic stem cells in acute myelogenous leukemia with 8;21 chromosomal translocation. Proc. Natl Acad. Sci. USA 97, 7521–7526 (2000). · DOI · Paper page
  24. Corces-Zimmerman, M. R. & Majeti, R. Pre-leukemic evolution of hematopoietic stem cells: the importance of early mutations in leukemogenesis. Leukemia 28, 2276–2282 (2014). · DOI
  25. Khurana, E. et al. Role of non-coding sequence variants in cancer. Nat. Rev. Genet. 17, 93–108 (2016). · DOI
  26. Rheinbay, E. et al. Analyses of non-coding somatic drivers in 2,658 cancer whole genomes. Nature 578, 102–111 (2020). · DOI
  27. Kumar, S. et al. Passenger mutations in more than 2,500 cancer genomes: overall molecular functional impact and consequences. Cell https://doi.org/10.1016/j.cell.2020.01.032 (2020). · DOI
  28. Li, S. et al. Distinct evolution and dynamics of epigenetic and genetic heterogeneity in acute myeloid leukemia. Nat. Med. 22, 792–799 (2016). · DOI
  29. Gebhard, C. et al. Profiling of aberrant DNA methylation in acute myeloid leukemia reveals subclasses of CG-rich regions with epigenetic or genetic association. Leukemia 33, 26–36 (2019). · DOI
  30. Gerstung, M. et al. The evolutionary history of 2,658 cancers. Nature 578, 122–128 (2020). · DOI · Paper page
  31. Liu, X. et al. Genetic alterations in esophageal tissues from squamous dysplasia to carcinoma. Gastroenterology 153, 166–177 (2017). · DOI
  32. Colom, B. et al. Spatial competition shapes the dynamic mutational landscape of normal esophageal epithelium. Nat. Genet. https://doi.org/10.1038/s41588-020-0624-3 (2020). · DOI
  33. Supek, F., Miñana, B., Valcárcel, J., Gabaldón, T. & Lehner, B. Synonymous mutations frequently act as driver mutations in human cancers. Cell 156, 1324–1335 (2014). · DOI
  34. Sharma, Y. et al. A pan-cancer analysis of synonymous mutations. Nat. Commun. 10, 2569 (2019). · DOI
  35. Supek, F., Skunca, N., Repar, J., Vlahovicek, K. & Smuc, T. Translational selection is ubiquitous in prokaryotes. PLoS Genet. 6, e1001004 (2010). · DOI
  36. Drummond, D. A. & Wilke, C. O. Mistranslation-induced protein misfolding as a dominant constraint on coding-sequence evolution. Cell 134, 341–352 (2008). · DOI

Cited by

See all 65

Metadata

Authors
Poon, G. Y. P., Watson, C. J., Fisher, D. S., & Blundell, J. R.
Venue
Nature Genetics
Published
2021-11
Volume
53
Issue
11
Pages
1597-1605
ISSN
  • 1061-4036
  • 1546-1718
Cited by
65
References
12
Language
en
Funders
  • Cancer Research UK (G102334)
  • RCUK | Medical Research Council (RG99037)
  • National Science Foundation (PHY-1545840)

About these checks

Registry, retraction, Cites and statistics results are computed, not judged, with one exception: a printed reference that no index lists is read once by a model before it counts as a citation error. Claims are extracted by a model and kept only when their quote appears verbatim in the text; each cited source is then checked, with a model’s help, for whether it says what the claim relies on. Those verdicts can be wrong — read the claim’s quote and the cited source before relying on one.

Statistics and arithmetic are recomputed, not judged.

Confidence bands are shown only for fields calibrated on our annotated test set. None is calibrated yet, so no band is shown.

What counts as a claim ›How we measure confidence ›How we check this ›

Are you an author, or do you see a problem with this page? Request a review

How to cite

Cite CoChat for the checks on this page, and the paper for its own findings.

This page
CoChat. (2026). Citation check: Synonymous mutations reveal genome-wide levels of positive selection in healthy tissues. https://app.cochat.ai/papers/10.1038/s41588-021-00957-1
The paper
Poon, G. Y. P., Watson, C. J., Fisher, D. S., & Blundell, J. R. (2021). Synonymous mutations reveal genome-wide levels of positive selection in healthy tissues. Nature Genetics. https://doi.org/10.1038/s41588-021-00957-1