Student or educator? Sign up with your school email and get 6 months of Pro free.
Cited by 132

The DOI matches its Crossref record; 6 of the 6 references it cites were found in a registry or an index.

Multiparameter prediction of myeloid neoplasia risk

Gu, Muxin, Kovilakam, Sruthi Cheloor, Dunn, William G., Marando, Ludovica, Barcena, Clea, Mohorianu, Irina, Smith, Alexandra, Kar, Siddhartha P., Fabre, Margarete A., Gerstung, Moritz, Cargo, Catherine A., Malcovati, Luca, Quiros, Pedro M., Vassiliou, George S.·2023·Nature Genetics

Abstract

The myeloid neoplasms encompass acute myeloid leukemia, myelodysplastic syndromes and myeloproliferative neoplasms. Most cases arise from the shared ancestor of clonal hematopoiesis (CH). Here we analyze data from 454,340 UK Biobank participants, of whom 1,808 developed a myeloid neoplasm 0–15 years after recruitment. We describe the differences in CH mutational landscapes and hematology/biochemistry test parameters among individuals that later develop myeloid neoplasms (pre-MN) versus controls, finding that disease-specific changes are detectable years before diagnosis. By analyzing differences between ‘pre-MN’ and controls, we develop and validate Cox regression models quantifying the risk of progression to each myeloid neoplasm subtype. We construct ‘MN-predict’, a web application that generates time-dependent predictions with the input of basic blood tests and genetic data. Our study demonstrates that many individuals that develop myeloid neoplasms can be identified years in advance and provides a framework for disease-specific prognostication that will be of substantial use to researchers and physicians.

Overview

The claims and statistics of this paper haven’t been checked yet.

Run the check — free, no account needed. It reads the open-access text and checks the sources it cites.

A few free checks a day · papers already verified open instantly · results are public

Integrity signals

Registry

Crossref · 10.1038/s41588-023-01472-1

Cites

6 of 6 references verified0 citation errors · 0 not checkable

Statistics

Figures

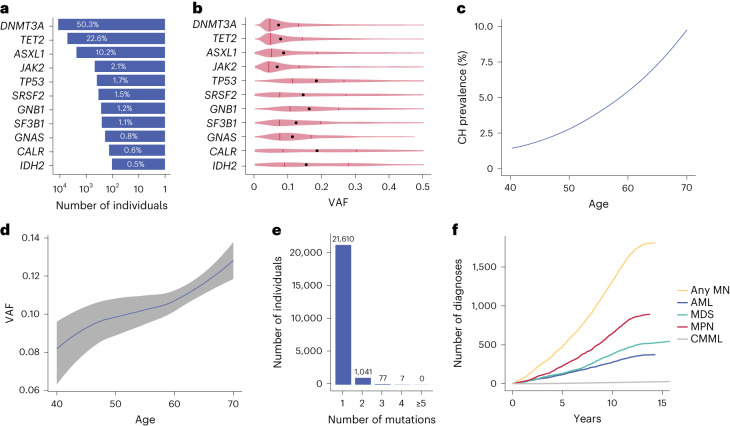
Fig. 1 Summary of driver mutations in the 11 most commonly mutated genes in CH. a, Percentages of cases per driver gene among the 22,735 UKB participants with CH. b, Distribution of clone sizes (VAF) by driver mutation. Medians are depicted by black dots and upper/lower quartiles by vertical lines. c, Rising prevalence of CH mutations with advancing age. d, Increase in size (VAF) of CH clones with advancing age. The line follows the mean of VAFs in each integral age group and the gray area indicates the 5–95% confidence interval estimated by Student’s t-distribution. LASSO regression was used to smoothen the curves in c and d. e, Number of individuals with 1, 2, 3, 4 and ≥5 driver mutations. f, Cumulative incidence of different types of myeloid neoplasms in the UKB.
Fig. 1 Summary of driver mutations in the 11 most commonly mutated genes in CH. a, Percentages of cases per driver gene among the 22,735 UKB participants with CH. b, Distribution of clone sizes (VAF) by driver mutation. Medians are depicted by black dots and upper/lower quartiles by vertical lines. c, Rising prevalence of CH mutations with advancing age. d, Increase in size (VAF) of CH clones with advancing age. The line follows the mean of VAFs in each integral age group and the gray area indicates the 5–95% confidence interval estimated by Student’s t-distribution. LASSO regression was used to smoothen the curves in c and d. e, Number of individuals with 1, 2, 3, 4 and ≥5 driver mutations. f, Cumulative incidence of different types of myeloid neoplasms in the UKB.CC BY · PubMed Central
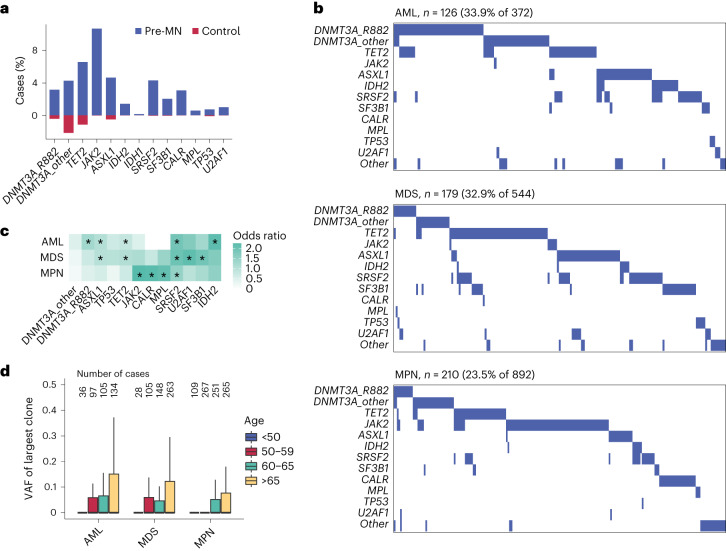
Fig. 2 Driver mutations in pre-MN individuals who later developed myeloid neoplasms. a, Prevalence of common CH driver gene mutations among UKB participants that developed a myeloid neoplasm (pre-MN) compared with controls. b, Waterfall plots of mutation profiles in 126 pre-AML, 179 pre-MDS (including pre-CMML) and 210 pre-MPN cases. Each column represents a different pre-MN participant. c, Associations between the risk for different types of MN and common driver gene mutations (Fisher’s test, *P < 10−10; see Supplementary Table 10 for details). d, Distribution of clone sizes among different pre-MNs by advancing age. In the box plots, central lines indicate medians, boxes indicate 25–75% quantiles and ranges indicate 1.5 interquartile ranges from the upper or lower quartiles. The numbers of cases in each age bracket are indicated above the box plots.
Fig. 2 Driver mutations in pre-MN individuals who later developed myeloid neoplasms. a, Prevalence of common CH driver gene mutations among UKB participants that developed a myeloid neoplasm (pre-MN) compared with controls. b, Waterfall plots of mutation profiles in 126 pre-AML, 179 pre-MDS (including pre-CMML) and 210 pre-MPN cases. Each column represents a different pre-MN participant. c, Associations between the risk for different types of MN and common driver gene mutations (Fisher’s test, *P < 10−10; see Supplementary Table 10 for details). d, Distribution of clone sizes among different pre-MNs by advancing age. In the box plots, central lines indicate medians, boxes indicate 25–75% quantiles and ranges indicate 1.5 interquartile ranges from the upper or lower quartiles. The numbers of cases in each age bracket are indicated above the box plots.CC BY · PubMed Central
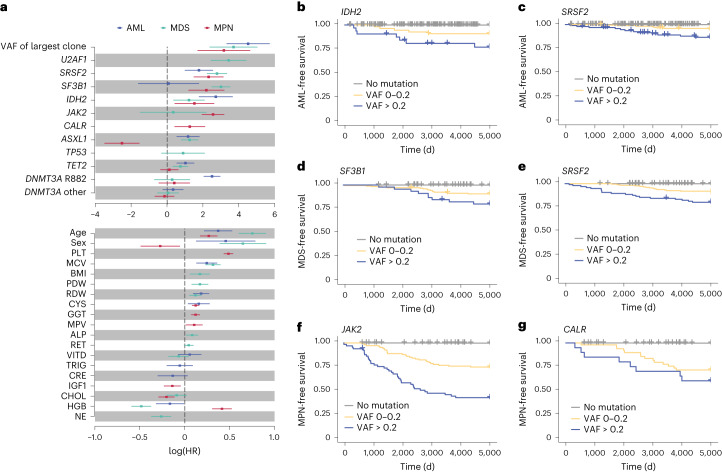
Fig. 3 Impact of individual prognostic parameters on myeloid neoplasm prediction. a, HRs for AML, MDS and MPN, by gene mutation and blood test parameter. The central squares indicate HRs and the lines indicate 5–95% confidence intervals. Only parameters selected by stepwise multivariate regression for inclusion into the relevant model are plotted. b–g, Kaplan–Meier curves of the most significant genetic predictors by VAF of the driver mutation: IDH2 and AML-free survival (b); SRSF2 and AML-free survival (c); SF3B1 and MDS-free survival (d); SRSF2 and MDS-free survival (e); JAK2 and MPN-free survival (f) and CALR and MPN-free survival (g). PDW, platelet distribution width; RDW, red cell distribution width; CYS, cystatin-C (serum); GGT, γ-glutamyl transferase (serum); MPV, mean platelet volume; ALP, alkaline phosphatase (serum); VITD, vitamin D (serum); TRIG, triglyceride concentration (serum); CRE, creatinine (serum); IGF1, insulin-like growth factor 1 concentration; NE, neutrophil count.
Fig. 3 Impact of individual prognostic parameters on myeloid neoplasm prediction. a, HRs for AML, MDS and MPN, by gene mutation and blood test parameter. The central squares indicate HRs and the lines indicate 5–95% confidence intervals. Only parameters selected by stepwise multivariate regression for inclusion into the relevant model are plotted. b–g, Kaplan–Meier curves of the most significant genetic predictors by VAF of the driver mutation: IDH2 and AML-free survival (b); SRSF2 and AML-free survival (c); SF3B1 and MDS-free survival (d); SRSF2 and MDS-free survival (e); JAK2 and MPN-free survival (f) and CALR and MPN-free survival (g). PDW, platelet distribution width; RDW, red cell distribution width; CYS, cystatin-C (serum); GGT, γ-glutamyl transferase (serum); MPV, mean platelet volume; ALP, alkaline phosphatase (serum); VITD, vitamin D (serum); TRIG, triglyceride concentration (serum); CRE, creatinine (serum); IGF1, insulin-like growth factor 1 concentration; NE, neutrophil count.CC BY · PubMed Central
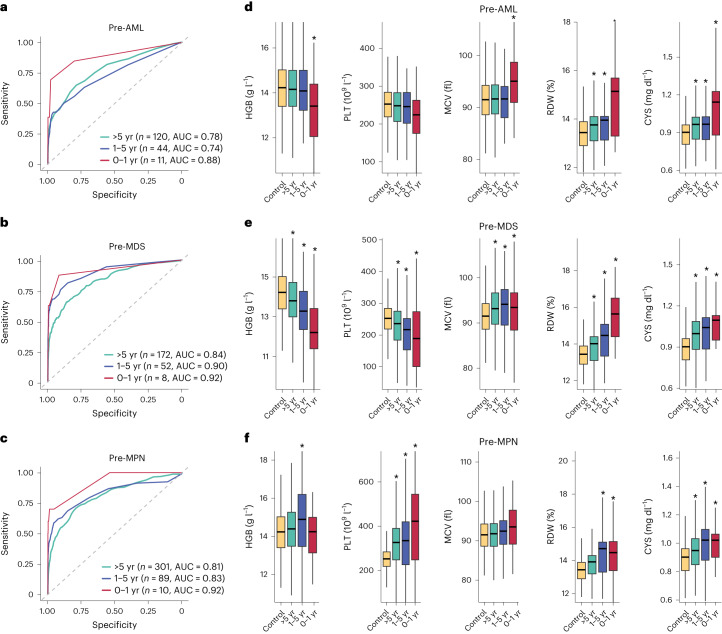
Fig. 4 Time-dependency of predictive models and blood parameters in relation to myeloid neoplasm diagnosis. a–c, Time-dependent ROC curves computed using predicted outcomes on the validation set versus clinical diagnoses of myeloid neoplasm in 0–1 year, 1–5 years and over 5 years after blood sampling in pre-AML (a), pre-MDS (b) and pre-MPN (c) participants. ROC curves were computed using the incident/dynamic method (see Methods for details); n = number of individuals with the relevant diagnosis in the validation set. d–f, Impact of time to diagnosis on the distribution of HGB, PLT, MCV, RDW and CYS in pre-AML (d), pre-MDS (e) and pre-MPN (f) participants, respectively, compared with controls. (*P < 0.05 Wilcoxon rank-sum test; see Supplementary Table 10 for details). In the box plots, central lines indicate medians, boxes indicate 25–75% quantiles and ranges indicate 1.5 interquartile ranges from the upper or lower quartiles.
Fig. 4 Time-dependency of predictive models and blood parameters in relation to myeloid neoplasm diagnosis. a–c, Time-dependent ROC curves computed using predicted outcomes on the validation set versus clinical diagnoses of myeloid neoplasm in 0–1 year, 1–5 years and over 5 years after blood sampling in pre-AML (a), pre-MDS (b) and pre-MPN (c) participants. ROC curves were computed using the incident/dynamic method (see Methods for details); n = number of individuals with the relevant diagnosis in the validation set. d–f, Impact of time to diagnosis on the distribution of HGB, PLT, MCV, RDW and CYS in pre-AML (d), pre-MDS (e) and pre-MPN (f) participants, respectively, compared with controls. (*P < 0.05 Wilcoxon rank-sum test; see Supplementary Table 10 for details). In the box plots, central lines indicate medians, boxes indicate 25–75% quantiles and ranges indicate 1.5 interquartile ranges from the upper or lower quartiles.CC BY · PubMed Central
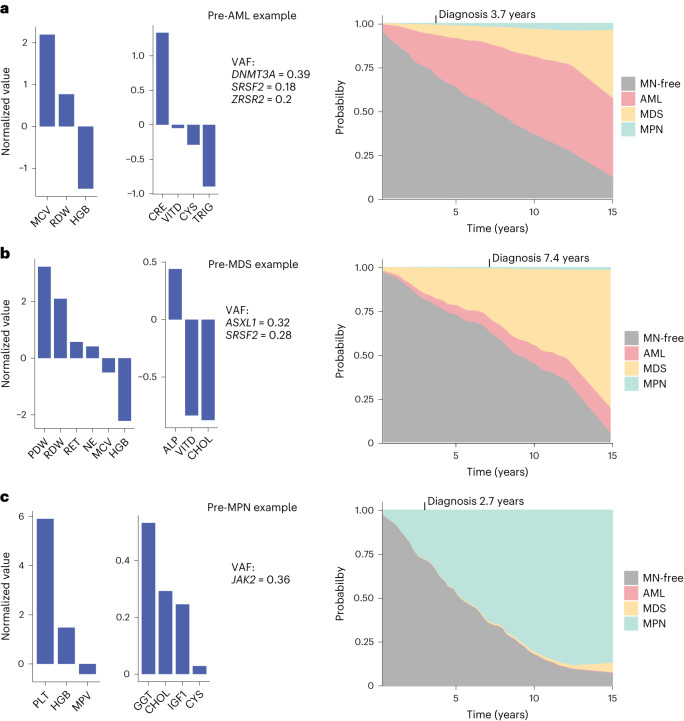
Fig. 5 MN-predict, a web-based platform for quantification of future risk of developing myeloid neoplasms. a–c, Examples of predictions of MN risk by MN-predict in three individuals who went on to develop AML after 3.7 years (a), MDS after 7.4 years (b) and MPN after 2.7 years (c), respectively. The predictions were derived using three separate Cox regression models for predicting AML, MDS and MPN. In each panel, the values of input parameters for the model relevant to the downstream diagnosis are shown on the left (gene mutations, highest VAF and blood tests results depicted as normalized values relative to the median on a log scale) and the actual predictions on the right. The probability of different outcomes is represented by the vertical height of the corresponding color at any given time.
Fig. 5 MN-predict, a web-based platform for quantification of future risk of developing myeloid neoplasms. a–c, Examples of predictions of MN risk by MN-predict in three individuals who went on to develop AML after 3.7 years (a), MDS after 7.4 years (b) and MPN after 2.7 years (c), respectively. The predictions were derived using three separate Cox regression models for predicting AML, MDS and MPN. In each panel, the values of input parameters for the model relevant to the downstream diagnosis are shown on the left (gene mutations, highest VAF and blood tests results depicted as normalized values relative to the median on a log scale) and the actual predictions on the right. The probability of different outcomes is represented by the vertical height of the corresponding color at any given time.CC BY · PubMed Central
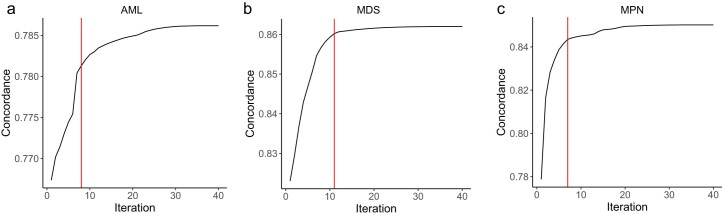
Extended Data Fig. 1 Feature selection in different pre-MN models using stepwise regression. Improvement in concordance by the stepwise addition of predictive variables to the core Cox regression model for developing disease-specific Cox regression models for: (a) AML, (b) MDS and (c) MPN. Variables were added one at a time, such that each iteration resulted in the greatest improvement in concordance index until the increase in concordance <0.1% of the maximum increase of all iterations. The iterations (that is number of additional variables) used in the final models are indicated by the red lines.
Extended Data Fig. 1 Feature selection in different pre-MN models using stepwise regression. Improvement in concordance by the stepwise addition of predictive variables to the core Cox regression model for developing disease-specific Cox regression models for: (a) AML, (b) MDS and (c) MPN. Variables were added one at a time, such that each iteration resulted in the greatest improvement in concordance index until the increase in concordance <0.1% of the maximum increase of all iterations. The iterations (that is number of additional variables) used in the final models are indicated by the red lines.CC BY · PubMed Central
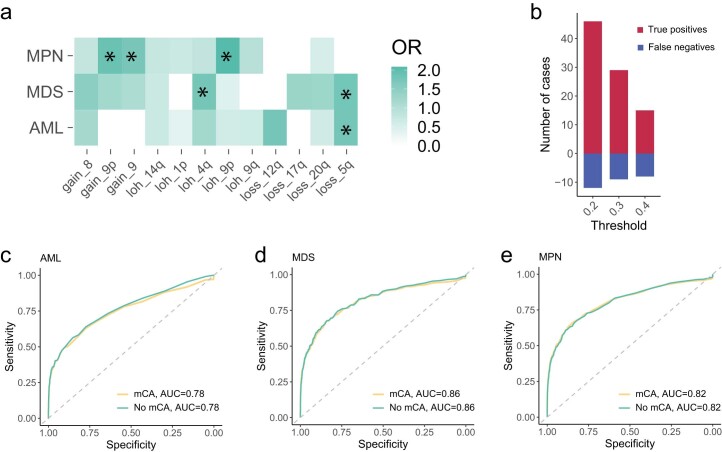
Extended Data Fig. 2 Impact of mosaic chromosomal abnormalities on MN prediction models. (a) Associations between the risk for different types of MN and mosaic chromosomal alterations (mCA, * = Fisher’s test p < 10−5, see Supplementary Table 10 for details; OR = odds ratio). (b) Number of true pre-MN cases whose prediction changed by the inclusion of mCAs to the models. We calculated differences between 15-year MN-free survival probabilities of models including mCAs (with mCA) vs excluding mCAs (without mCA). We then tested three thresholds for the difference in MN probability between the two models. The lowest probability difference of 0.2 led to the correct identification of an additional ~45 pre-MN cases (true positives), at the expense of missing 12 such cases (false negatives). Higher difference thresholds still identified more true positives than false negatives. (c–e) Inclusion of mCA to our MN prediction models did not significantly improve model performance as assessed by area under curve (AUC) of recover operating curve for (c) AML, (d) MDS or (e) MPN. Dotted diagonal lines indicate AUC = 0.5.
Extended Data Fig. 2 Impact of mosaic chromosomal abnormalities on MN prediction models. (a) Associations between the risk for different types of MN and mosaic chromosomal alterations (mCA, * = Fisher’s test p < 10−5, see Supplementary Table 10 for details; OR = odds ratio). (b) Number of true pre-MN cases whose prediction changed by the inclusion of mCAs to the models. We calculated differences between 15-year MN-free survival probabilities of models including mCAs (with mCA) vs excluding mCAs (without mCA). We then tested three thresholds for the difference in MN probability between the two models. The lowest probability difference of 0.2 led to the correct identification of an additional ~45 pre-MN cases (true positives), at the expense of missing 12 such cases (false negatives). Higher difference thresholds still identified more true positives than false negatives. (c–e) Inclusion of mCA to our MN prediction models did not significantly improve model performance as assessed by area under curve (AUC) of recover operating curve for (c) AML, (d) MDS or (e) MPN. Dotted diagonal lines indicate AUC = 0.5.CC BY · PubMed Central
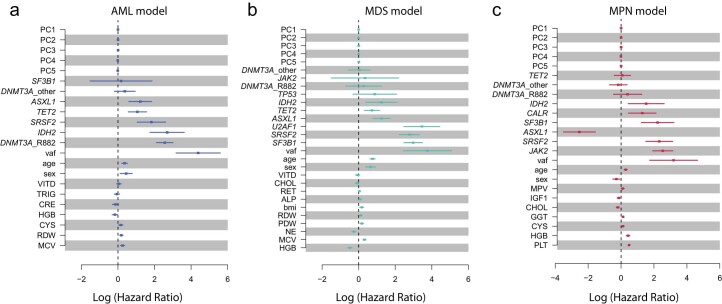
Extended Data Fig. 3 Genetic ancestry does not have a major impact on MN prediction models. Hazard ratios (HRs) associated with predictive variables, after incorporation of the first five principal components of genetic ancestry (PC1-PC5) into MN predictive models for: (a) AML, (b) MDS and (c) MPN. The plots show that ancestry has a negligible impact on these models, with HRs close to 1 (Log1 = 0). Central squares indicate estimated HRs and lines represent the 5–95% confidence intervals. VAF = variant allele frequency of the largest clone. The central squares indicate hazard ratios and the lines indicate 5–95% confidence intervals. Vertical dotted lines indicate HR = 1. Abbreviations for blood/biochemistry parameters are defined in Supplementary Table 5.
Extended Data Fig. 3 Genetic ancestry does not have a major impact on MN prediction models. Hazard ratios (HRs) associated with predictive variables, after incorporation of the first five principal components of genetic ancestry (PC1-PC5) into MN predictive models for: (a) AML, (b) MDS and (c) MPN. The plots show that ancestry has a negligible impact on these models, with HRs close to 1 (Log1 = 0). Central squares indicate estimated HRs and lines represent the 5–95% confidence intervals. VAF = variant allele frequency of the largest clone. The central squares indicate hazard ratios and the lines indicate 5–95% confidence intervals. Vertical dotted lines indicate HR = 1. Abbreviations for blood/biochemistry parameters are defined in Supplementary Table 5.CC BY · PubMed Central
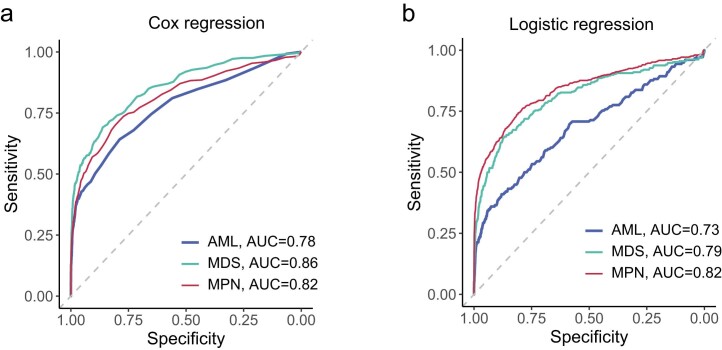
Extended Data Fig. 4 Comparison of Cox to logistic regression models for MN prediction. (a) Recover operating curve (ROC) curves from Cox proportional hazard models for prediction of progression to AML, MDS and MPN. (b) ROC curves from logistic regression models. To make the models comparable, we used MN outcomes at any time to the end of the study to compute ROC curves. AUC = area under curve. Dotted diagonal lines indicate AUC = 0.5.
Extended Data Fig. 4 Comparison of Cox to logistic regression models for MN prediction. (a) Recover operating curve (ROC) curves from Cox proportional hazard models for prediction of progression to AML, MDS and MPN. (b) ROC curves from logistic regression models. To make the models comparable, we used MN outcomes at any time to the end of the study to compute ROC curves. AUC = area under curve. Dotted diagonal lines indicate AUC = 0.5.CC BY · PubMed Central
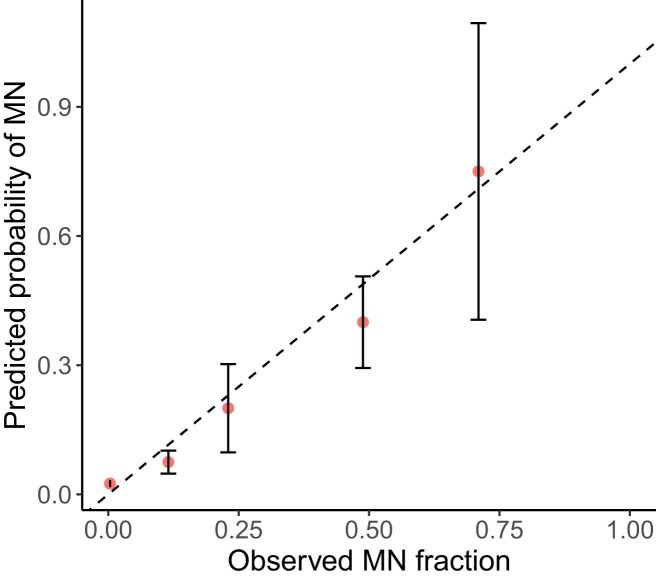
Extended Data Fig. 5 Close agreement between prediction and actual incidence of MN. Comparison of the predicted probability of developing any MN with the observed MN incidence in the UKB validation cohort of 207,039 individuals at any time during the follow-up/observation period (dots showing the mean and error bars showing 1.96 standard deviations that is 5–95% CI). Samples were binned according to predicted probability ranges as follows: 0–0.05, 0.05–0.1, 0.1–0.3, 0.3–0.5 and 0.5–1. Individuals who died during the observation period without having developed MN were not included in the calculations. The plot shows close agreement (along the dotted line y = x) between prediction and observed incidence.
Extended Data Fig. 5 Close agreement between prediction and actual incidence of MN. Comparison of the predicted probability of developing any MN with the observed MN incidence in the UKB validation cohort of 207,039 individuals at any time during the follow-up/observation period (dots showing the mean and error bars showing 1.96 standard deviations that is 5–95% CI). Samples were binned according to predicted probability ranges as follows: 0–0.05, 0.05–0.1, 0.1–0.3, 0.3–0.5 and 0.5–1. Individuals who died during the observation period without having developed MN were not included in the calculations. The plot shows close agreement (along the dotted line y = x) between prediction and observed incidence.CC BY · PubMed Central
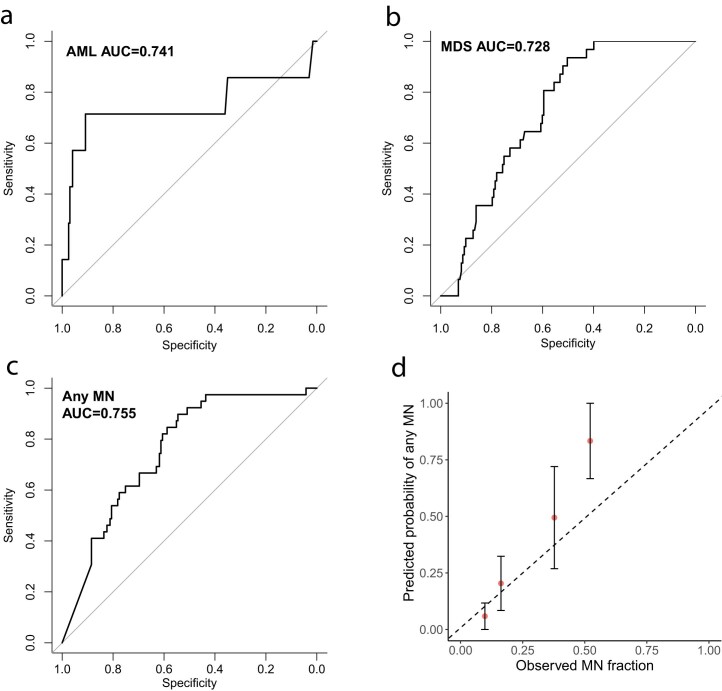
Extended Data Fig. 6 Validation of models on the Leeds CCUS cohort. (a-c) Receiver Operating Characteristics (ROC) curves of the independent cohort computed from predicted probabilities in 5 years versus clinical diagnosis of individuals who developed MN within 5 years after blood sampling. AUC=area under curve. (a) AML model. (b) MDS model. (c) ROC curves of combined probabilities of any MN versus clinical diagnosis. Diagonal lines indicate AUC = 0.5. (d) Comparison of the predicted probability of developing any MN in the next 5 years with the observed MN diagnosed at any time during the follow-up period (dots showing the mean and error bars showing 1.96 standard deviations that is 5–95% CI). Individuals who died before the end of the follow-up period without developing any MN were excluded from the calculation.
Extended Data Fig. 6 Validation of models on the Leeds CCUS cohort. (a-c) Receiver Operating Characteristics (ROC) curves of the independent cohort computed from predicted probabilities in 5 years versus clinical diagnosis of individuals who developed MN within 5 years after blood sampling. AUC=area under curve. (a) AML model. (b) MDS model. (c) ROC curves of combined probabilities of any MN versus clinical diagnosis. Diagonal lines indicate AUC = 0.5. (d) Comparison of the predicted probability of developing any MN in the next 5 years with the observed MN diagnosed at any time during the follow-up period (dots showing the mean and error bars showing 1.96 standard deviations that is 5–95% CI). Individuals who died before the end of the follow-up period without developing any MN were excluded from the calculation.CC BY · PubMed Central
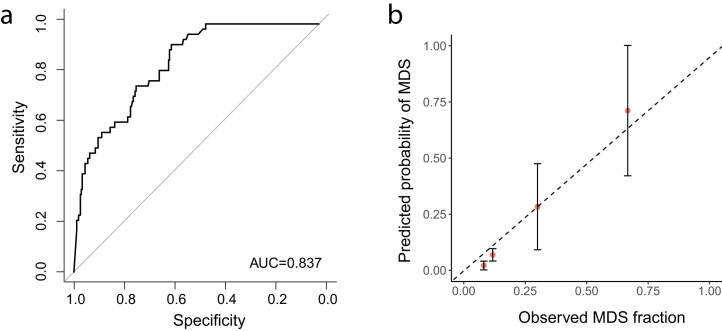
Extended Data Fig. 7 Validation of MDS model on the Pavia CCUS cohort. (a) ROC curve of Cox proportional hazard model for MDS prediction established from predicted 15-year probability of developing MDS and diagnosis by the end of the 15-year follow-up period. AUC = area under curve. Diagonal line indicates AUC = 0.5. (b) Comparison of the predicted MDS probability and observed MDS incident at any time during the follow-up period (dots showing the mean and error bars showing 1.96 standard deviations that is 5–95% CI). Individuals who died before the end of the follow-up period without developing any MDS were excluded from the calculation. Dotted line shows y = x.
Extended Data Fig. 7 Validation of MDS model on the Pavia CCUS cohort. (a) ROC curve of Cox proportional hazard model for MDS prediction established from predicted 15-year probability of developing MDS and diagnosis by the end of the 15-year follow-up period. AUC = area under curve. Diagonal line indicates AUC = 0.5. (b) Comparison of the predicted MDS probability and observed MDS incident at any time during the follow-up period (dots showing the mean and error bars showing 1.96 standard deviations that is 5–95% CI). Individuals who died before the end of the follow-up period without developing any MDS were excluded from the calculation. Dotted line shows y = x.CC BY · PubMed Central

Verification

Claims the paper makes

The claims and statistics of this paper haven’t been checked yet.

Run the check — free, no account needed. It reads the open-access text and checks the sources it cites.

A few free checks a day · papers already verified open instantly · results are public

Claims other papers make about this one

Each is checked against this paper’s own text: does it say what the citing paper says it does?

Self-check

Percentages, sums and reported differences re-computed from the paper’s own numbers.

The self-check needs the paper’s full text.

Citations

Cites

Show all 6 references

Research works printed but not linked: 21

  1. Roman, E. et al. Myeloid malignancies in the real-world: occurrence, progression and survival in the UK’s population-based Haematological Malignancy Research Network 2004–15. Cancer Epidemiol. 42, 186–198 (2016). · DOI
  2. Maynadie, M. et al. Survival of European patients diagnosed with myeloid malignancies: a HAEMACARE study. Haematologica 98, 230–238 (2013). · DOI
  3. Xie, M. et al. Age-related mutations associated with clonal hematopoietic expansion and malignancies. Nat. Med. 20, 1472–1478 (2014). · DOI · Paper page
  4. Sellar, R. S., Jaiswal, S. & Ebert, B. L. Predicting progression to AML. Nat. Med. 24, 904–906 (2018). · DOI
  5. Tam, V. et al. Benefits and limitations of genome-wide association studies. Nat. Rev. Genet. 20, 467–484 (2019). · DOI
  6. Thompson, D. J. et al. Genetic predisposition to mosaic Y chromosome loss in blood. Nature 575, 652–657 (2019). · DOI
  7. Kar, S. P. et al. Genome-wide analyses of 200,453 individuals yield new insights into the causes and consequences of clonal hematopoiesis. Nat. Genet. 54, 1155–1166 (2022). · DOI · Paper page
  8. Vlasschaert, C. et al. A practical approach to curate clonal hematopoiesis of indeterminate potential in human genetic datasets. Blood https://doi.org/10.1182/blood.2022018825 (2023). · DOI
  9. Miller, C. A. et al. Failure to detect mutations in U2AF1 due to changes in the GRCh38 reference sequence. J. Mol. Diagn. 24, 219–223 (2022). · DOI
  10. Arber, D. A. et al. International consensus classification of myeloid neoplasms and acute leukemias: integrating morphologic, clinical, and genomic data. Blood 140, 1200–1228 (2022). · DOI · Paper page
  11. McKerrell, T. et al. JAK2 V617F hematopoietic clones are present several years prior to MPN diagnosis and follow different expansion kinetics. Blood Adv. 1, 968–971 (2017). · DOI
  12. Niroula, A. et al. Distinction of lymphoid and myeloid clonal hematopoiesis. Nat. Med. 27, 1921–1927 (2021). · DOI
  13. Uckelmann, H. J. et al. Therapeutic targeting of preleukemia cells in a mouse model of NPM1 mutant acute myeloid leukemia. Science 367, 586–590 (2020). · DOI
  14. Cordua, S. et al. Prevalence and phenotypes of JAK2 V617F and calreticulin mutations in a Danish general population. Blood 134, 469–479 (2019). · DOI
  15. Hultcrantz, M. et al. Incidence of myeloproliferative neoplasms—trends by subgroup and age in a population-based study in Sweden. J. Intern. Med. 287, 448–454 (2020). · DOI
  16. Weeks, L. D. et al. Prediction of risk for myeloid malignancy in clonal hematopoiesis. NEJM Evid., https://doi.org/10.1056/EVIDoa2200310 (2023). · DOI · Paper page
  17. Fry, A. et al. Comparison of sociodemographic and health-related characteristics of UK Biobank participants with those of the general population. Am. J. Epidemiol. 186, 1026–1034 (2017). · DOI · Paper page
  18. Quiros, P. M., Gu, M., Barcena, C., Iyer, V. & Vassiliou, G. S. NPM1 gene mutations can be confidently identified in blood DNA months before de novo AML onset. Blood Adv. 6, 2409–2413 (2022). · DOI
  19. Loh, P. R., Genovese, G. & McCarroll, S. A. Monogenic and polygenic inheritance become instruments for clonal selection. Nature 584, 136–141 (2020). · DOI · Paper page
  20. Khoury, J. D. et al. The 5th edition of the World Health Organization classification of haematolymphoid tumours: myeloid and histiocytic/dendritic neoplasms. Leukemia 36, 1703–1719 (2022). · DOI · Paper page
  21. Harrell, F. E. Jr., Califf, R. M., Pryor, D. B., Lee, K. L. & Rosati, R. A. Evaluating the yield of medical tests. JAMA 247, 2543–2546 (1982). · DOI · Paper page

Cited by

Metadata

Authors
Gu, M., Kovilakam, S. C., Dunn, W. G., Marando, L., Barcena, C., Mohorianu, I., Smith, A., Kar, S. P., Fabre, M. A., Gerstung, M., Cargo, C. A., Malcovati, L., Quiros, P. M., & Vassiliou, G. S.
Venue
Nature Genetics
Published
2023-08-24
Volume
55
Issue
9
Pages
1523-1530
ISSN
  • 1061-4036
  • 1546-1718
Cited by
132
References
6
Language
en

About these checks

Registry, retraction, Cites and statistics results are computed, not judged, with one exception: a printed reference that no index lists is read once by a model before it counts as a citation error. Claims are extracted by a model and kept only when their quote appears verbatim in the text; each cited source is then checked, with a model’s help, for whether it says what the claim relies on. Those verdicts can be wrong — read the claim’s quote and the cited source before relying on one.

Statistics and arithmetic are recomputed, not judged.

Confidence bands are shown only for fields calibrated on our annotated test set. None is calibrated yet, so no band is shown.

What counts as a claim ›How we measure confidence ›How we check this ›

Are you an author, or do you see a problem with this page? Request a review