

The DOI matches its Crossref record; 76 of the 79 references it cites were found in a registry or an index; none of the 60 sources its claims cite is checked for support yet.
Germline genetic variation impacts clonal hematopoiesis landscape and progression to malignancy
Open accessAbstract
With age, clonal expansions occur pervasively across normal tissues yet only in rare instances lead to cancer, despite being driven by well-established cancer drivers. Characterization of the factors that influence clonal progression is needed to inform interventional approaches. Germline genetic variation influences cancer risk and shapes tumor mutational profile, but its influence on the mutational landscape of normal tissues is not well known. Here we studied the impact of germline genetic variation on clonal hematopoiesis (CH) in 731,835 individuals. We identified 22 new CH-predisposition genes, most of which predispose to CH driven by specific mutational events. CH-predisposition genes contribute to unique somatic landscapes, reflecting the influence of germline genetic backdrop on gene-specific CH fitness. Correspondingly, somatic–germline interactions influence the risk of CH progression to hematologic malignancies. These results demonstrate that germline genetic variation influences somatic evolution in the blood, findings that likely extend to other tissues. The relationship between pathogenic germline variation, clonal hematopoiesis (CH) and risk of hematologic malignancy is explored in 731,835 individuals across 6 cohorts. Carriers of variants in certain genes show distinct patterns of CH and increased risk of CH progression to malignancy.
Overview
CoChat Summary
Written by AI from the paper’s full text.
TL;DR
In 731,835 individuals across six cohorts, germline pathogenic variants in cancer predisposition genes shaped the clonal hematopoiesis (CH) landscape and influenced progression to hematologic malignancy. The study identifies new CH-predisposition genes and shows that germline–somatic interactions stratify hematologic cancer risk.
Key findings
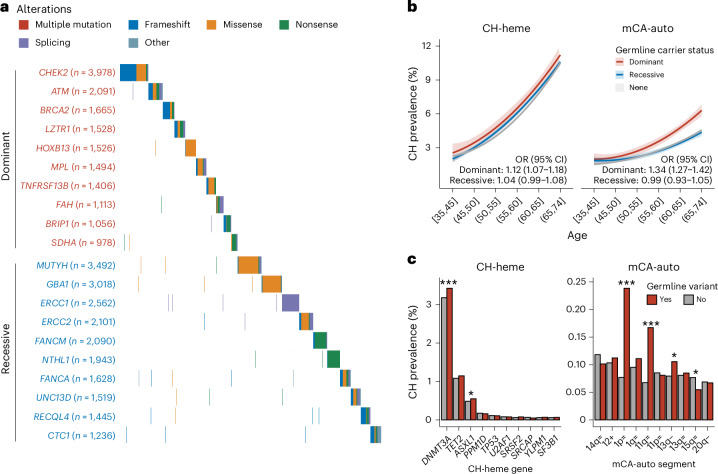
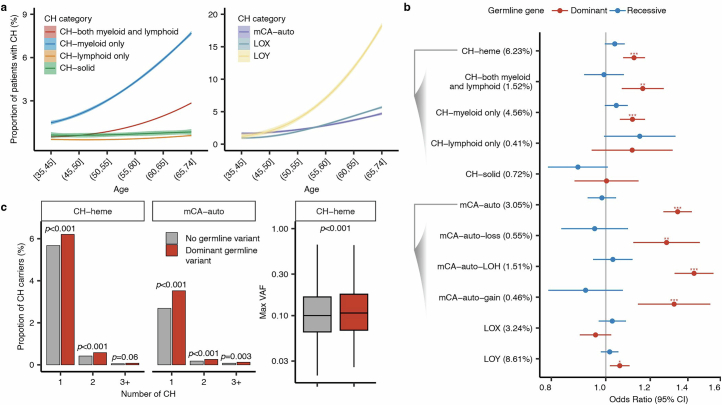
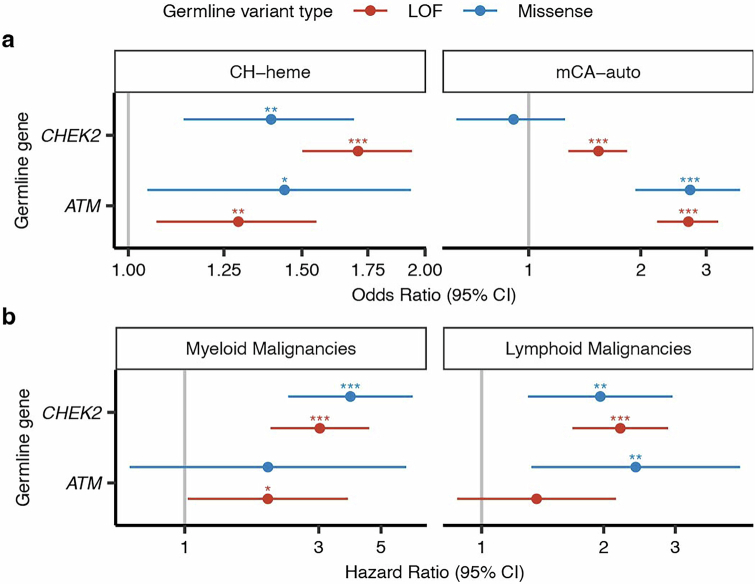
- Among 428,530 UK Biobank participants, 6.2% had CH in a hematologic malignancy driver gene (CH-heme) and 0.7% in a solid tumor driver gene; mCA-auto prevalence was 3.1%, LOX 3.2% and LOY 8.6%. Germline carriers had higher CH-heme and mCA-auto risk, driven mainly by dominantly inherited variants.
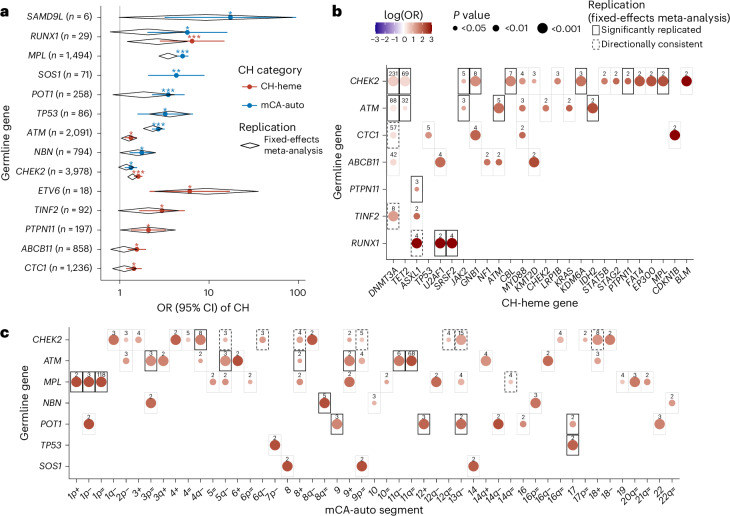
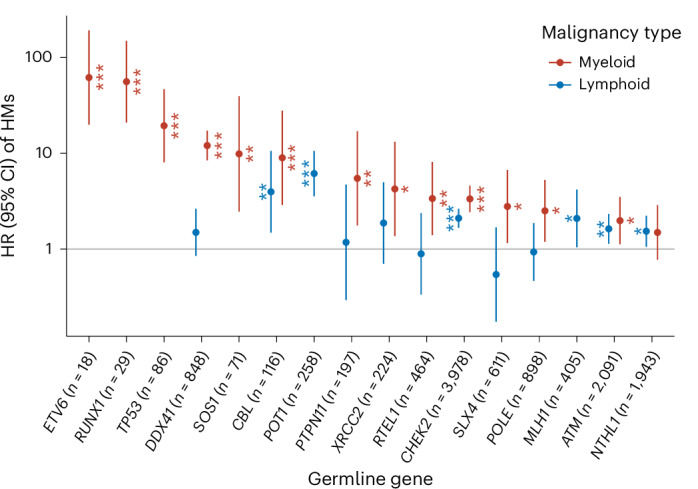
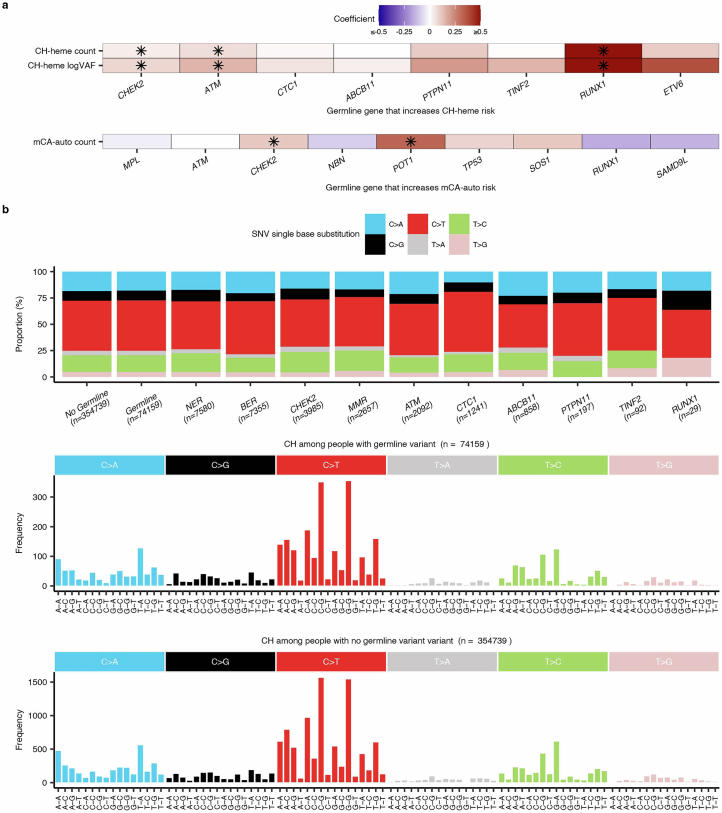
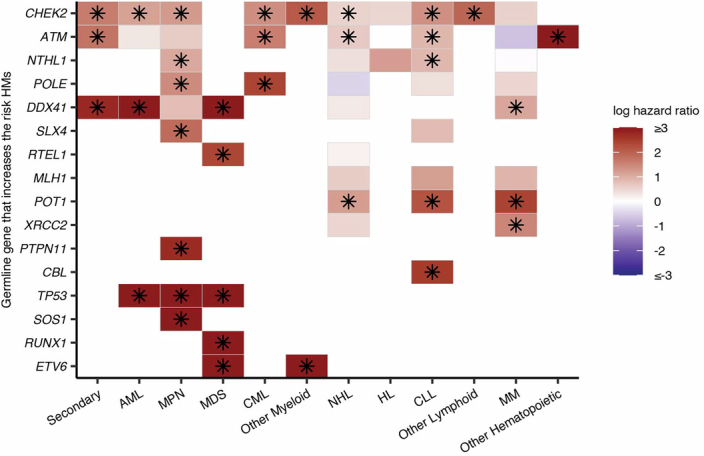
- The UKBB analysis identified 14 genes associated with CH (FDR q < 0.05); eight replicated in validation cohorts: RUNX1, MPL, TP53, ATM, NBN, CHEK2, ETV6 and PTPN11. NBN and PTPN11 had not previously been associated with CH. Additional analyses found 262 associations involving 84 genes, with 30 replicated associations involving 23 genes; the paper reports 22 new CH-predisposition genes and five new candidate hematologic cancer predisposition genes (XRCC2, SLX4, MLH1, NTHL1, POLE).
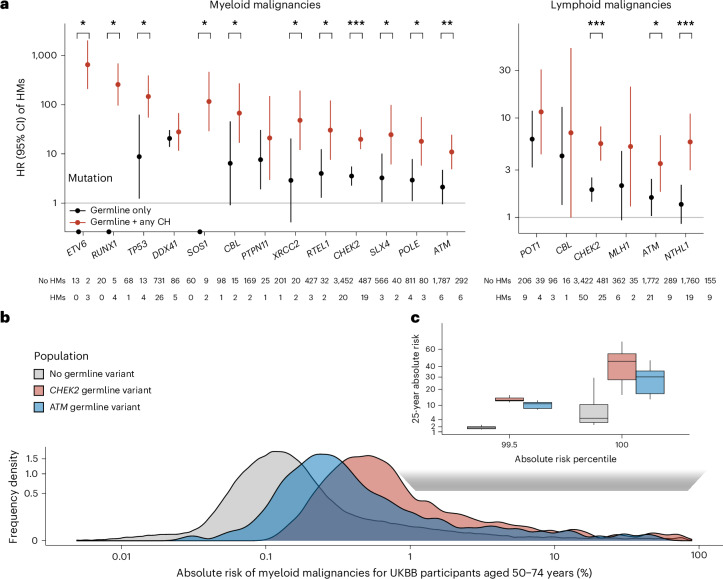
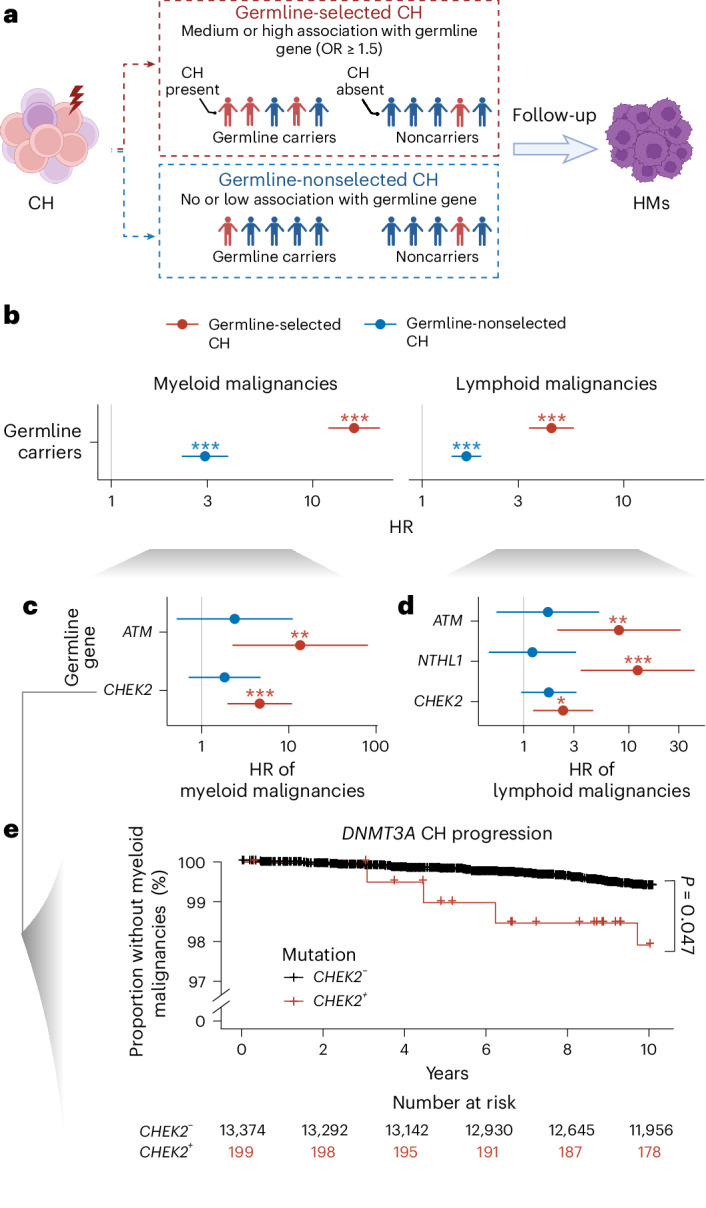
- Germline–CH interaction was multiplicative for hematologic malignancy risk (P = 0.014); CH carriers with pathogenic germline variants had higher risk than CH carriers without (HR = 1.3, 95% CI = 1.1–1.5, P = 2.4 × 10⁻⁵). Germline-selected CH conferred 2.7-fold and 13.1-fold higher progression risks than germline-nonselected CH.
- For 25-year absolute risk of myeloid malignancy, 2% of CHEK2 carriers and 1% of ATM carriers exceeded 5% risk versus 0.2% of noncarriers; among the top 0.5% risk group, median 25-year risk was 46% for CHEK2 and 30% for ATM carriers versus 4% for noncarriers.
Methods
- Multi-cohort study totaling 731,835 individuals: UKBB (n = 428,530), All of Us (n = 192,003), MGBB (n = 49,941), CCDG (n = 37,184), TCGA (n = 7,161) and MSK-IMPACT (n = 17,016).
- Germline pathogenic/likely pathogenic variants were called in 236 cancer predisposition genes using ACMG criteria. CH was detected from blood WES/WGS using Mutect2 and VarDict (minimum VAF 2%) in 184 hematologic malignancy genes and 755 solid tumor genes; mosaic chromosomal alterations were called with MoChA.
- Associations used Firth’s bias-reduced logistic regression adjusted for age at blood draw, first three genetic PCs and sequencing batch, with replication by fixed-effects meta-analysis; Cox regression tested hematologic malignancy risk, and iCARE modeled 25-year absolute risk.
Limitations
- Stated in the paper: replication cohorts had short or no follow-up for hematologic cancer development, so the five new candidate hematologic cancer predisposition genes require validation; low sequencing depth likely underestimates CH prevalence; and no established CH interventions mean routine screening of moderate-risk carriers is not currently warranted.
- Stated in the paper: in the absence of longitudinal data, CH fitness was inferred from VAF distributions, and the authors note that increased fitness can mimic increased mutation rate in that framework.
- Evident from the text: several specific CH-subtype and malignancy analyses report uncorrected two-sided P values, and the authors note that larger numbers of hematologic cancers would be needed for refined estimation of heterogeneity between ATM and CHEK2 missense versus loss-of-function variants.
Model-written summary. Check it against the paper before relying on it.
Integrity signals
Registry
Cites
Statistics
Figures
Verification
Claims the paper makes
73 Own result · 20 Own interpretation · 13 Check pending · 9 Own method · 7 Not checked yet · 4 No full text of the sources
A result the paper reports from its own data — it cites no other source for it, so there is none to check. The quote shows it is in the paper.
In the paper
“Out of the eight genes that were significantly associated with CH in the replication cohort, two have not been previously associated with CH (NBN and PTPN11).”
§ Germline genetic variation impacts clonal hematopoiesis landscape and progression to malignancy > Main > Germline predisposition to CH
plainn = 24,803- Asserted: passes — The authors put it forward as true.
- Checkable: passes — It can be checked against evidence.
- Load-bearing: unclear — It is unclear whether the paper’s conclusions depend on it.
- Based: passes — The paper gives a reason why it holds.
A result the paper reports from its own data — it cites no other source for it, so there is none to check. The quote shows it is in the paper.
In the paper
“Among both noncarriers and germline carriers, the proportion of CpG substitutions was not significantly different even after adjusting for age (P = 0.50).”
§ Germline genetic variation impacts clonal hematopoiesis landscape and progression to malignancy > Main > Germline predisposition to CH
plain- Asserted: passes — The authors put it forward as true.
- Checkable: passes — It can be checked against evidence.
- Load-bearing: passes — The paper’s conclusions depend on it.
- Based: passes — The paper gives a reason why it holds.
In the paper
“Even among mismatch repair germline carriers with tumors that are known to show distinct signature patterns27, the SBS1 ‘clock-like’ mutational signature predominated for CH mutations (Extended Data Fig. 2b and Supplementary Fig. 3).”
§ Germline genetic variation impacts clonal hematopoiesis landscape and progression to malignancy > Main > Germline predisposition to CH
What the sources say
- Check pendingcites [27] Georgeson, P. et al. Evaluating the utility of tumour mutational signatures for identifying hereditary colorectal cancer and polyposis syndrome carriers. Gut 70, 2138–2149 (2021). source
plain- Asserted: passes — The authors put it forward as true.
- Checkable: passes — It can be checked against evidence.
- Load-bearing: passes — The paper’s conclusions depend on it.
- Based: passes — The paper gives a reason why it holds.
A result the paper reports from its own data — it cites no other source for it, so there is none to check. The quote shows it is in the paper.
In the paper
“Using multivariable logistic regression adjusted for age at blood draw, the first three genetic principal components (PCs) and exome sequencing batch, we identified 14 genes associated with CH (false discovery rate (FDR)-corrected P value: q < 0.05; Fig. 2a and Supplementary Table 11).”
§ Germline genetic variation impacts clonal hematopoiesis landscape and progression to malignancy > Main > Germline predisposition to CH
plainstates an association- Asserted: passes — The authors put it forward as true.
- Checkable: passes — It can be checked against evidence.
- Load-bearing: passes — The paper’s conclusions depend on it.
- Based: passes — The paper gives a reason why it holds.
A result the paper reports from its own data — it cites no other source for it, so there is none to check. The quote shows it is in the paper.
In the paper
“In total, eight were significantly associated with CH in the replication cohorts (RUNX1 (P = 1.5 × 10⁻² for CH-heme), MPL (P = 1.2 × 10⁻²⁴ for mCA-auto), TP53 (P = 2.0 × 10⁻⁶ for CH-heme), ATM (P = 2.0 × 10⁻² for CH-heme; P = 8.9 × 10⁻¹² for mCA-auto), NBN (P = 4.7 × 10⁻² for mCA-auto), CHEK2 (P = 2.9 × 10⁻⁷ for CH-heme), ETV6 (P = 1.1 × 10⁻³ for CH-heme) and PTPN11 (P = 4.7 × 10⁻² for CH-heme))”
§ Germline genetic variation impacts clonal hematopoiesis landscape and progression to malignancy > Main > Germline predisposition to CH
plainstates an associationn = 24,803- Asserted: passes — The authors put it forward as true.
- Checkable: passes — It can be checked against evidence.
- Load-bearing: passes — The paper’s conclusions depend on it.
- Based: passes — The paper gives a reason why it holds.
- It may state two separate claims as one. 38
- Probably not a substantial claim. 30
- The quote only partly states this claim. 1
Create a free account to see these claims.
Create a free account to see these assumptions.
59 more claims
Create a free account to see all 126 claims and to verify the 52 references still open.
Self-check
Percentages, sums and reported differences re-computed from the paper’s own numbers.
Each contradiction between two passages listed here was confirmed by an independent check.
Rated minor: it would not touch a result — a value no result rests on, a p-value that stays on the same side of the significance level, or a conflict that is clerical, resolved elsewhere in the paper, or outside its own findings.
In the paper
“We tested for an association between germline carriers and risk of hematologic malignancy for the 98 CH-predisposition genes that we identified in the UKBB, including 14 genes associated with CH overall and 94 genes associated only with CH in specific genes or genetic regions.”
§ Germline genetic variation impacts clonal hematopoiesis landscape and progression to malignancy > Main > Germline predisposition to hematologic malignancies
Reported 98 · recomputed 108
Rated minor: it would not touch a result — a value no result rests on, a p-value that stays on the same side of the significance level, or a conflict that is clerical, resolved elsewhere in the paper, or outside its own findings.
In the paper
§ Germline genetic variation impacts clonal hematopoiesis landscape and progression to malignancy > Main > Germline predisposition to CH
“This included DOCK8, a regulator of lymphocyte differentiation, members of Fanconi’s anemia pathway (FANCI), the base-excision repair pathway (ERCC1, ERCC2, ERCC3 and ERCC5), spindle checkpoint regulation (BUB1B), double-strand break repair (MRE11 and LIG4) and centromere maintenance (ERRCC6L6).”
§ Germline genetic variation impacts clonal hematopoiesis landscape and progression to malignancy > Main > Germline predisposition to CH
“The 30 germline–CH associations that we replicated in the validation cohort consisted of 23 genes (ATR, BUB1B, CBL, DOCK8, ERCC1, ERCC2, ERCC3, ERCC4, ERCC6L2, FANCI, FH, KIT, LIG4, LZTR1, MRE11, MUTYH, NTHL1, PRDM9, RAD51D, RTEL1, SH2B3, SPRED1 and TGFBR1).”
Citations
Cites
Controlling the False Discovery Rate: A Practical and Powerful Approach to Multiple Testing
Benjamini, Y., & Hochberg, Y. (1995) · Journal of the Royal Statistical Society Series B: Statistical Methodology · doi:10.1111/j.2517-6161.1995.tb02031.x · Cited by 109,482
Richards, S., Aziz, N., Bale, S., Bick, D., Das, S., Gastier-Foster, J., Grody, W. W., Hegde, M., Lyon, E., Spector, E., et al. (2015) · Genetics in Medicine · doi:10.1038/gim.2015.30 · Cited by 32,594 · cited 2×
“Retained variants were then classified as per the ACMG guidelines 22 .”
Sudlow, C., Gallacher, J., Allen, N., Beral, V., Burton, P., Danesh, J., Downey, P., Elliott, P., Green, J., Landray, M., et al. (2015) · PLOS Medicine · doi:10.1371/journal.pmed.1001779 · Cited by 12,728
Sensitive detection of somatic point mutations in impure and heterogeneous cancer samples
Cibulskis, K., Lawrence, M. S., Carter, S. L., Sivachenko, A., Jaffe, D. B., Sougnez, C. L., Gabriel, S., Meyerson, M. M., Lander, E. S., & Getz, G. A. (2013) · Nature Biotechnology · doi:10.1038/nbt.2514 · Cited by 5,012
The repertoire of mutational signatures in human cancer
Alexandrov, L. B., Kim, J., Haradhvala, N. J., Huang, M. N., Tian Ng, A. W., Wu, Y., Boot, A., Covington, K. R., Gordenin, D. A., Bergstrom, E. N., et al. (2020) · Nature · doi:10.1038/s41586-020-1943-3 · Cited by 3,496
Pan-cancer analysis of whole genomes
The ICGC/TCGA Pan-Cancer Analysis of Whole Genomes Consortium, Aaltonen, L. A., Abascal, F., Abeshouse, A., Aburatani, H., Adams, D. J., Agrawal, N., Ahn, K. S., Ahn, S.-M., Aikata, H., et al. (2020) · Nature · doi:10.1038/s41586-020-1969-6 · Cited by 3,064
Landscape of somatic mutations in 560 breast cancer whole-genome sequences
Nik-Zainal, S., Davies, H., Staaf, J., Ramakrishna, M., Glodzik, D., Zou, X., Martincorena, I., Alexandrov, L. B., Martin, S., Wedge, D. C., et al. (2016) · Nature · doi:10.1038/nature17676 · Cited by 2,218
Memorial Sloan Kettering-Integrated Mutation Profiling of Actionable Cancer Targets (MSK-IMPACT)
Cheng, D. T., Mitchell, T. N., Zehir, A., Shah, R. H., Benayed, R., Syed, A., Chandramohan, R., Liu, Z. Y., Won, H. H., Scott, S. N., et al. (2015) · The Journal of Molecular Diagnostics · doi:10.1016/j.jmoldx.2014.12.006 · Cited by 2,119
Self-citationHigh burden and pervasive positive selection of somatic mutations in normal human skin
Martincorena, I., Roshan, A., Gerstung, M., Ellis, P., Van Loo, P., McLaren, S., Wedge, D. C., Fullam, A., Alexandrov, L. B., Tubio, J. M., et al. (2015) · Science · doi:10.1126/science.aaa6806 · Cited by 1,770
A genomic mutational constraint map using variation in 76,156 human genomes
Chen, S., Francioli, L. C., Goodrich, J. K., Collins, R. L., Kanai, M., Wang, Q., Alföldi, J., Watts, N. A., Vittal, C., Gauthier, L. D., et al. (2024) · Nature · doi:10.1038/s41586-023-06045-0 · Cited by 1,727 · cited 1×
“…from the UKBB, (2) recurrent in >1% of individuals but not reported in previous CH studies, (3) present with overall population frequency >5 × 10 −4 in the gnomAD 71 or (4) present at a high VAF of ≥35%, unless it was a clear cancer somatic hotspot according to criteria as previously described 55 .”
Cited by
Mangaonkar, A. A., Bolton, K. L., & Patnaik, M. M. (2026) · American Journal of Hematology · doi:10.1002/ajh.70205 · Cited by 15
Self-citationPatterns and drivers of 43,617 mosaic chromosomal alterations in blood
Tang, D. S.-H., Kamitaki, N., Mukamel, R. E., Rubinacci, S., & Loh, P. (2026) · Nature Genetics · doi:10.1038/s41588-026-02592-0 · Cited by 9
Wimalarathne, S., Lan, N. S. R., George, J., Sharma, A., Adams, L. A., & Dwivedi, G. (2025) · American Journal of Physiology-Heart and Circulatory Physiology · doi:10.1152/ajpheart.00577.2025 · Cited by 9
Hajishengallis, G. (2025) · Journal of Periodontology · doi:10.1002/jper.70040 · Cited by 9
CHIP ahoy: charting a decade of discovery in clonal hematopoiesis
Wong, C. K., McDonald, A. R., Buttigieg, M. M., & Rauh, M. J. (2025) · Haematologica · doi:10.3324/haematol.2023.283896 · Cited by 8
Metadata
- Authors
- Liu, J., Tran, D., Xue, L., Wiley, B. J., Vlasschaert, C., Watson, C. J., MacGregor, H. A. J., Zong, X., Chan, I. C. C., Das, I., Uddin, M. M., Niroula, A., Griffin, G., Ebert, B. L., Mack, T., Pershad, Y., Sharber, B., Berger, M., Zehir, A., Ptashkin, R., Levine, R. L., Papaemmanuil, E., Joseph, V., Gao, T., Kemel, Y., Mandelker, D., Stopsack, K. H., Pharoah, P. D. P., Mukherjee, S., Ding, L., Cao, Y., Walter, M. J., Blundell, J. R., Chatterjee, N., Offit, K., Godley, L. A., Link, D. C., Stadler, Z. K., Bick, A. G., Natarajan, P., & Bolton, K. L.
- Affiliations
- Washington University in St. Louis (US)
- Broad Institute (US)
- Queen's University (CA)
- University of Cambridge (GB)
- Vanderbilt University (US)
- Memorial Sloan Kettering Cancer Center (US)
- University of Bremen (DE)
- Cedars-Sinai Medical Center (US)
- Johns Hopkins University (US)
- Northwestern University (US)
- Corresponding author
- Bolton, Kelly L.
- ORCID
- Liu, Jie
- Tran, Duc
- Xue, Liying
- Wiley, Brian J.
- Vlasschaert, Caitlyn
- Watson, Caroline J.
- MacGregor, Hamish A. J.
- Zong, Xiaoyu
- Chan, Irenaeus C. C.
- Uddin, Md Mesbah
- Niroula, Abhishek
- Griffin, Gabriel
- Ebert, Benjamin L.
- Mack, Taralynn
- Pershad, Yash
- Sharber, Brian
- Berger, Michael
- Zehir, Ahmet
- Ptashkin, Ryan
- Levine, Ross L.
- Papaemmanuil, Elli
- Joseph, Vijai
- Gao, Teng
- Kemel, Yelena
- Mandelker, Diana
- Stopsack, Konrad H.
- Pharoah, Paul D. P.
- Mukherjee, Semanti
- Ding, Li
- Cao, Yin
- Walter, Matthew J.
- Blundell, Jamie R.
- Chatterjee, Nilanjan
- Offit, Kenneth
- Godley, Lucy A.
- Link, Daniel C.
- Stadler, Zsofia K.
- Bick, Alexander G.
- Natarajan, Pradeep
- Bolton, Kelly L.
- Venue
- Nature Genetics
- Published
- 2025-07-15
- Volume
- 57
- Issue
- 8
- Pages
- 1872-1880
- ISSN
- 1061-4036 (ISSN-L)
- 1546-1718
- PMC
- PMC12339400
- OpenAlex
- W4412421032
- Semantic Scholar
- 3bcdcfe442326883ec1ff1d1b7880290f079cb82
- Cited by
- 33
- References
- 79
- Citations by year
- 2026: 23 · 2025: 9
- FWCI
- 19.93
- Type
- journal article
- Language
- en
- Open access
- hybrid
- doi.org
- Licence
- Locations
- Nature Genetics (publishedVersion, cc-by-nc-nd)
- PubMed Central (publishedVersion, cc-by-nc-nd)
- PubMed (publishedVersion)
- Apollo (University of Cambridge) (submittedVersion, cc-by-nc-nd)
- Digital Commons@Becker (Washington University School of Medicine) (submittedVersion)
- Funders
- MDS Foundation (K.L.B), Prostate Cancer Foundation Challenge Award
- Topics
- Health Sciences › Medicine › Hematology › Acute Myeloid Leukemia Research
- Life Sciences › Biochemistry, Genetics and Molecular Biology › Cancer Research › Cancer Genomics and Diagnostics
- Life Sciences › Biochemistry, Genetics and Molecular Biology › Genetics › Genetic Associations and Epidemiology
- Keywords
- clonal hematopoiesis, germline genetic variation, clonal evolution, hematologic malignancy risk, germline pathogenic variants, clonal fitness, aging
- MeSH terms
- Clonal Hematopoiesis, Female, Humans, Male, Neoplasms, Genetic Variation, Germ-Line Mutation, Disease Progression, Hematologic Neoplasms, Genetic Predisposition to Disease
About these checks
Registry, retraction, Cites and statistics results are computed, not judged, with one exception: a printed reference that no index lists is read once by a model before it counts as a citation error. Claims are extracted by a model and kept only when their quote appears verbatim in the text; each cited source is then checked, with a model’s help, for whether it says what the claim relies on. Those verdicts can be wrong — read the claim’s quote and the cited source before relying on one.
A language model drew the claims from the paper on 2026-11-12, under version 3 of the claim definition (model deepseek-v4.1-flash, prompt extract-v3).
A second model labelled each claim on 2026-11-12 (model jev-1.13-20260917, definition revision gold-guideline-v0.2).
Statistics and arithmetic are recomputed, not judged.
Confidence bands are shown only for fields calibrated on our annotated test set. None is calibrated yet, so no band is shown.
What counts as a claim ›How we measure confidence ›How we check this ›
Are you an author, or do you see a problem with this page? Request a review
