Cited by 128

The DOI matches its Crossref record; 1 of the 1 references it cites were found in a registry or an index.

Long-term safety and efficacy of lentiviral hematopoietic stem/progenitor cell gene therapy for Wiskott-Aldrich syndrome

Magnani, A., Semeraro, M., Adam, F., Booth, C., Dupré, L., Morris, E. C., Gabrion, A., Roudaut, C., Borgel, D., Toubert, A., Clave, E., Abdo, C., Gorochov, G., Petermann, R., Guiot, M., Miyara, M., Moshous, D., Magrin, E., Denis, A., Suarez, F., Lagresle, C., Roche, A. M., Everett, J., Trinquand, A., Guisset, M., Bayford, J. Xu, Hacein-Bey-Abina, S., Kauskot, A., Elfeky, R., Rivat, C., Abbas, S., Gaspar, H. B., Macintyre, E., Picard, C., Bushman, F. D., Galy, A., Fischer, A., Six, E., Thrasher, A. J., Cavazzana, M.·2022·Nature Medicine

Abstract

Patients with Wiskott–Aldrich syndrome (WAS) lacking a human leukocyte antigen-matched donor may benefit from gene therapy through the provision of gene-corrected, autologous hematopoietic stem/progenitor cells. Here, we present comprehensive, long-term follow-up results (median follow-up, 7.6 years) (phase I/II trial no. NCT02333760 ) for eight patients with WAS having undergone phase I/II lentiviral vector-based gene therapy trials (nos. NCT01347346 and NCT01347242 ), with a focus on thrombocytopenia and autoimmunity. Primary outcomes of the long-term study were to establish clinical and biological safety, efficacy and tolerability by evaluating the incidence and type of serious adverse events and clinical status and biological parameters including lentiviral genomic integration sites in different cell subpopulations from 3 years to 15 years after gene therapy. Secondary outcomes included monitoring the need for additional treatment and T cell repertoire diversity. An interim analysis shows that the study meets the primary outcome criteria tested given that the gene-corrected cells engrafted stably, and no serious treatment-associated adverse events occurred. Overall, severe infections and eczema resolved. Autoimmune disorders and bleeding episodes were significantly less frequent, despite only partial correction of the platelet compartment. The results suggest that lentiviral gene therapy provides sustained clinical benefits for patients with WAS.

Overview

The claims and statistics of this paper haven’t been checked yet.

Run the check — free, no account needed. It reads the open-access text and checks the sources it cites.

A few free checks a day · papers already verified open instantly · results are public

Integrity signals

Registry

Crossref · 10.1038/s41591-021-01641-x

Cites

1 of 1 references verified0 citation errors · 0 not checkable

Statistics

Figures

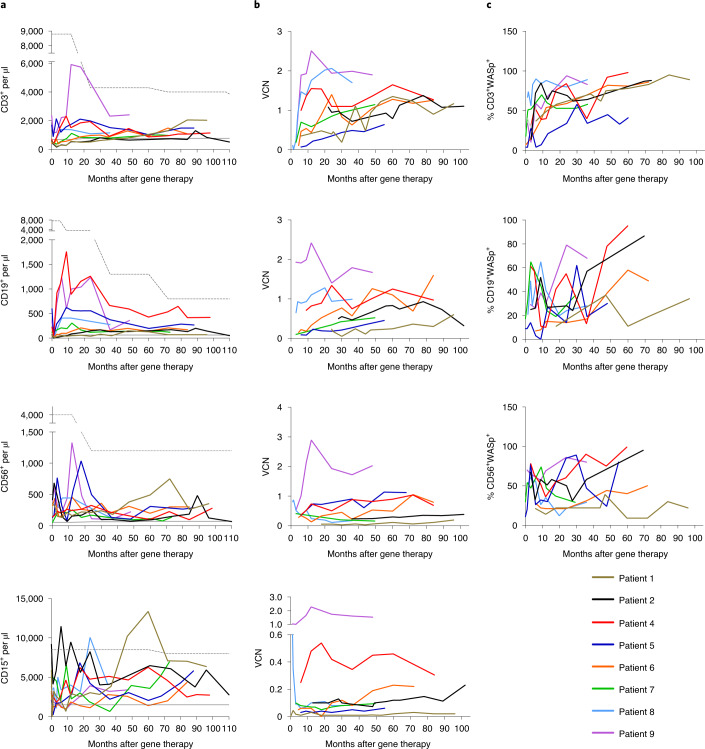
Fig. 1 Immune reconstitution after gene therapy. a, Measurement of the total CD3+ T cell, CD19+ B cell, CD56+ natural killer (NK) cell and CD15+ neutrophil counts in blood at regular time points after gene therapy. Age-matched reference values are indicated by the gray lines (solid line, lower value; dashed line, upper value). b, Measurement of the VCN per cell at regular time points after gene therapy as a guide to the level of gene marking in CD3+ T cells, CD19+ B cells, CD56+ NK cells and CD15+ neutrophils (top to bottom). c, Change over time in the proportion of WASp-positive CD3+ T cells, CD19+ B cells and CD56+ NK cells after gene therapy.
Fig. 1 Immune reconstitution after gene therapy. a, Measurement of the total CD3+ T cell, CD19+ B cell, CD56+ natural killer (NK) cell and CD15+ neutrophil counts in blood at regular time points after gene therapy. Age-matched reference values are indicated by the gray lines (solid line, lower value; dashed line, upper value). b, Measurement of the VCN per cell at regular time points after gene therapy as a guide to the level of gene marking in CD3+ T cells, CD19+ B cells, CD56+ NK cells and CD15+ neutrophils (top to bottom). c, Change over time in the proportion of WASp-positive CD3+ T cells, CD19+ B cells and CD56+ NK cells after gene therapy.CC BY · PubMed Central
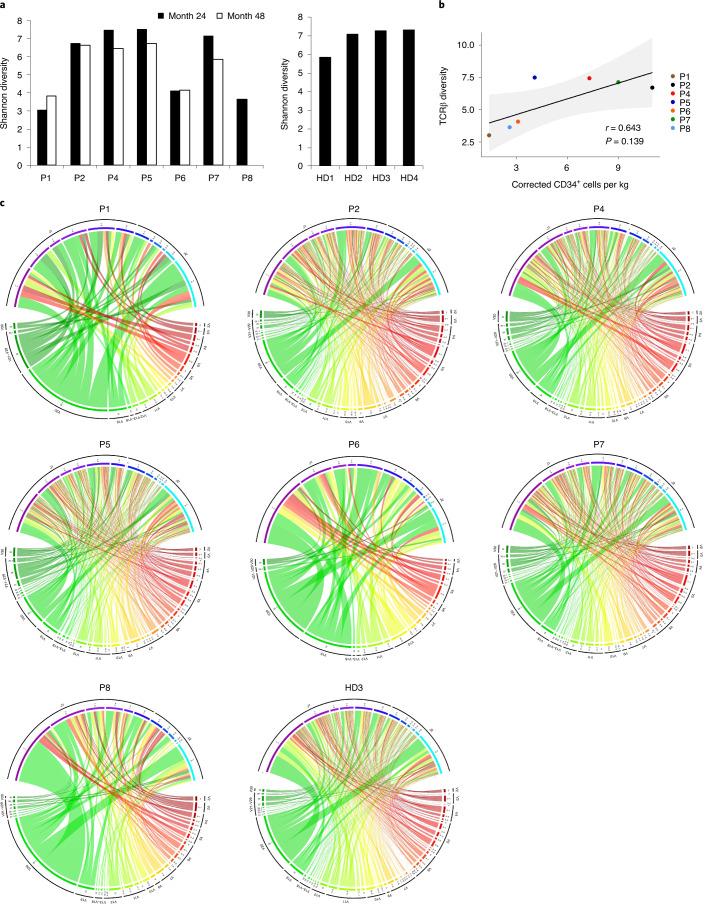
Fig. 2 TCRβ repertoire analysis. a, Shannon diversity of the TCRβ clonotypes analyzed in patients with WAS (P1, P2, P4–P8) at months 24 and 48 of post-gene therapy follow-up (left) and in four healthy donors (HD1–HD4) (right). b, The Spearman correlation between the TCRβ Shannon diversity at month 24 and the number of corrected CD34+ cells infused per kilogram, for each patient. The P value was calculated using the two-sided Spearman’s rank correlation test, and r is Spearman’s rank correlation coefficient. A regression line is represented in black and the 95% confidence interval is shown in gray. c, Circos plots showing V-gene and J-gene combinations in the repertoires analyzed in patients with WAS at month 48 of post-gene therapy follow-up (except for P8, shown at month 24) and in one healthy donor (HD3). The colored arcs define distinct Vβ and Jβ genes. The ribbon thickness is proportional to the frequency of a given combination.
Fig. 2 TCRβ repertoire analysis. a, Shannon diversity of the TCRβ clonotypes analyzed in patients with WAS (P1, P2, P4–P8) at months 24 and 48 of post-gene therapy follow-up (left) and in four healthy donors (HD1–HD4) (right). b, The Spearman correlation between the TCRβ Shannon diversity at month 24 and the number of corrected CD34+ cells infused per kilogram, for each patient. The P value was calculated using the two-sided Spearman’s rank correlation test, and r is Spearman’s rank correlation coefficient. A regression line is represented in black and the 95% confidence interval is shown in gray. c, Circos plots showing V-gene and J-gene combinations in the repertoires analyzed in patients with WAS at month 48 of post-gene therapy follow-up (except for P8, shown at month 24) and in one healthy donor (HD3). The colored arcs define distinct Vβ and Jβ genes. The ribbon thickness is proportional to the frequency of a given combination.CC BY · PubMed Central
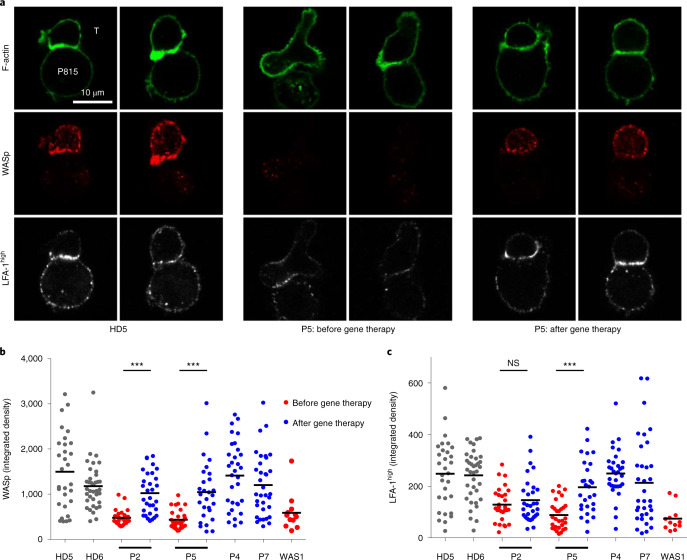
Fig. 3 Restoration of T cell immune synapse assembly after gene therapy. a, Representative confocal microscopy images of conjugates between the indicated T cells (T, upper cells) and monoclonal anti-CD3 antibody-coated P815 cells (P815, lower cells), after staining for F-actin, WASp and high-affinity LFA-1. The T cells from P5 were collected 55 months after gene therapy; comparable data were collected from additional patients before and after gene therapy (P2) or after gene therapy (P4 and P7). The data were reproduced in two independent experiments (including cell preparation, staining and image acquisition). b, Integrated fluorescence density for WASp in T cells forming conjugates with monoclonal anti-CD3 antibody-coated P815 cells in patients with WAS before and after gene therapy (43, 55, 48 and 41 months afterwards for P2, P5, P4 and P7, respectively), in HDs (HD5 and HD6), and in one non-treated patient with WAS (WAS 1). c, Integrated fluorescence density for high-affinity LFA-1 in the same cells as in b. Overall, 28–37 conjugates per sample were analyzed. Similar results were obtained in another independent experiment. Statistical significance was assessed by unpaired t-test (two-tailed) (***P < 0.0001); NS, not significant (P = 0.3866). Black horizontal lines in b and c represent the mean.
Fig. 3 Restoration of T cell immune synapse assembly after gene therapy. a, Representative confocal microscopy images of conjugates between the indicated T cells (T, upper cells) and monoclonal anti-CD3 antibody-coated P815 cells (P815, lower cells), after staining for F-actin, WASp and high-affinity LFA-1. The T cells from P5 were collected 55 months after gene therapy; comparable data were collected from additional patients before and after gene therapy (P2) or after gene therapy (P4 and P7). The data were reproduced in two independent experiments (including cell preparation, staining and image acquisition). b, Integrated fluorescence density for WASp in T cells forming conjugates with monoclonal anti-CD3 antibody-coated P815 cells in patients with WAS before and after gene therapy (43, 55, 48 and 41 months afterwards for P2, P5, P4 and P7, respectively), in HDs (HD5 and HD6), and in one non-treated patient with WAS (WAS 1). c, Integrated fluorescence density for high-affinity LFA-1 in the same cells as in b. Overall, 28–37 conjugates per sample were analyzed. Similar results were obtained in another independent experiment. Statistical significance was assessed by unpaired t-test (two-tailed) (***P < 0.0001); NS, not significant (P = 0.3866). Black horizontal lines in b and c represent the mean.CC BY · PubMed Central
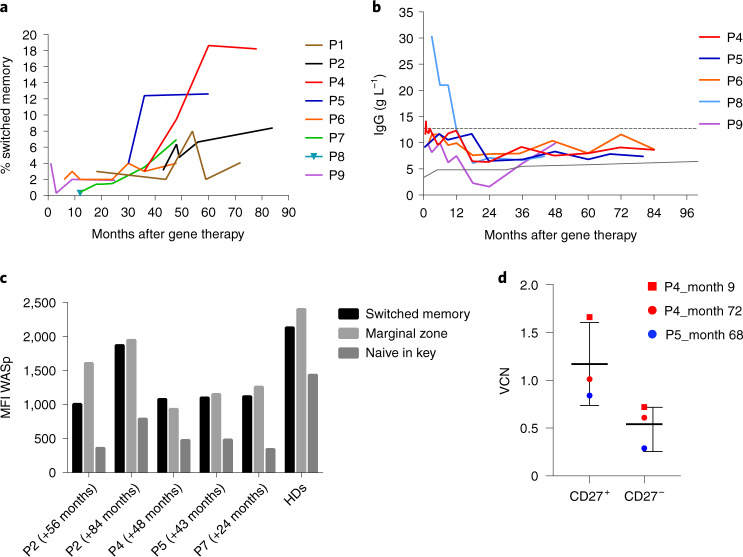
Fig. 4 B cell reconstitution after gene therapy. a, Switched memory B cell subsets over time. b, IgG production in patients who discontinued intravenous immunoglobulin replacement therapy. Age-matched reference values are indicated by the gray lines (solid line, lower value; dashed line, upper value). c, WASp expression (mean fluorescence intensity (MFI) in arbitrary units) in switched memory, marginal zone and naive B cell subsets in patients (P) and healthy donors (HD7–HD11). d, The VCN in memory B cell (CD27+) and naive B cell (CD27−) subsets (n = 3 biologically independent samples). Data are presented as the mean ± s.e.m.
Fig. 4 B cell reconstitution after gene therapy. a, Switched memory B cell subsets over time. b, IgG production in patients who discontinued intravenous immunoglobulin replacement therapy. Age-matched reference values are indicated by the gray lines (solid line, lower value; dashed line, upper value). c, WASp expression (mean fluorescence intensity (MFI) in arbitrary units) in switched memory, marginal zone and naive B cell subsets in patients (P) and healthy donors (HD7–HD11). d, The VCN in memory B cell (CD27+) and naive B cell (CD27−) subsets (n = 3 biologically independent samples). Data are presented as the mean ± s.e.m.CC BY · PubMed Central
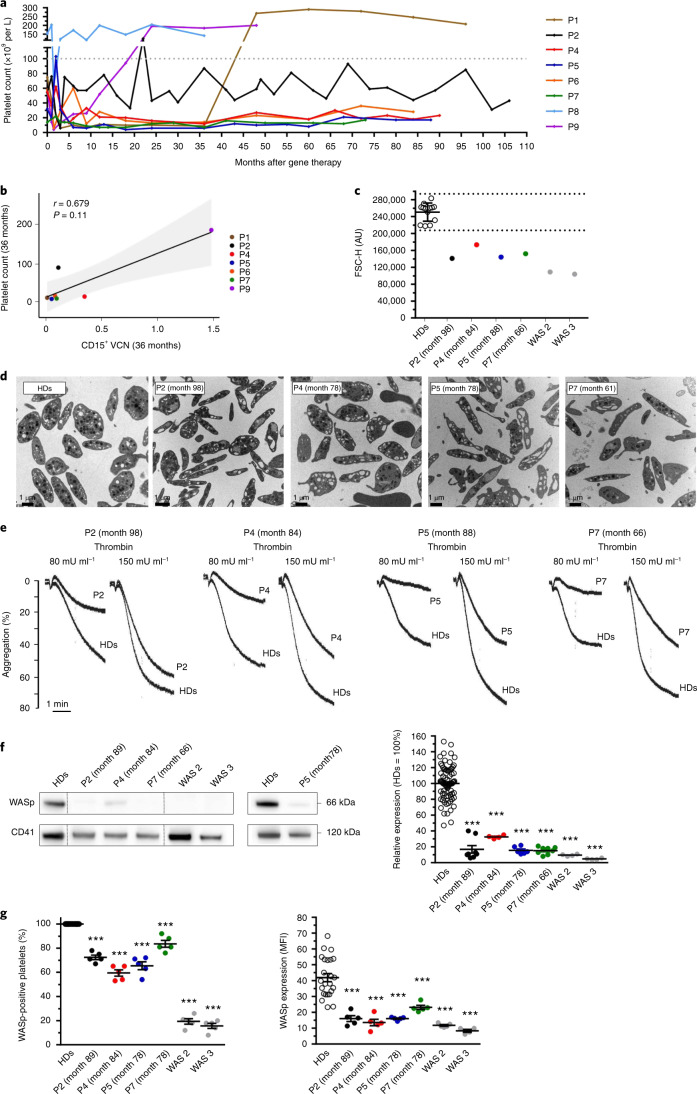
Fig. 5 Hemostasis and platelet profile after gene therapy. a, Change over time in the platelet count for each patient after gene therapy. b, The Spearman correlation between platelet count and the level of gene marking (VCN) in CD15+ neutrophils after 3 years of follow-up for each patient (apart from P8, for whom the platelet count was corrected following splenectomy before gene therapy). The P value was calculated using the two-sided Spearman’s rank correlation test, and r is Spearman’s rank correlation coefficient. A regression line is represented in black and the 95% confidence interval is shown in gray. c, Platelet size, evaluated using flow cytometry. Each dot represents the mean size of washed platelets from healthy donors (HDs; n = 13), gene therapy-treated patients (P) and non-treated patients with WAS (WAS 2 and WAS 3). The results are expressed as the mean forward scatter height (FSC-H) ± s.d. and the dotted lines indicate the normal range (mean ± 2 s.d.). AU, arbitrary units. d, Platelet ultrastructure, which was analyzed once for each patient using transmission electron microscopy. e, The thrombin-induced aggregation of washed platelets was evaluated once for each patient (P) and healthy controls (HDs). f, WASp expression in patients was evaluated by western blotting. Dotted lines indicate that the samples were derived from the same gel but are non-contiguous. The graph shows the mean of WASp expression ± s.e.m. after normalization against CD41 expression from several independent experiments (HDs, n = 82; P4, WAS 2, WAS 3, n = 4; P5, n = 6; and P2, P7, n = 8). g, WASp expression was evaluated by immunofluorescence in platelets spread onto a fibrinogen matrix after activation with 20 µM ADP. The dot plot on the left shows the mean of the percentage ± s.e.m. of platelets expressing WASp, and the dot plot on the right shows the mean of the WASp expression (determined from the MFI per platelet) ± s.e.m. for five fields of view, which represent a total number of analyzed platelets of 816 for HDs, 170 for P2, 196 for P4, 175 for P5, 145 for P7, 158 for WAS 2 and 168 for WAS 3. In f and g statistical significance was determined using one-way analysis of variance with Dunnett’s post test for multiple comparisons. In f (right) and g (left), the exact P value was P < 0.0001 for all of the patients, and in g (right) the exact P value was P < 0.0001 for P2, P4, P5, WAS 2, WAS 3 and P = 0.0007 for P7. In c–g, all HDs were different donors, except in g (left and right) where HDs were the same.
Fig. 5 Hemostasis and platelet profile after gene therapy. a, Change over time in the platelet count for each patient after gene therapy. b, The Spearman correlation between platelet count and the level of gene marking (VCN) in CD15+ neutrophils after 3 years of follow-up for each patient (apart from P8, for whom the platelet count was corrected following splenectomy before gene therapy). The P value was calculated using the two-sided Spearman’s rank correlation test, and r is Spearman’s rank correlation coefficient. A regression line is represented in black and the 95% confidence interval is shown in gray. c, Platelet size, evaluated using flow cytometry. Each dot represents the mean size of washed platelets from healthy donors (HDs; n = 13), gene therapy-treated patients (P) and non-treated patients with WAS (WAS 2 and WAS 3). The results are expressed as the mean forward scatter height (FSC-H) ± s.d. and the dotted lines indicate the normal range (mean ± 2 s.d.). AU, arbitrary units. d, Platelet ultrastructure, which was analyzed once for each patient using transmission electron microscopy. e, The thrombin-induced aggregation of washed platelets was evaluated once for each patient (P) and healthy controls (HDs). f, WASp expression in patients was evaluated by western blotting. Dotted lines indicate that the samples were derived from the same gel but are non-contiguous. The graph shows the mean of WASp expression ± s.e.m. after normalization against CD41 expression from several independent experiments (HDs, n = 82; P4, WAS 2, WAS 3, n = 4; P5, n = 6; and P2, P7, n = 8). g, WASp expression was evaluated by immunofluorescence in platelets spread onto a fibrinogen matrix after activation with 20 µM ADP. The dot plot on the left shows the mean of the percentage ± s.e.m. of platelets expressing WASp, and the dot plot on the right shows the mean of the WASp expression (determined from the MFI per platelet) ± s.e.m. for five fields of view, which represent a total number of analyzed platelets of 816 for HDs, 170 for P2, 196 for P4, 175 for P5, 145 for P7, 158 for WAS 2 and 168 for WAS 3. In f and g statistical significance was determined using one-way analysis of variance with Dunnett’s post test for multiple comparisons. In f (right) and g (left), the exact P value was P < 0.0001 for all of the patients, and in g (right) the exact P value was P < 0.0001 for P2, P4, P5, WAS 2, WAS 3 and P = 0.0007 for P7. In c–g, all HDs were different donors, except in g (left and right) where HDs were the same.CC BY · PubMed Central
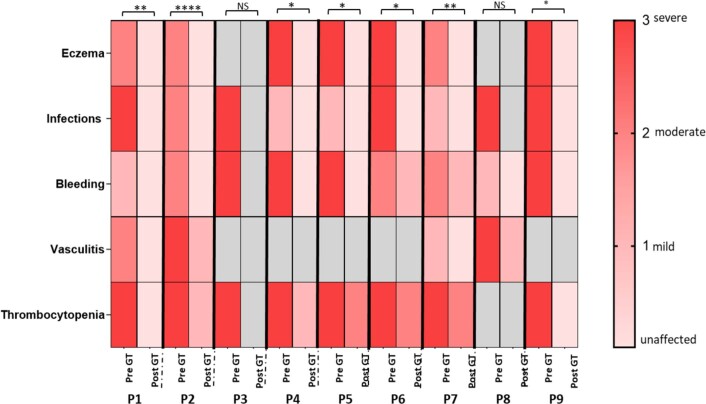
Extended Data Fig. 1 Clinical and laboratory features of patients with WAS before and after GT. Clinical and laboratory features of patients with WAS before and after GT: light pink: no disease; pink: mild disease; light red: moderate disease; red: severe disease. Eczema was graded with the SCORAD tool24. Infections and bleeding were graded in terms of recurrence and severity. Vasculitis was assessed according to the WAS severity scoring system4. Thrombocytopenia was defined as follows: grade 3 for a platelet count <10,000/µL; grade 2 between 10,000/µL and 20,000/µL; grade 1 between 20,000/µL and 50,000/µL. Grey box: not applicable. Statistical significance was determined by t test (***p < 0.001); NS: not significant.
Extended Data Fig. 1 Clinical and laboratory features of patients with WAS before and after GT. Clinical and laboratory features of patients with WAS before and after GT: light pink: no disease; pink: mild disease; light red: moderate disease; red: severe disease. Eczema was graded with the SCORAD tool24. Infections and bleeding were graded in terms of recurrence and severity. Vasculitis was assessed according to the WAS severity scoring system4. Thrombocytopenia was defined as follows: grade 3 for a platelet count <10,000/µL; grade 2 between 10,000/µL and 20,000/µL; grade 1 between 20,000/µL and 50,000/µL. Grey box: not applicable. Statistical significance was determined by t test (***p < 0.001); NS: not significant.CC BY · PubMed Central
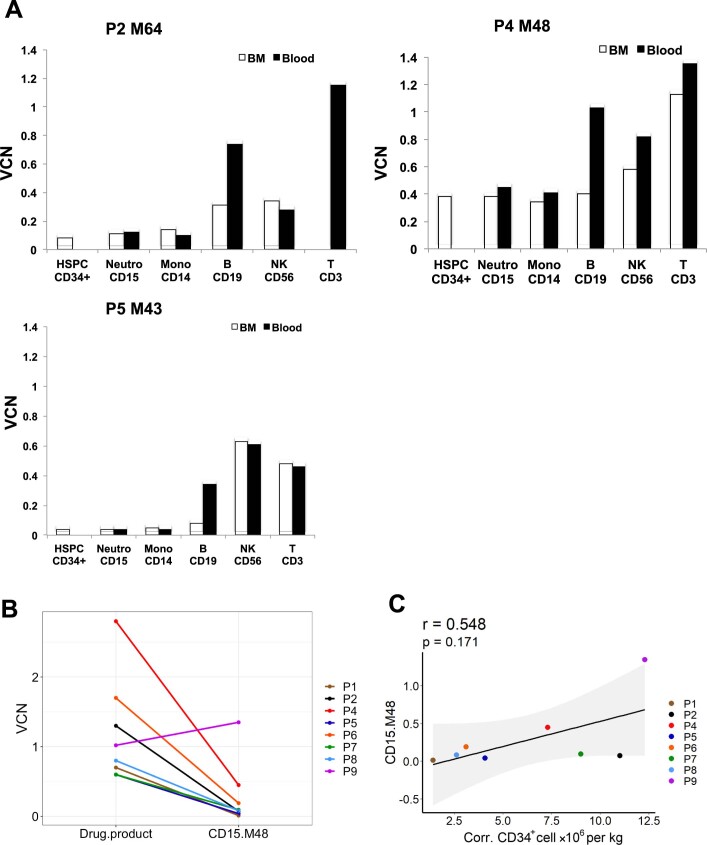
Extended Data Fig. 2 Gene marking level. Panel A, the VCN in the bone marrow (BM, white) subpopulations versus the peripheral blood (black) subpopulations in patients P2, P4 and P5; Panel B, VCN levels in the initial CD34 + drug product versus myeloid CD15 + cells 48 months after GT. Panel C, The Spearman correlation between the level of gene marking in CD15 + 48 months after GT and the number of corrected CD34 + cells infused per kilogram, for each patient. The pvalue (p) was calculated by using two-sided Spearman’s rank correlation test, r is Spearman’s rank correlation coefficient. A regression line is represented in black, the confidence interval in grey.
Extended Data Fig. 2 Gene marking level. Panel A, the VCN in the bone marrow (BM, white) subpopulations versus the peripheral blood (black) subpopulations in patients P2, P4 and P5; Panel B, VCN levels in the initial CD34 + drug product versus myeloid CD15 + cells 48 months after GT. Panel C, The Spearman correlation between the level of gene marking in CD15 + 48 months after GT and the number of corrected CD34 + cells infused per kilogram, for each patient. The pvalue (p) was calculated by using two-sided Spearman’s rank correlation test, r is Spearman’s rank correlation coefficient. A regression line is represented in black, the confidence interval in grey.CC BY · PubMed Central
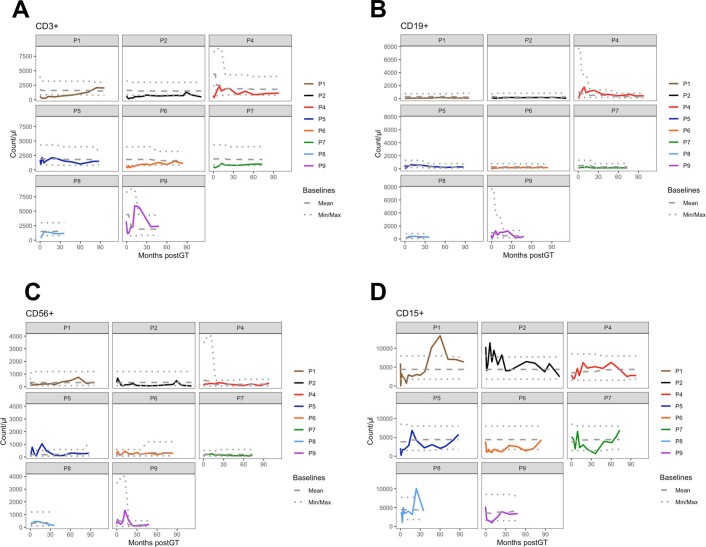
Extended Data Fig. 3 Immunological reconstitution after GT. Immunological reconstitution after GT with age-matched reference values adjusted for each patient, CD3 + (Panel A), CD19 + (Panel B), CD56 + (Panel C) and CD15 + (Panel D). Age-matched reference values are indicated by the grey lines (mean values, dashed lines, lower and upper values, dotted lines).
Extended Data Fig. 3 Immunological reconstitution after GT. Immunological reconstitution after GT with age-matched reference values adjusted for each patient, CD3 + (Panel A), CD19 + (Panel B), CD56 + (Panel C) and CD15 + (Panel D). Age-matched reference values are indicated by the grey lines (mean values, dashed lines, lower and upper values, dotted lines).CC BY · PubMed Central
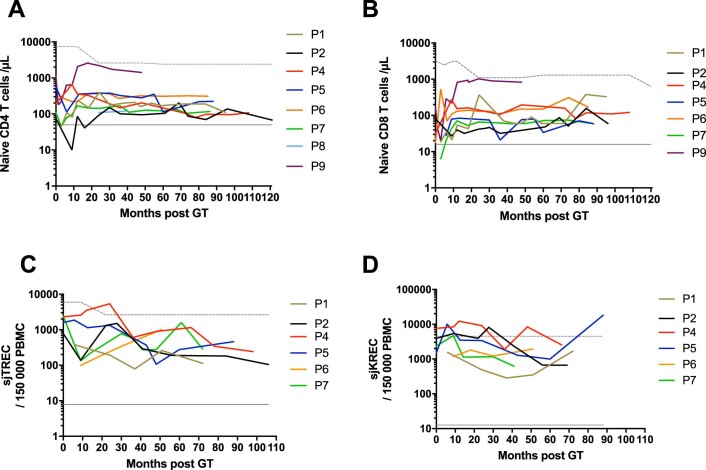
Extended Data Fig. 4 Immunological reconstitution after GT. Immunological reconstitution after GT of naive CD4 + T cells, CD4 + CD45RA + CD31 + cells (Panel A), naive CD8 + T cells, CD8 + CD45RA + CCR7 + cells (Panel B), Tcell receptor excision circles (sjTRECs) (Panel C) and immunoglobulin kappa-deleting recombination excision circles (sjKREC) (Panel D). Age-matched reference values are indicated by the grey lines (solid line: lower value; dashed line: upper value).
Extended Data Fig. 4 Immunological reconstitution after GT. Immunological reconstitution after GT of naive CD4 + T cells, CD4 + CD45RA + CD31 + cells (Panel A), naive CD8 + T cells, CD8 + CD45RA + CCR7 + cells (Panel B), Tcell receptor excision circles (sjTRECs) (Panel C) and immunoglobulin kappa-deleting recombination excision circles (sjKREC) (Panel D). Age-matched reference values are indicated by the grey lines (solid line: lower value; dashed line: upper value).CC BY · PubMed Central
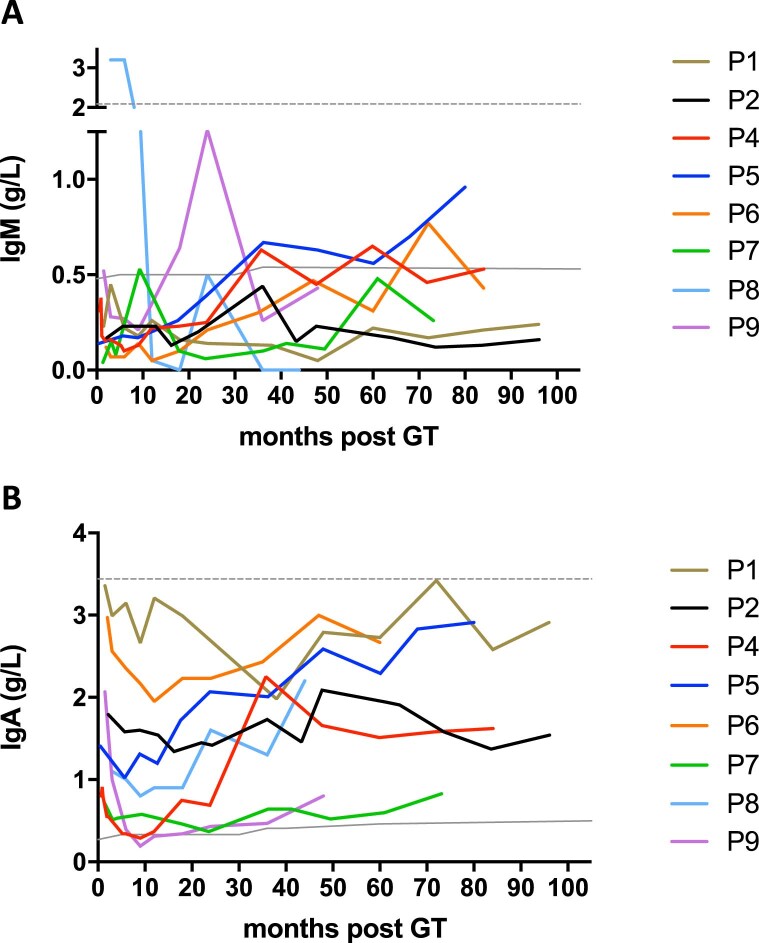
Extended Data Fig. 5 Immunoglobulin reconstitution after GT. Immunoglobulin (Ig) reconstitution after GT. Panel A, IgM production over time; Panel B, IgA production over time. Age-matched reference values are indicated by the grey lines (solid line: lower value; dashed line: upper value).
Extended Data Fig. 5 Immunoglobulin reconstitution after GT. Immunoglobulin (Ig) reconstitution after GT. Panel A, IgM production over time; Panel B, IgA production over time. Age-matched reference values are indicated by the grey lines (solid line: lower value; dashed line: upper value).CC BY · PubMed Central
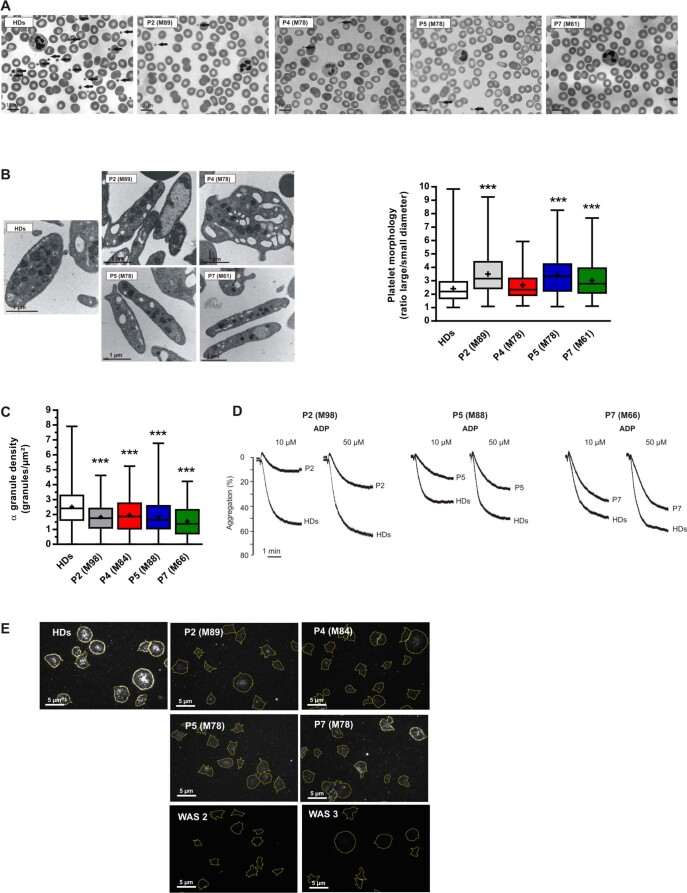
Extended Data Fig. 6 Platelet analyses. Panel A, Images show blood smears performed once for each GT-treated patients (P) or healthy donors (HDs) after May-Grünwald Giemsa staining. Arrows indicate the platelets. Panel B, TEM analysis of platelet ultrastructure in each patient (P). The box-and-whisker plots show the platelet shape defined as the ratio between the largest diameter and the smallest diameter derived from the TEM images performed once for each patient. Whiskers represent the upper and lower extreme values, the box correspond to the interquartile range, the center line is the median and the cross indicates the mean of 100 platelets for patients and 826 platelets for HDs. Statistical significance was determined in a one-way ANOVA with the Sidak post-test for multiple comparisons. The exact p value was p < 0.0001 for P2, P5, P7 and p = 0.1484 for P4. Panel C, the α-granule density for each patient was quantified by TEM and the results were shown in box-and-whisker plots. Whiskers represent the upper and lower extreme values, the box correspond to the interquartile range, the center line is the median and the cross indicates the mean of 100 platelets for patients and 970 for HDs. Statistical significance was determined in a one-way ANOVA with the Sidak post-test for multiple comparisons. The exact p value was p < 0.0001 for all P2, P5, P7 and p = 0.0002 for P4. Panel D, Aggregation of washed platelets induced by ADP (10 or 50 µM) was evaluated once for P2, P5 and P7. Panel E, WASp expression was evaluated by immunofluorescence in platelets spread onto a fibrinogen matrix after activation with 20 µM ADP. WASp was detected using a specific antibody. The outlines of spread platelets (represented by the yellow lines) were identified by detecting F-actin with fluorescently labeled phalloidin.
Extended Data Fig. 6 Platelet analyses. Panel A, Images show blood smears performed once for each GT-treated patients (P) or healthy donors (HDs) after May-Grünwald Giemsa staining. Arrows indicate the platelets. Panel B, TEM analysis of platelet ultrastructure in each patient (P). The box-and-whisker plots show the platelet shape defined as the ratio between the largest diameter and the smallest diameter derived from the TEM images performed once for each patient. Whiskers represent the upper and lower extreme values, the box correspond to the interquartile range, the center line is the median and the cross indicates the mean of 100 platelets for patients and 826 platelets for HDs. Statistical significance was determined in a one-way ANOVA with the Sidak post-test for multiple comparisons. The exact p value was p < 0.0001 for P2, P5, P7 and p = 0.1484 for P4. Panel C, the α-granule density for each patient was quantified by TEM and the results were shown in box-and-whisker plots. Whiskers represent the upper and lower extreme values, the box correspond to the interquartile range, the center line is the median and the cross indicates the mean of 100 platelets for patients and 970 for HDs. Statistical significance was determined in a one-way ANOVA with the Sidak post-test for multiple comparisons. The exact p value was p < 0.0001 for all P2, P5, P7 and p = 0.0002 for P4. Panel D, Aggregation of washed platelets induced by ADP (10 or 50 µM) was evaluated once for P2, P5 and P7. Panel E, WASp expression was evaluated by immunofluorescence in platelets spread onto a fibrinogen matrix after activation with 20 µM ADP. WASp was detected using a specific antibody. The outlines of spread platelets (represented by the yellow lines) were identified by detecting F-actin with fluorescently labeled phalloidin.CC BY · PubMed Central
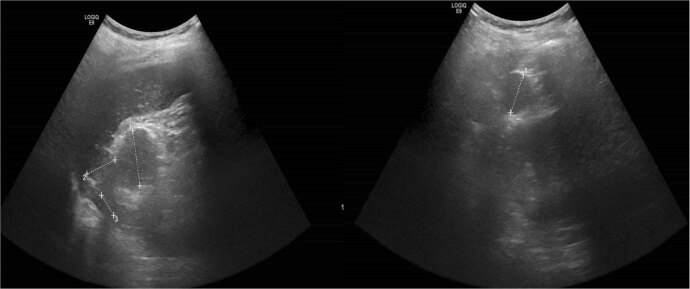
Extended Data Fig. 7 Ultrasound assessment of P2. Ultrasound assessment of P2, showing three accessory spleens (measuring up to 3 cm in diameter) in the right hypochondrium.
Extended Data Fig. 7 Ultrasound assessment of P2. Ultrasound assessment of P2, showing three accessory spleens (measuring up to 3 cm in diameter) in the right hypochondrium.CC BY · PubMed Central
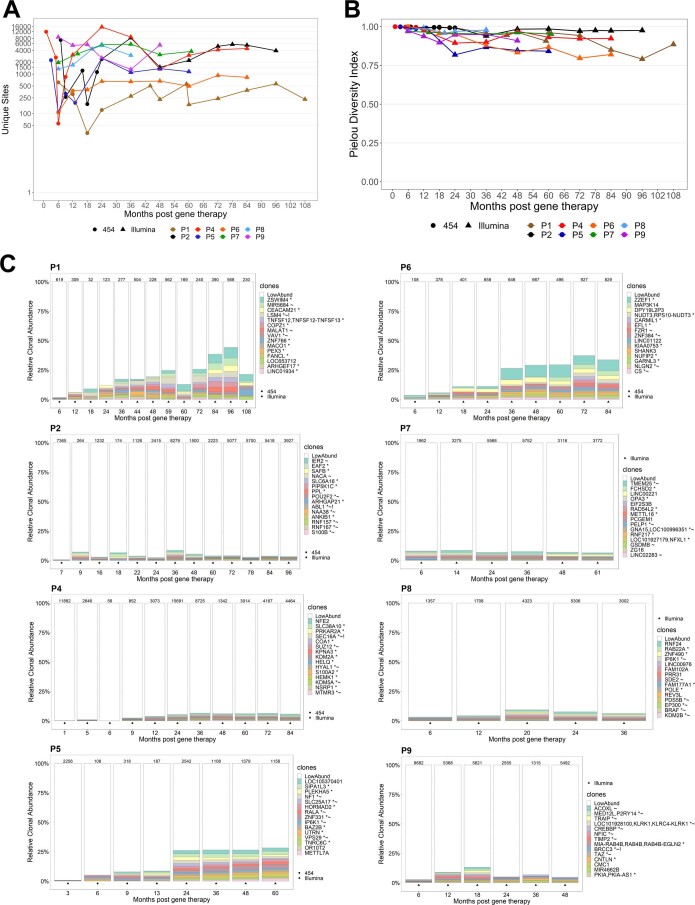
Extended Data Fig. 8 Integration site (IS) analyses. Panel A, The number of unique ISs detected in PBMCs at various points (in months) after gene therapy. Most of the samples were analyzed by sonic shearing in Illumina sequencing experiments (triangle), except that the early samples were analyzed using restriction endonucleases in 454 sequencing experiments (circle). Panel B, The Pielou diversity index for the IS population in PBMCs for the different patients. Panel C, A stacked bar representation showing the relative clone size (sonic abundance) of the TOP15 integration site clones detected over time for each patient.
Extended Data Fig. 8 Integration site (IS) analyses. Panel A, The number of unique ISs detected in PBMCs at various points (in months) after gene therapy. Most of the samples were analyzed by sonic shearing in Illumina sequencing experiments (triangle), except that the early samples were analyzed using restriction endonucleases in 454 sequencing experiments (circle). Panel B, The Pielou diversity index for the IS population in PBMCs for the different patients. Panel C, A stacked bar representation showing the relative clone size (sonic abundance) of the TOP15 integration site clones detected over time for each patient.CC BY · PubMed Central

Verification

Claims the paper makes

The claims and statistics of this paper haven’t been checked yet.

Run the check — free, no account needed. It reads the open-access text and checks the sources it cites.

A few free checks a day · papers already verified open instantly · results are public

Claims other papers make about this one

Each is checked against this paper’s own text: does it say what the citing paper says it does?

Self-check

Percentages, sums and reported differences re-computed from the paper’s own numbers.

The self-check needs the paper’s full text.

Citations

Cites

Show all 1 references

Research works printed but not linked: 51

  1. Thrasher, A. J. & Burns, S. O. WASP: a key immunological multitasker. Nat. Rev. Immunol. 10, 182–192 (2010). · DOI
  2. Candotti, F. Clinical manifestations and pathophysiological mechanisms of the Wiskott-Aldrich syndrome. J. Clin. Immunol. 38, 13–27 (2018). · DOI
  3. Albert, M. H., Notarangelo, L. D. & Ochs, H. D. Clinical spectrum, pathophysiology and treatment of the Wiskott-Aldrich syndrome. Curr. Opin. Hematol. 18, 42–48 (2011). · DOI
  4. Zhu, Q. et al. The Wiskott-Aldrich syndrome and X-linked congenital thrombocytopenia are caused by mutations of the same gene. Blood 86, 3797–3804 (1995). · DOI
  5. Imai, K. et al. Clinical course of patients with WASP gene mutations. Blood 103, 456–464 (2004). · DOI
  6. Mahlaoui, N. et al. Characteristics and outcome of early-onset, severe forms of Wiskott-Aldrich syndrome. Blood 121, 1510–1516 (2013). · DOI
  7. Dupuis-Girod, S. et al. Autoimmunity in Wiskott-Aldrich syndrome: risk factors, clinical features, and outcome in a single-center cohort of 55 patients. Pediatrics 111, 622–627 (2003). · DOI
  8. Ozsahin, H. et al. Long-term outcome following hematopoietic stem-cell transplantation in Wiskott-Aldrich syndrome: collaborative study of the European Society for Immunodeficiencies and European Group for Blood and Marrow Transplantation. Blood 111, 439–445 (2008). · DOI
  9. Moratto, D. et al. Long-term outcome and lineage-specific chimerism in 194 patients with Wiskott-Aldrich syndrome treated by hematopoietic cell transplantation in the period 1980-2009: an international collaborative study. Blood 118, 1675–1684 (2011). · DOI
  10. Shin, C. R. et al. Outcomes following hematopoietic cell transplantation for Wiskott-Aldrich syndrome. Bone Marrow Transplant. 47, 1428–1435 (2012). · DOI
  11. Elfeky, R. A. et al. One hundred percent survival after transplantation of 34 patients with Wiskott-Aldrich syndrome over 20 years. J. Allergy Clin. Immunol. 142, 1654–1656 (2018). · DOI
  12. Burroughs, L. M. et al. Excellent outcomes following hematopoietic cell transplantation for Wiskott-Aldrich syndrome: a PIDTC report. Blood 135, 2094–2105 (2020). · DOI
  13. Balashov, D. et al. A conditioning regimen with plerixafor is safe and improves the outcome of TCRαβ+ and CD19+ cell-depleted stem cell transplantation in patients with Wiskott-Aldrich syndrome. Biol. Blood Marrow Transplant. 24, 1432–1440 (2018). · DOI
  14. Wada, T. et al. Second-site mutation in the Wiskott-Aldrich syndrome (WAS) protein gene causes somatic mosaicism in two WAS siblings. J. Clin. Invest. 111, 1389–1397 (2003). · DOI
  15. Davis, B. R. et al. Somatic mosaicism in the Wiskott-Aldrich syndrome: molecular and functional characterization of genotypic revertants. Clin. Immunol. 135, 72–83 (2010). · DOI
  16. Trifari, S. et al. Revertant T lymphocytes in a patient with Wiskott-Aldrich syndrome: analysis of function and distribution in lymphoid organs. J. Allergy Clin. Immunol. 125, 439–448 (2010). · DOI
  17. Cavazzana, M., Bushman, F. D., Miccio, A., André-Schmutz, I. & Six, E. Gene therapy targeting haematopoietic stem cells for inherited diseases: progress and challenges. Nat. Rev. Drug Discov. 18, 447–462 (2019). · DOI
  18. Aiuti, A. et al. Lentiviral hematopoietic stem cell gene therapy in patients with Wiskott-Aldrich syndrome. Science 341, 1233151 (2013). · DOI · Paper page
  19. Hacein-Bey Abina, S. et al. Outcomes following gene therapy in patients with severe Wiskott-Aldrich syndrome. JAMA 313, 1550–1563 (2015). · DOI · Paper page
  20. Ferrua, F. et al. Lentiviral haemopoietic stem/progenitor cell gene therapy for treatment of Wiskott-Aldrich syndrome: interim results of a non-randomised, open-label, phase 1/2 clinical study. Lancet Haematol. 6, 239–253 (2019). · DOI
  21. Morris, E. C. et al. Gene therapy for Wiskott-Aldrich syndrome in a severely affected adult. Blood 130, 1327–1335 (2017). · DOI
  22. Dupré, L. et al. Lentiviral vector-mediated gene transfer in T cells from Wiskott-Aldrich syndrome patients leads to functional correction. Mol. Ther. 10, 903–915 (2004). · DOI
  23. Stalder, J. F. et al. Severity scoring of atopic dermatitis: the SCORAD index. Consensus report of the European Task Force on Atopic Dermatitis. Dermatology 186, 23–31 (1993).
  24. Pielou, E. C. The measurement of diversity in different types of biological collections. J. Theor. Biol. 13, 131–144 (1966). · DOI
  25. Ramezani, H. A note on the normalized definition of Shannon’s diversity index in landscape pattern analysis. Environ. Nat. Resources Res. 2, 54–60 (2012).
  26. Rivers, E., Worth, A., Thrasher, A. J. & Burns, S. O. Bleeding and splenectomy in Wiskott-Aldrich syndrome: a single-centre experience. J. Allergy Clin. Immunol. Pract. 7, 1042–1044 (2019). · DOI
  27. Pala, F. et al. Lentiviral-mediated gene therapy restores B cell tolerance in Wiskott-Aldrich syndrome patients. J. Clin. Invest. 125, 3941–3951 (2015). · DOI
  28. Castiello, M. C. et al. B-cell reconstitution after lentiviral vector-mediated gene therapy in patients with Wiskott-Aldrich syndrome. J. Allergy Clin. Immunol. 136, 692–702 (2015). · DOI
  29. Rengan, R. et al. Actin cytoskeletal function is spared, but apoptosis is increased, in WAS patient hematopoietic cells. Blood 95, 1283–1292 (2000). · DOI
  30. Westerberg, L. S. et al. WASP confers selective advantage for specific hematopoietic cell populations and serves a unique role in marginal zone B-cell homeostasis and function. Blood 112, 4139–4147 (2008). · DOI
  31. Sabri, S. et al. Deficiency in the Wiskott-Aldrich protein induces premature proplatelet formation and platelet production in the bone marrow compartment. Blood 108, 134–140 (2006). · DOI
  32. Sereni, L. et al. Autonomous role of Wiskott-Aldrich syndrome platelet deficiency in inducing autoimmunity and inflammation. J. Allergy Clin. Immunol. 142, 1272–1284 (2018). · DOI
  33. Sereni, L. et al. Lentiviral gene therapy corrects platelet phenotype and function in patients with Wiskott-Aldrich syndrome. J. Allergy Clin. Immunol. 144, 825–838 (2019). · DOI
  34. Charrier, S. et al. Wiskott-Aldrich syndrome protein-deficient hematopoietic cells can be efficiently mobilized by granulocyte colony-stimulating factor. Haematologica 98, 1300–1308 (2013). · DOI
  35. Muñoz, P. et al. WAS promoter-driven lentiviral vectors mimic closely the lopsided WASP expression during megakaryocytic differentiation. Mol. Ther. Methods Clin. Dev. 19, 220–235 (2020). · DOI
  36. Astrakhan, A. et al. Ubiquitous high-level gene expression in hematopoietic lineages provides effective lentiviral gene therapy of murine Wiskott-Aldrich syndrome. Blood 119, 4395–4407 (2012). · DOI
  37. Singh, S. et al. Safe and effective gene therapy for murine Wiskott-Aldrich syndrome using an insulated lentiviral vector. Mol. Ther. Methods Clin. Dev. 4, 1–16 (2016). · DOI · Paper page
  38. Dupré, L. et al. Wiskott-Aldrich syndrome protein regulates lipid raft dynamics during immunological synapse formation. Immunity 17, 157–166 (2002). · DOI
  39. Schatorjé, E. J. H. et al. Paediatric reference values for the peripheral T cell compartment. Scand. J. Immunol. 75, 436–444 (2012). · DOI
  40. Segel, G. & Halterman, J. Neutropenia in pediatric practice. Pediatr. Rev. 29, 12–23 (2008). · DOI
  41. Picard, C. Comment explorer un déficit immunitaire héréditaire? Rev. Prat. 57, 1671–1676 (2007).
  42. Arruda, L. C. M. et al. Immune rebound associates with a favorable clinical response to autologous HSCT in systemic sclerosis patients. Blood Adv. 2, 126–141 (2018). · DOI
  43. Brüggemann, M. et al. Standardized next-generation sequencing of immunoglobulin and T-cell receptor gene recombinations for MRD marker identification in acute lymphoblastic leukaemia; a EuroClonality-NGS validation study. Leukemia 33, 2241–2253 (2019). · DOI
  44. Houmadi, R. et al. The Wiskott-Aldrich syndrome protein contributes to the assembly of the LFA-1 nanocluster belt at the lytic synapse. Cell Rep. 22, 979–991 (2018). · DOI
  45. Adam, F., Verbeuren, T. J., Fauchère, J. L., Guillin, M. C. & Jandrot-Perrus, M. Thrombin-induced platelet PAR4 activation: role of glycoprotein ibandadp. J. Thromb. Haemost. 1, 798–804 (2003). · DOI
  46. Adam, F. et al. Platelet JNK1 is involved in secretion and thrombus formation. Blood 115, 4083–4092 (2010). · DOI
  47. Berrou, E. et al. A mutation of the human EPHB2 gene leads to a major platelet functional defect. Blood 132, 2067–2077 (2018). · DOI
  48. Kiefel, V., Santoso, S., Weisheit, M. & Mueller-Eckhardt, C. Monoclonal antibody-specific immobilization of platelet antigens (MAIPA): a new tool for the identification of platelet-reactive antibodies. Blood 70, 1722–1726 (1987). · DOI
  49. Sherman, E. et al. INSPIIRED: a pipeline for quantitative analysis of sites of new DNA integration in cellular genomes. Mol. Ther. Methods Clin. Dev. 4, 39–49 (2017). · DOI
  50. Berry, C. C. et al. INSPIIRED: quantification and visualization tools for analyzing integration site distributions. Mol. Ther. Methods Clin. Dev. 4, 17–26 (2017). · DOI
  51. Six, E. et al. Clonal tracking in gene therapy patients reveals a diversity of human hematopoietic differentiation programs. Blood 135, 1219–1231 (2020). · DOI

Cited by

Metadata

Authors
Magnani, A., Semeraro, M., Adam, F., Booth, C., Dupré, L., Morris, E. C., Gabrion, A., Roudaut, C., Borgel, D., Toubert, A., Clave, E., Abdo, C., Gorochov, G., Petermann, R., Guiot, M., Miyara, M., Moshous, D., Magrin, E., Denis, A., Suarez, F., Lagresle, C., Roche, A. M., Everett, J., Trinquand, A., Guisset, M., Bayford, J. X., Hacein-Bey-Abina, S., Kauskot, A., Elfeky, R., Rivat, C., Abbas, S., Gaspar, H. B., Macintyre, E., Picard, C., Bushman, F. D., Galy, A., Fischer, A., Six, E., Thrasher, A. J., & Cavazzana, M.
Venue
Nature Medicine
Published
2022-01
Volume
28
Issue
1
Pages
71-80
ISSN
  • 1078-8956
  • 1546-170X
Cited by
128
References
1
Language
en
Funders
Agence Nationale de la Recherche (ANR-10-IAHU-01)

About these checks

Registry, retraction, Cites and statistics results are computed, not judged, with one exception: a printed reference that no index lists is read once by a model before it counts as a citation error. Claims are extracted by a model and kept only when their quote appears verbatim in the text; each cited source is then checked, with a model’s help, for whether it says what the claim relies on. Those verdicts can be wrong — read the claim’s quote and the cited source before relying on one.

Statistics and arithmetic are recomputed, not judged.

Confidence bands are shown only for fields calibrated on our annotated test set. None is calibrated yet, so no band is shown.

What counts as a claim ›How we measure confidence ›How we check this ›

Are you an author, or do you see a problem with this page? Request a review