CoChat

Association between pathologic response and survival after neoadjuvant therapy in lung cancer

Open access

The DOI matches its Crossref record; 40 of the 41 references it cites were found in a registry or an index.

Abstract

Neoadjuvant immunotherapy plus chemotherapy improves event-free survival (EFS) and pathologic complete response (0% residual viable tumor (RVT) in primary tumor (PT) and lymph nodes (LNs)), and is approved for treatment of resectable lung cancer. Pathologic response assessment after neoadjuvant therapy is the potential analog to radiographic response for advanced disease. However, %RVT thresholds beyond pathologic complete response and major pathologic response (≤10% RVT) have not been explored. Pathologic response was prospectively assessed in the randomized, phase 3 CheckMate 816 trial (NCT02998528), which evaluated neoadjuvant nivolumab (anti-programmed death protein 1) plus chemotherapy in patients with resectable lung cancer. RVT, regression and necrosis were quantified (0–100%) in PT and LNs using a pan-tumor scoring system and tested for association with EFS in a prespecified exploratory analysis. Regardless of LN involvement, EFS improved with 0% versus >0% RVT-PT (hazard ratio = 0.18). RVT-PT predicted EFS for nivolumab plus chemotherapy (area under the curve = 0.74); 2-year EFS rates were 90%, 60%, 57% and 39% for patients with 0–5%, >5–30%, >30–80% and >80% RVT, respectively. Each 1% RVT associated with a 0.017 hazard ratio increase for EFS. Combining pathologic response from PT and LNs helped differentiate outcomes. When compared with radiographic response and circulating tumor DNA clearance, %RVT best approximated EFS. These findings support pathologic response as an emerging survival surrogate. Further assessment of the full spectrum of %RVT in lung cancer and other tumor types is warranted. ClinicalTrials.gov registration: NCT02998528 .

Overview

The claims and statistics of this paper haven’t been checked yet.

Free: it reads the open-access text and checks the first 5 claims that cite a source we can check. Create a free account to check every claim.

A few free checks a day · papers already verified open instantly · results are public

Integrity signals

Registry

Crossref · 10.1038/s41591-023-02660-6

Cites

40 of 40 references verified0 citation errors · 0 not checkable

Statistics

Figures

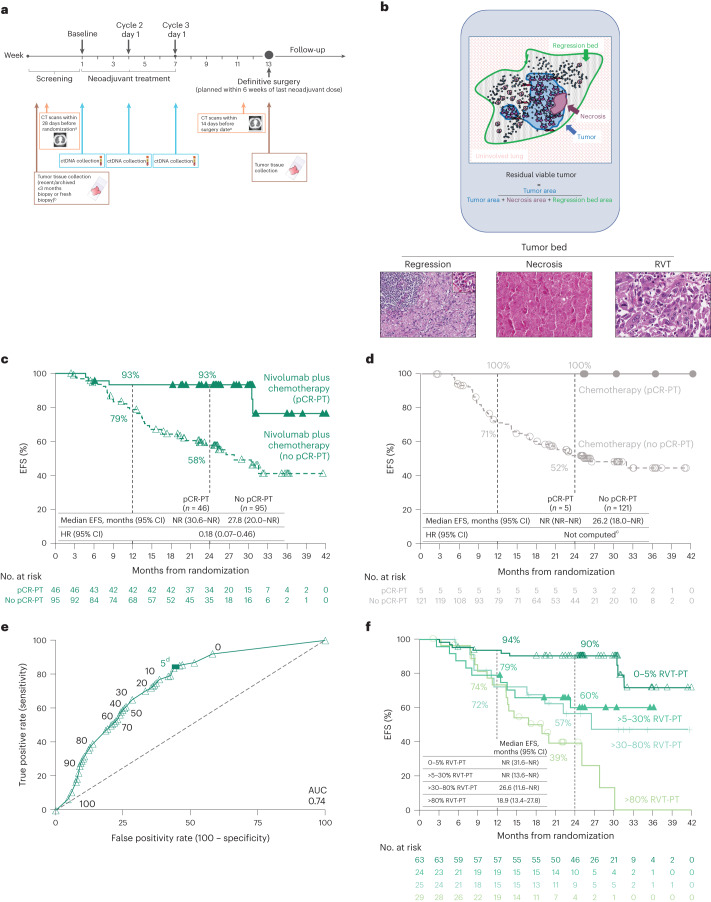
Fig. 1 EFS by pCR and RVT. a, CheckMate 816 timeline of sample collection for biomarker studies (radiographic imaging (orange), ctDNA (blue) and tumor tissue (brown)). b, Schematic of irPRC scoring. Representative photomicrographs show histologic components of the scoring system. The photomicrograph of regression shows a background zone of fibrosis with neovascularization with numerous TIL. A TLS is present in the upper left corner. The inset highlights a collection of plasma cells, which are commonly seen in areas of regression (hematoxylin and eosin staining). c,d, Kaplan–Meier curves of EFS by pCR status (PT) in the path-evaluable patient population in the nivolumab plus chemotherapy arm (c) and in the chemotherapy arm (d). e, ROC curve analysis of 2-year EFS rate by %RVT (PT) in the path-evaluable patient population for patients treated with nivolumab plus chemotherapy. f, Kaplan–Meier curves of EFS by %RVT categories (PT) in the path-evaluable patient population for patients treated with nivolumab plus chemotherapy. Database lock: 20 October 2021; minimum follow-up: 21 months for nivolumab plus chemotherapy and chemotherapy arms; median follow-up: 29.5 months. CT, computed tomography; EBUS, endobronchial ultrasound; NR, not reached; TIL, tumor infiltrating lymphocyte; TLS, tertiary lymphoid structure. aUsing RECIST1.1. bMediastinal lymph node sampling. All suspicious mediastinal lymph nodes require sampling for pathologic confirmation if accessible by EBUS, mediastinoscopy or thoracoscopy. cHR was not computed for the chemotherapy arm owing to only five patients having a pCR-PT. dThe solid square is the optimal cutoff, which is the difference between the true positive rate and false positive rate over all possible cutoff values.
Fig. 1 EFS by pCR and RVT. a, CheckMate 816 timeline of sample collection for biomarker studies (radiographic imaging (orange), ctDNA (blue) and tumor tissue (brown)). b, Schematic of irPRC scoring. Representative photomicrographs show histologic components of the scoring system. The photomicrograph of regression shows a background zone of fibrosis with neovascularization with numerous TIL. A TLS is present in the upper left corner. The inset highlights a collection of plasma cells, which are commonly seen in areas of regression (hematoxylin and eosin staining). c,d, Kaplan–Meier curves of EFS by pCR status (PT) in the path-evaluable patient population in the nivolumab plus chemotherapy arm (c) and in the chemotherapy arm (d). e, ROC curve analysis of 2-year EFS rate by %RVT (PT) in the path-evaluable patient population for patients treated with nivolumab plus chemotherapy. f, Kaplan–Meier curves of EFS by %RVT categories (PT) in the path-evaluable patient population for patients treated with nivolumab plus chemotherapy. Database lock: 20 October 2021; minimum follow-up: 21 months for nivolumab plus chemotherapy and chemotherapy arms; median follow-up: 29.5 months. CT, computed tomography; EBUS, endobronchial ultrasound; NR, not reached; TIL, tumor infiltrating lymphocyte; TLS, tertiary lymphoid structure. aUsing RECIST1.1. bMediastinal lymph node sampling. All suspicious mediastinal lymph nodes require sampling for pathologic confirmation if accessible by EBUS, mediastinoscopy or thoracoscopy. cHR was not computed for the chemotherapy arm owing to only five patients having a pCR-PT. dThe solid square is the optimal cutoff, which is the difference between the true positive rate and false positive rate over all possible cutoff values.CC BY · PubMed Central
Fig. 2 PT pathologic features in patients with path-evaluable samples. Pathologic features (histology, tumor PD-L1 status, tumor tissue TMB, LN involvement and TRAEs) for the path-evaluable population in the nivolumab plus chemotherapy (n = 141) and chemotherapy (n = 126) arms. LN involvement: yes indicates patients with pathologic evidence of LN disease at resection that had fully regressed (0% RVT) or had not regressed (>0% RVT) after neoadjuvant treatment. NA, not available. aMedian %RVT for nivolumab plus chemotherapy was 10.0% (squamous), 10.0% (nonsquamous), 35.0% (PD-L1 < 1%), 8.0% (PD-L1 1–49%), 0 (PD-L1 ≥ 50%), 30.0% (PD-L1 NA), 40.0% (TMB < 12.3 mut/Mb), 1.0% (TMB ≥ 12.3 mut/Mb), 10.0% (TMB NA), 35.0% (LN involvement), 1.0% (no LN involvement), 10.0% (TRAEs tissue grade 1/2), 23.0% (TRAEs grade 3/4) and 5.0% (No TRAE). bMedian %RVT for chemotherapy was 56.0% (squamous), 88.0% (nonsquamous), 69.0% (PD-L1 < 1%), 81.0% (PD-L1 1–49%), 60.0% (PD-L1 ≥ 50%), 94.0% (PD-L1 NA), 76.0% (TMB < 12.3 mut/Mb), 56.0% (TMB ≥ 12.3 mut/Mb), 77.0% (TMB NA), 82.5% (LN involvement), 62.5% (no LN involvement), 75.0% (TRAEs grade 1/2), 65.0% (TRAEs grade 3/4) and 90.5% (No TRAE).
Fig. 2 PT pathologic features in patients with path-evaluable samples. Pathologic features (histology, tumor PD-L1 status, tumor tissue TMB, LN involvement and TRAEs) for the path-evaluable population in the nivolumab plus chemotherapy (n = 141) and chemotherapy (n = 126) arms. LN involvement: yes indicates patients with pathologic evidence of LN disease at resection that had fully regressed (0% RVT) or had not regressed (>0% RVT) after neoadjuvant treatment. NA, not available. aMedian %RVT for nivolumab plus chemotherapy was 10.0% (squamous), 10.0% (nonsquamous), 35.0% (PD-L1 < 1%), 8.0% (PD-L1 1–49%), 0 (PD-L1 ≥ 50%), 30.0% (PD-L1 NA), 40.0% (TMB < 12.3 mut/Mb), 1.0% (TMB ≥ 12.3 mut/Mb), 10.0% (TMB NA), 35.0% (LN involvement), 1.0% (no LN involvement), 10.0% (TRAEs tissue grade 1/2), 23.0% (TRAEs grade 3/4) and 5.0% (No TRAE). bMedian %RVT for chemotherapy was 56.0% (squamous), 88.0% (nonsquamous), 69.0% (PD-L1 < 1%), 81.0% (PD-L1 1–49%), 60.0% (PD-L1 ≥ 50%), 94.0% (PD-L1 NA), 76.0% (TMB < 12.3 mut/Mb), 56.0% (TMB ≥ 12.3 mut/Mb), 77.0% (TMB NA), 82.5% (LN involvement), 62.5% (no LN involvement), 75.0% (TRAEs grade 1/2), 65.0% (TRAEs grade 3/4) and 90.5% (No TRAE).CC BY · PubMed Central
Fig. 3 PT regression and necrosis and EFS in the path-evaluable patient population. a,b, Difference in %regression-PT (a) and %necrosis-PT (b) between paired pretreatment and on-treatment tumor tissue specimens from individual patients (n = 47). c, Kaplan–Meier curves showing EFS by %necrosis-PT (0% versus >0%) in on-treatment specimens for all path-evaluable patients treated with nivolumab plus chemotherapy and chemotherapy.
Fig. 3 PT regression and necrosis and EFS in the path-evaluable patient population. a,b, Difference in %regression-PT (a) and %necrosis-PT (b) between paired pretreatment and on-treatment tumor tissue specimens from individual patients (n = 47). c, Kaplan–Meier curves showing EFS by %necrosis-PT (0% versus >0%) in on-treatment specimens for all path-evaluable patients treated with nivolumab plus chemotherapy and chemotherapy.CC BY · PubMed Central
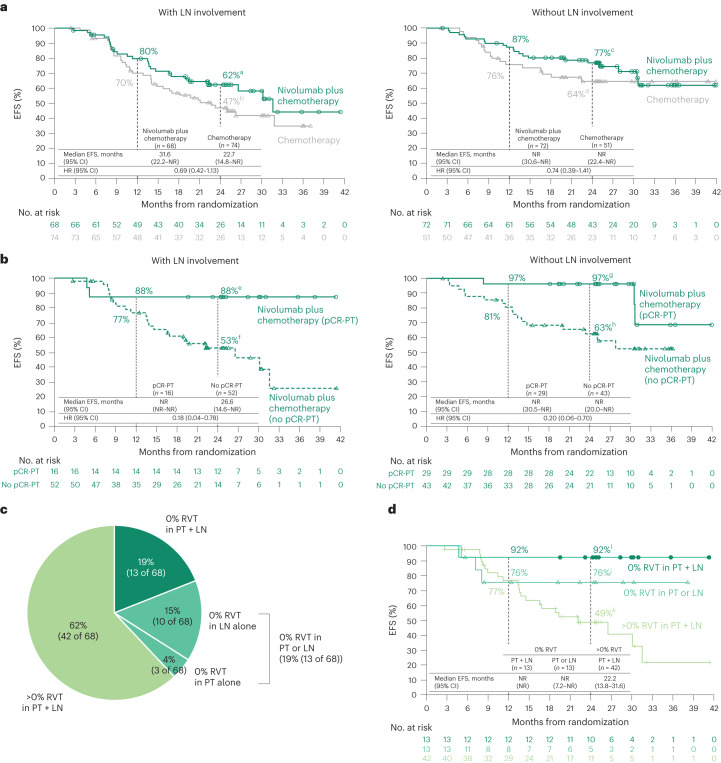
Fig. 4 Treatment efficacy in patients with or without pathologic evidence of LN involvement. a, Kaplan–Meier curves showing EFS by LN involvement. Among 358 patients concurrently randomized to the nivolumab plus chemotherapy and chemotherapy arms, 149 and 135 received treatment and had definitive surgery, respectively, and 140 and 125 had path-evaluable samples from both PT and LNs. b, Kaplan–Meier curves showing EFS by pCR status (PT) in patients with or without pathologic evidence of LN involvement who received nivolumab plus chemotherapy. c, Percent RVT in PT and LNs in patients receiving nivolumab plus chemotherapy. For comparison, in the chemotherapy arm: 0% RVT in both PT + LNs, 1% (1 of 74); in PT alone, 1% (1 of 74); in LNs alone, 4% (3 of 74); in either PT or LNs, 5% (4 of 74); and >0% RVT in PT + LNs, 93% (69 of 74). d, Kaplan–Meier curves showing EFS by %RVT in PT and LNs in patients receiving nivolumab plus chemotherapy. HRs were not computed because of the low number of events in the 0% RVT subgroups. LN involvement refers to pathologic evidence of LN disease at resection that had or had not fully regressed after neoadjuvant treatment (0% or >0% RVT in the resected LNs). 95% CIs: a49–73, b34–58, c65–85, d49–76, e59–97, f37–66, g78–100, h46–76, i57–99, j42–91, k32–64.
Fig. 4 Treatment efficacy in patients with or without pathologic evidence of LN involvement. a, Kaplan–Meier curves showing EFS by LN involvement. Among 358 patients concurrently randomized to the nivolumab plus chemotherapy and chemotherapy arms, 149 and 135 received treatment and had definitive surgery, respectively, and 140 and 125 had path-evaluable samples from both PT and LNs. b, Kaplan–Meier curves showing EFS by pCR status (PT) in patients with or without pathologic evidence of LN involvement who received nivolumab plus chemotherapy. c, Percent RVT in PT and LNs in patients receiving nivolumab plus chemotherapy. For comparison, in the chemotherapy arm: 0% RVT in both PT + LNs, 1% (1 of 74); in PT alone, 1% (1 of 74); in LNs alone, 4% (3 of 74); in either PT or LNs, 5% (4 of 74); and >0% RVT in PT + LNs, 93% (69 of 74). d, Kaplan–Meier curves showing EFS by %RVT in PT and LNs in patients receiving nivolumab plus chemotherapy. HRs were not computed because of the low number of events in the 0% RVT subgroups. LN involvement refers to pathologic evidence of LN disease at resection that had or had not fully regressed after neoadjuvant treatment (0% or >0% RVT in the resected LNs). 95% CIs: a49–73, b34–58, c65–85, d49–76, e59–97, f37–66, g78–100, h46–76, i57–99, j42–91, k32–64.CC BY · PubMed Central
Fig. 5 Relationship between pathology and other clinical/biomarker correlates. a, Representative case showing the potential disconnect between assessment of LN involvement on radiology and pathology. Top left, the pretreatment CT scan showed an enlarged LN. Bottom left, the CT scan just before surgical resection demonstrated an approximately 50% reduction in the size of the LN. Right, photomicrograph of the same LN in the definitive resection specimen showed an MPR (90% reduction in tumor), highlighting the underestimation of pathologic response by imaging. The regression bed is surrounded by a white dotted line and is shown on higher power in top right. RVT is shown in the lower right and is marked by yellow asterisks. b, Patients with LN involvement by imaging at baseline and by pathology at resection, across treatment arms. c, Radiographic (BOR per RECIST1.1) and pathologic response (%RVT) in PT, across treatment arms. d, ctDNA clearance and pathologic response (%RVT) in PT, across treatment arms. e, Association of EFS and survival surrogates for patients receiving nivolumab plus chemotherapy. BOR, best overall response; CL, clearance; CR, complete response; NE, not evaluable; PD, progressive disease; PR, partial response; RECIST1.1, Response Evaluation Criteria in Solid Tumors version 1.1; SD, stable disease. aData were not reported for two patients. bctDNA data were not available/not evaluable for 201 patients. cResponders = CR + PR; nonresponders = SD + PD. dIn the concurrently randomized population, 43 patients had 0% RVT in PT + LN versus 136 without 0% RVT in PT + LN (HR, 0.13; 95% CI, 0.05–0.37)19. eIn the concurrently randomized population, 24 patients had ctDNA CL versus 19 without ctDNA CL (HR, 0.60; 95% CI, 0.20–1.82)19.
Fig. 5 Relationship between pathology and other clinical/biomarker correlates. a, Representative case showing the potential disconnect between assessment of LN involvement on radiology and pathology. Top left, the pretreatment CT scan showed an enlarged LN. Bottom left, the CT scan just before surgical resection demonstrated an approximately 50% reduction in the size of the LN. Right, photomicrograph of the same LN in the definitive resection specimen showed an MPR (90% reduction in tumor), highlighting the underestimation of pathologic response by imaging. The regression bed is surrounded by a white dotted line and is shown on higher power in top right. RVT is shown in the lower right and is marked by yellow asterisks. b, Patients with LN involvement by imaging at baseline and by pathology at resection, across treatment arms. c, Radiographic (BOR per RECIST1.1) and pathologic response (%RVT) in PT, across treatment arms. d, ctDNA clearance and pathologic response (%RVT) in PT, across treatment arms. e, Association of EFS and survival surrogates for patients receiving nivolumab plus chemotherapy. BOR, best overall response; CL, clearance; CR, complete response; NE, not evaluable; PD, progressive disease; PR, partial response; RECIST1.1, Response Evaluation Criteria in Solid Tumors version 1.1; SD, stable disease. aData were not reported for two patients. bctDNA data were not available/not evaluable for 201 patients. cResponders = CR + PR; nonresponders = SD + PD. dIn the concurrently randomized population, 43 patients had 0% RVT in PT + LN versus 136 without 0% RVT in PT + LN (HR, 0.13; 95% CI, 0.05–0.37)19. eIn the concurrently randomized population, 24 patients had ctDNA CL versus 19 without ctDNA CL (HR, 0.60; 95% CI, 0.20–1.82)19.CC BY · PubMed Central
Extended Data Fig. 1 CheckMate 816 analysis population. Database lock: October 20, 2021; minimum follow-up: 21 months; median follow-up, 29.5 months. LN denotes lymph node; RVT, residual viable tumor. aRepresents patients with path-evaluable samples from both the primary tumor and LN; 141 and 126 patients in the nivolumab plus chemotherapy arm and the chemotherapy arm, respectively, had path-evaluable samples from the primary tumor only. bPathologic evidence of ≥0% RVT in LNs. c94 patients and d71 patients had LN involvement based on baseline radiographic imaging in the path-evaluable population; LN involvement refers to pathologic evidence of LN disease at resection that had or had not fully regressed after neoadjuvant treatment (0% or >0% RVT in the resected LN).
Extended Data Fig. 1 CheckMate 816 analysis population. Database lock: October 20, 2021; minimum follow-up: 21 months; median follow-up, 29.5 months. LN denotes lymph node; RVT, residual viable tumor. aRepresents patients with path-evaluable samples from both the primary tumor and LN; 141 and 126 patients in the nivolumab plus chemotherapy arm and the chemotherapy arm, respectively, had path-evaluable samples from the primary tumor only. bPathologic evidence of ≥0% RVT in LNs. c94 patients and d71 patients had LN involvement based on baseline radiographic imaging in the path-evaluable population; LN involvement refers to pathologic evidence of LN disease at resection that had or had not fully regressed after neoadjuvant treatment (0% or >0% RVT in the resected LN).CC BY · PubMed Central
Extended Data Fig. 2 Kaplan–Meier curves of EFS by pCR status (PT) and disease characteristics in the path-evaluable patient population from the nivolumab plus chemotherapy arm. a, Kaplan–Meier curves of EFS by pCR status (PT) and baseline disease stage. b, Kaplan–Meier curves of EFS by pCR status (PT) and baseline PD-L1 expression. c, Kaplan–Meier curves of EFS by pCR status (PT) and histology. Subgroup analyses were not performed for the chemotherapy arm because of small sample sizes. HRs were not computed because of low number of events for the pCR-PT subgroups. CI denotes confidence interval; EFS, event-free survival; HR, hazard ratio; NR, not reached; pCR, pathologic complete response; PD-L1, programmed death ligand 1; PT, primary tumor.
Extended Data Fig. 2 Kaplan–Meier curves of EFS by pCR status (PT) and disease characteristics in the path-evaluable patient population from the nivolumab plus chemotherapy arm. a, Kaplan–Meier curves of EFS by pCR status (PT) and baseline disease stage. b, Kaplan–Meier curves of EFS by pCR status (PT) and baseline PD-L1 expression. c, Kaplan–Meier curves of EFS by pCR status (PT) and histology. Subgroup analyses were not performed for the chemotherapy arm because of small sample sizes. HRs were not computed because of low number of events for the pCR-PT subgroups. CI denotes confidence interval; EFS, event-free survival; HR, hazard ratio; NR, not reached; pCR, pathologic complete response; PD-L1, programmed death ligand 1; PT, primary tumor.CC BY · PubMed Central
Extended Data Fig. 3 Kaplan–Meier curves of EFS by MPR status (PT) in the path-evaluable patient population. CI denotes confidence interval; EFS, event-free survival; HR, hazard ratio; MPR, major pathologic response; NR, not reached; PT, primary tumor.
Extended Data Fig. 3 Kaplan–Meier curves of EFS by MPR status (PT) in the path-evaluable patient population. CI denotes confidence interval; EFS, event-free survival; HR, hazard ratio; MPR, major pathologic response; NR, not reached; PT, primary tumor.CC BY · PubMed Central
Extended Data Fig. 4 Depth of pathologic response (%RVT) in the PT of path-evaluable patients receiving nivolumab plus chemotherapy. The optimal value for %RVT (5% RVT) was calculated from the receiver operating characteristic curve analysis using the Youden’s index (that maximizes the true positive rate and minimizes the false positive rate). PT denotes primary tumor; RVT, residual viable tumor.
Extended Data Fig. 4 Depth of pathologic response (%RVT) in the PT of path-evaluable patients receiving nivolumab plus chemotherapy. The optimal value for %RVT (5% RVT) was calculated from the receiver operating characteristic curve analysis using the Youden’s index (that maximizes the true positive rate and minimizes the false positive rate). PT denotes primary tumor; RVT, residual viable tumor.CC BY · PubMed Central
Extended Data Fig. 5 Pathologic features in patients with LN involvement. Pathologic features (histology, tumor PD-L1 status, tumor tissue TMB, and TRAEs) for the path-evaluable population with LN involvement in the nivolumab plus chemotherapy (n = 68) and chemotherapy (n = 74) arms. LN denotes lymph node; mut/Mb, mutations/megabase; NA, not available; PD-L1, programmed death ligand 1; RVT, residual viable tumor; TMB, tumor mutational burden; TRAE, treatment-related adverse event. aMedian %RVT for nivolumab plus chemotherapy was 25.0% (squamous), 50.0% (nonsquamous), 70.0% (PD-L1 < 1%), 25.0% (PD-L1 1–49%), 0 (PD-L1 ≥ 50%), 5.0% (PD-L1 NA), 90.0% (TMB < 12.3 mut/Mb), 8.0% (TMB ≥ 12.3 mut/Mb), 17.5% (TMB NA), 32.5% (TRAEs grade 1/2), 84.0% (TRAEs grade 3/4), and 0 (No TRAE). bMedian %RVT for chemotherapy was 83.5% (squamous), 99.5% (nonsquamous), 85.0% (PD-L1 < 1%), 99.5% (PD-L1 1–49%), 97.5% (PD-L1 ≥ 50%), 100% (PD-L1 NA), 96.0% (TMB < 12.3 mut/Mb), 100% (TMB ≥ 12.3 mut/Mb), 88.5% (TMB NA), 93.0% (TRAEs grade 1/2), 95.0% (TRAEs grade 3/4), and 100% (No TRAE).
Extended Data Fig. 5 Pathologic features in patients with LN involvement. Pathologic features (histology, tumor PD-L1 status, tumor tissue TMB, and TRAEs) for the path-evaluable population with LN involvement in the nivolumab plus chemotherapy (n = 68) and chemotherapy (n = 74) arms. LN denotes lymph node; mut/Mb, mutations/megabase; NA, not available; PD-L1, programmed death ligand 1; RVT, residual viable tumor; TMB, tumor mutational burden; TRAE, treatment-related adverse event. aMedian %RVT for nivolumab plus chemotherapy was 25.0% (squamous), 50.0% (nonsquamous), 70.0% (PD-L1 < 1%), 25.0% (PD-L1 1–49%), 0 (PD-L1 ≥ 50%), 5.0% (PD-L1 NA), 90.0% (TMB < 12.3 mut/Mb), 8.0% (TMB ≥ 12.3 mut/Mb), 17.5% (TMB NA), 32.5% (TRAEs grade 1/2), 84.0% (TRAEs grade 3/4), and 0 (No TRAE). bMedian %RVT for chemotherapy was 83.5% (squamous), 99.5% (nonsquamous), 85.0% (PD-L1 < 1%), 99.5% (PD-L1 1–49%), 97.5% (PD-L1 ≥ 50%), 100% (PD-L1 NA), 96.0% (TMB < 12.3 mut/Mb), 100% (TMB ≥ 12.3 mut/Mb), 88.5% (TMB NA), 93.0% (TRAEs grade 1/2), 95.0% (TRAEs grade 3/4), and 100% (No TRAE).CC BY · PubMed Central
Extended Data Fig. 6 PT regression and necrosis in the path-evaluable patient population. Paired pretreatment and on-treatment %regression-PT and %necrosis-PT in tissue specimens from individual patients by (a) histology (n = 24, squamous; n = 23, nonsquamous) and (b) treatment arm (n = 17, nivolumab plus chemotherapy; n = 30, chemotherapy). PT denotes primary tumor.
Extended Data Fig. 6 PT regression and necrosis in the path-evaluable patient population. Paired pretreatment and on-treatment %regression-PT and %necrosis-PT in tissue specimens from individual patients by (a) histology (n = 24, squamous; n = 23, nonsquamous) and (b) treatment arm (n = 17, nivolumab plus chemotherapy; n = 30, chemotherapy). PT denotes primary tumor.CC BY · PubMed Central
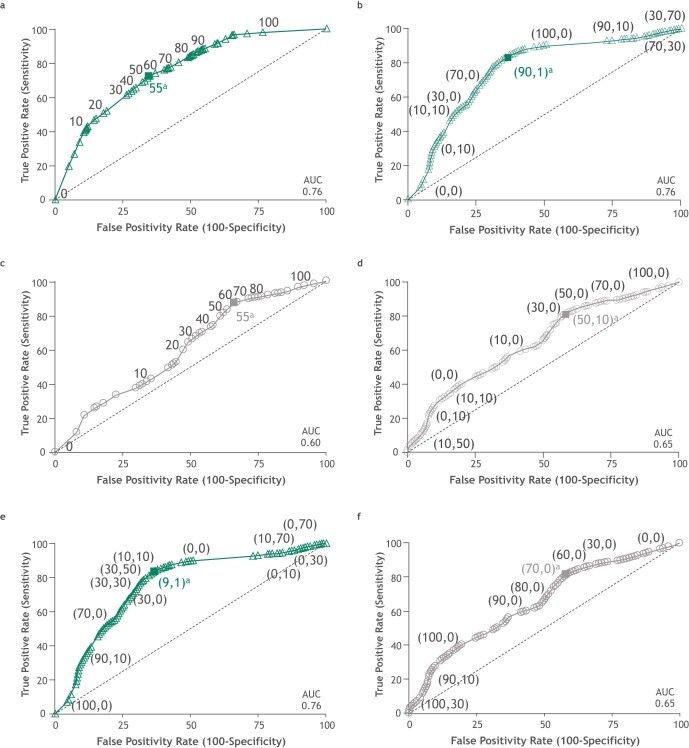
Extended Data Fig. 7 ROC curve analyses for regression and necrosis (PT) and combined %RVT plus necrosis (PT) in the path-evaluable patient population. a, ROC curve analysis of 2-year EFS rate by %regression-PT for patients treated with nivolumab plus chemotherapy. AUC = 0.76, similar to that for %RVT-PT. b, ROC curve analysis of 2-year EFS rate by %regression + necrosis-PT for patients treated with nivolumab plus chemotherapy; points are labeled as ‘(%regression-PT, %necrosis-PT)’. Addition of %necrosis-PT to %regression-PT did not increase AUC. c, ROC curve analysis of 2-year EFS rate by %regression-PT for patients treated with chemotherapy. d, ROC curve analysis of 2-year EFS rate by %regression + necrosis-PT for patients treated with chemotherapy; points are labeled as ‘(%regression-PT, %necrosis-PT)’. Considering necrosis may be a tumor-intrinsic parameter, it was combined with %RVT-PT in patients receiving nivolumab plus chemotherapy (e), and in patients receiving chemotherapy (f). However, %RVT + necrosis-PT did not greatly alter the AUC achieved with %RVT-PT alone. Points are labeled as ‘(%RVT-PT, %necrosis-PT)’. Nivolumab plus chemotherapy arm, n = 141; chemotherapy arm, n = 126. EFS denotes event-free survival; PT, primary tumor; ROC, receiver operating characteristic; RVT, residual viable tumor. aThe solid square is the optimal cutoff, which is the difference between the true positive rate and false positive rate over all possible cutoff values.
Extended Data Fig. 7 ROC curve analyses for regression and necrosis (PT) and combined %RVT plus necrosis (PT) in the path-evaluable patient population. a, ROC curve analysis of 2-year EFS rate by %regression-PT for patients treated with nivolumab plus chemotherapy. AUC = 0.76, similar to that for %RVT-PT. b, ROC curve analysis of 2-year EFS rate by %regression + necrosis-PT for patients treated with nivolumab plus chemotherapy; points are labeled as ‘(%regression-PT, %necrosis-PT)’. Addition of %necrosis-PT to %regression-PT did not increase AUC. c, ROC curve analysis of 2-year EFS rate by %regression-PT for patients treated with chemotherapy. d, ROC curve analysis of 2-year EFS rate by %regression + necrosis-PT for patients treated with chemotherapy; points are labeled as ‘(%regression-PT, %necrosis-PT)’. Considering necrosis may be a tumor-intrinsic parameter, it was combined with %RVT-PT in patients receiving nivolumab plus chemotherapy (e), and in patients receiving chemotherapy (f). However, %RVT + necrosis-PT did not greatly alter the AUC achieved with %RVT-PT alone. Points are labeled as ‘(%RVT-PT, %necrosis-PT)’. Nivolumab plus chemotherapy arm, n = 141; chemotherapy arm, n = 126. EFS denotes event-free survival; PT, primary tumor; ROC, receiver operating characteristic; RVT, residual viable tumor. aThe solid square is the optimal cutoff, which is the difference between the true positive rate and false positive rate over all possible cutoff values.CC BY · PubMed Central
Extended Data Fig. 8 Kaplan–Meier curves of EFS by pCR status (PT) in patients with or without pathologic evidence of LN involvement. a, Patients with LN involvement who received chemotherapy. b, Patients without LN involvement who received chemotherapy. CI denotes confidence interval; EFS, event-free survival; LN, lymph node; pCR, pathologic complete response; PT, primary tumor.
Extended Data Fig. 8 Kaplan–Meier curves of EFS by pCR status (PT) in patients with or without pathologic evidence of LN involvement. a, Patients with LN involvement who received chemotherapy. b, Patients without LN involvement who received chemotherapy. CI denotes confidence interval; EFS, event-free survival; LN, lymph node; pCR, pathologic complete response; PT, primary tumor.CC BY · PubMed Central
Extended Data Fig. 9 Kaplan–Meier curves of EFS by MPR status (PT) in patients with or without pathologic evidence of LN involvement. a, Patients with LN involvement who received nivolumab plus chemotherapy and chemotherapy. b, Patients without LN involvement who received nivolumab plus chemotherapy and chemotherapy. CI denotes confidence interval; EFS, event-free survival; LN, lymph node; MPR, major pathologic response; PT, primary tumor.
Extended Data Fig. 9 Kaplan–Meier curves of EFS by MPR status (PT) in patients with or without pathologic evidence of LN involvement. a, Patients with LN involvement who received nivolumab plus chemotherapy and chemotherapy. b, Patients without LN involvement who received nivolumab plus chemotherapy and chemotherapy. CI denotes confidence interval; EFS, event-free survival; LN, lymph node; MPR, major pathologic response; PT, primary tumor.CC BY · PubMed Central
Extended Data Fig. 10 Relationship between radiology and pathology and other clinical/biomarker correlates. a, Patients with LN involvement by imaging at baseline and by pathology at resection by treatment arm. b, Radiographic (BOR per RECIST1.1) and pathologic response (%RVT) in PT. c, Radiographic (BOR per RECIST1.1) and pathologic response (%RVT) in LN, across treatment arms. d, Radiographic (BOR per RECIST1.1) and pathologic response (%RVT) in LN by treatment arm. e, ctDNA clearance and pathologic response (%RVT) in PT. f, ctDNA clearance and pathologic response (%RVT) in LN, across treatment arms. g, ctDNA clearance and pathologic response (%RVT) in LN by treatment arm. BOR denotes best overall response; CR complete response; LN, lymph node; MPR, major pathologic response; NE, not evaluable; pCR, pathologic complete response; PD, progressive disease; PR, partial response; PT, primary tumor; RECIST1.1, Response Evaluation Criteria in Solid Tumors version 1.1; RVT, residual viable tumor; SD, stable disease. aData were not reported for 1 patient. bctDNA data were not available/not evaluable for 108 patients. cctDNA data were not available/not evaluable for 93 patients. dctDNA data were not available/not evaluable for 109 patients. ectDNA data were not available/not evaluable for 53 patients. fctDNA data were not available/not evaluable for 56 patients.
Extended Data Fig. 10 Relationship between radiology and pathology and other clinical/biomarker correlates. a, Patients with LN involvement by imaging at baseline and by pathology at resection by treatment arm. b, Radiographic (BOR per RECIST1.1) and pathologic response (%RVT) in PT. c, Radiographic (BOR per RECIST1.1) and pathologic response (%RVT) in LN, across treatment arms. d, Radiographic (BOR per RECIST1.1) and pathologic response (%RVT) in LN by treatment arm. e, ctDNA clearance and pathologic response (%RVT) in PT. f, ctDNA clearance and pathologic response (%RVT) in LN, across treatment arms. g, ctDNA clearance and pathologic response (%RVT) in LN by treatment arm. BOR denotes best overall response; CR complete response; LN, lymph node; MPR, major pathologic response; NE, not evaluable; pCR, pathologic complete response; PD, progressive disease; PR, partial response; PT, primary tumor; RECIST1.1, Response Evaluation Criteria in Solid Tumors version 1.1; RVT, residual viable tumor; SD, stable disease. aData were not reported for 1 patient. bctDNA data were not available/not evaluable for 108 patients. cctDNA data were not available/not evaluable for 93 patients. dctDNA data were not available/not evaluable for 109 patients. ectDNA data were not available/not evaluable for 53 patients. fctDNA data were not available/not evaluable for 56 patients.CC BY · PubMed Central

Verification

Claims the paper makes

The claims and statistics of this paper haven’t been checked yet.

Free: it reads the open-access text and checks the first 5 claims that cite a source we can check. Create a free account to check every claim.

A few free checks a day · papers already verified open instantly · results are public

Claims other papers make about this one

Each is checked against this paper’s own text: does it say what the citing paper says it does?

Self-check

Percentages, sums and reported differences re-computed from the paper’s own numbers.

The self-check needs the paper’s full text.

Citations

Cites

Show all 40 references

Cited by

See all 198

Metadata

Authors
Deutsch, J. S., Cimino-Mathews, A., Thompson, E., Provencio, M., Forde, P. M., Spicer, J., Girard, N., Wang, D., Anders, R. A., Gabrielson, E., Illei, P., Jedrych, J., Danilova, L., Sunshine, J., Kerr, K. M., Tran, M., Bushong, J., Cai, J., Devas, V., Neely, J., Balli, D., Cottrell, T. R., Baras, A. S., & Taube, J. M.
Affiliations
  • Johns Hopkins University (US)
  • Hospital Universitario Puerta de Hierro Majadahonda (ES)
  • McGill University Health Centre (CA)
  • Institut Curie (FR)
  • Aberdeen Royal Infirmary (GB)
  • Bristol-Myers Squibb (United States) (US)
  • Queen's University (CA)
Corresponding author
Taube, Janis M.
Venue
Nature Medicine
Published
2023-10-30
Volume
30
Issue
1
Pages
218-228
ISSN
  • 1078-8956 (ISSN-L)
  • 1546-170X
OpenAlex
W4388033556
Cited by
198
References
41
Citations by year
2026: 63 · 2025: 80 · 2024: 54 · 2023: 1
FWCI
36.48
Type
journal article
Language
en
Open access
Licence
Locations
  • Nature Medicine (publishedVersion, cc-by)
  • PubMed Central (publishedVersion, cc-by)
  • PubMed (publishedVersion)
Funders
  • U.S. Department of Defense
  • Mesothelioma Applied Research Foundation
  • LUNGevity Foundation
  • Amgen
  • Bristol-Myers Squibb
  • Eli Lilly and Company
  • Pfizer
  • AstraZeneca
  • Sanofi
  • Regeneron Pharmaceuticals
  • Society for Immunotherapy of Cancer
  • Mark Foundation For Cancer Research
  • F-star Therapeutics
  • G1 Therapeutics
  • Canadian Association of Thoracic Surgeons
  • Ono Pharmaceutical
  • National Institutes of Health
  • Genentech
  • National Cancer Institute (R01CA142779)
  • Congressionally Directed Medical Research Programs
Topics
  • Health Sciences › Medicine › Pulmonary and Respiratory Medicine › Lung Cancer Diagnosis and Treatment
  • Health Sciences › Medicine › Oncology › Cancer Immunotherapy and Biomarkers
  • Health Sciences › Medicine › Oncology › Lung Cancer Research Studies
Keywords
lung cancer, neoadjuvant therapy, pathological response, residual viable tumor, event-free survival, nivolumab, immune checkpoint inhibitors, chemotherapy, resectable lung cancer, lymph node involvement, circulating tumor DNA, surrogate endpoints, CheckMate 816
MeSH terms
Nivolumab, Progression-Free Survival, Pathologic Complete Response, Antineoplastic Combined Chemotherapy Protocols, Humans, Lung Neoplasms, Randomized Controlled Trials as Topic, Treatment Outcome, Clinical Trials, Phase III as Topic, Neoadjuvant Therapy

About these checks

Registry, retraction, Cites and statistics results are computed, not judged, with one exception: a printed reference that no index lists is read once by a model before it counts as a citation error. Claims are extracted by a model and kept only when their quote appears verbatim in the text; each cited source is then checked, with a model’s help, for whether it says what the claim relies on. Those verdicts can be wrong — read the claim’s quote and the cited source before relying on one.

Statistics and arithmetic are recomputed, not judged.

Confidence bands are shown only for fields calibrated on our annotated test set. None is calibrated yet, so no band is shown.

What counts as a claim ›How we measure confidence ›How we check this ›

Are you an author, or do you see a problem with this page? Request a review

How to cite

Cite CoChat for the checks on this page, and the paper for its own findings.

This page
CoChat. (2026). Citation check: Association between pathologic response and survival after neoadjuvant therapy in lung cancer. https://app.cochat.ai/papers/10.1038/s41591-023-02660-6
The paper
Deutsch, J. S., Cimino-Mathews, A., Thompson, E., Provencio, M., Forde, P. M., Spicer, J., Girard, N., Wang, D., Anders, R. A., Gabrielson, E., Illei, P., Jedrych, J., Danilova, L., Sunshine, J., Kerr, K. M., Tran, M., Bushong, J., Cai, J., Devas, V., . . . Taube, J. M. (2024). Association between pathologic response and survival after neoadjuvant therapy in lung cancer. Nature Medicine. https://doi.org/10.1038/s41591-023-02660-6

Data sources

Bibliographic data: Semantic Scholar, OpenAlex, Crossref.

Contains information from the Semantic Scholar Academic Graph Datasets, made available under the ODC Attribution License (ODC-BY 1.0).

Semantic Scholar’s data is described in: Kinney, R., et al. (2023). The Semantic Scholar Open Data Platform. arXiv:2301.10140.