Cited by 105Epigenetics and DNA MethylationSingle-cell and spatial transcriptomicsGenomics and Chromatin Dynamics

The DOI matches its Crossref record; 98 of the 99 references it cites were found in a registry or an index.

A pan-tissue DNA methylation atlas enables in silico decomposition of human tissue methylomes at cell-type resolution

Open access

Abstract

Bulk-tissue DNA methylomes represent an average over many different cell types, hampering our understanding of cell-type-specific contributions to disease development. As single-cell methylomics is not scalable to large cohorts of individuals, cost-effective computational solutions are needed, yet current methods are limited to tissues such as blood. Here we leverage the high-resolution nature of tissue-specific single-cell RNA-sequencing datasets to construct a DNA methylation atlas defined for 13 solid tissue types and 40 cell types. We comprehensively validate this atlas in independent bulk and single-nucleus DNA methylation datasets. We demonstrate that it correctly predicts the cell of origin of diverse cancer types and discovers new prognostic associations in olfactory neuroblastoma and stage 2 melanoma. In brain, the atlas predicts a neuronal origin for schizophrenia, with neuron-specific differential DNA methylation enriched for corresponding genome-wide association study risk loci. In summary, the DNA methylation atlas enables the decomposition of 13 different human tissue types at a high cellular resolution, paving the way for an improved interpretation of epigenetic data.

Overview

The claims and statistics of this paper haven’t been checked yet.

Run the check — free, no account needed. It reads the open-access text and checks the sources it cites.

A few free checks a day · papers already verified open instantly · results are public

Integrity signals

Registry

Crossref · 10.1038/s41592-022-01412-7

Cites

98 of 98 references verified0 citation errors · 0 not checkable

Statistics

Figures

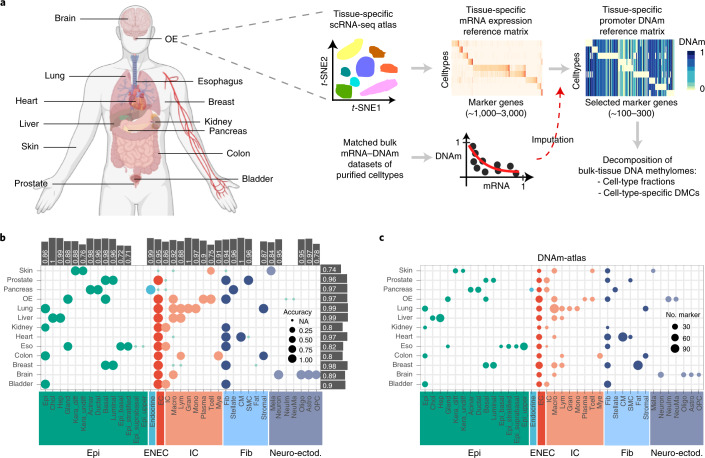
Fig. 1 Construction of the DNAm-atlas. a, Diagram illustrating the 13 tissue types chosen to build the DNAm-atlas resource, a database of corresponding tissue-specific DNAm reference matrices. Flowchart depicts the construction of a tissue-specific DNAm reference matrix. b, Validation of the mRNA expression reference matrices for each tissue and cell type in independent scRNA-seq datasets. Bars indicate the averaged validation accuracy for each cell type and tissue, respectively (top and right of balloon plot). OE, olfactory epithelium; Eso, esophagus. c, Balloon plot representing the DNAm-atlas resource, indicating which cell types are represented in each tissue and how many marker genes for each cell type. Source data
Fig. 1 Construction of the DNAm-atlas. a, Diagram illustrating the 13 tissue types chosen to build the DNAm-atlas resource, a database of corresponding tissue-specific DNAm reference matrices. Flowchart depicts the construction of a tissue-specific DNAm reference matrix. b, Validation of the mRNA expression reference matrices for each tissue and cell type in independent scRNA-seq datasets. Bars indicate the averaged validation accuracy for each cell type and tissue, respectively (top and right of balloon plot). OE, olfactory epithelium; Eso, esophagus. c, Balloon plot representing the DNAm-atlas resource, indicating which cell types are represented in each tissue and how many marker genes for each cell type. Source dataCC BY · PubMed Central
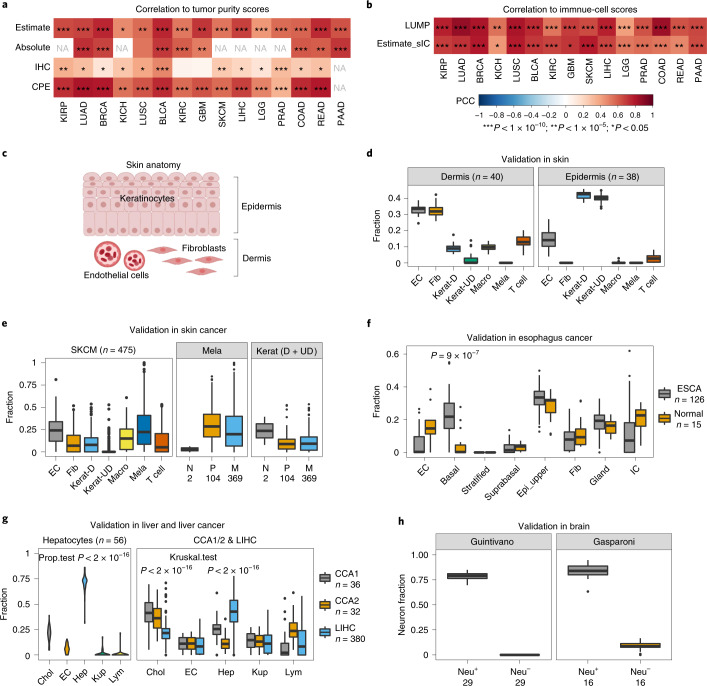
Fig. 2 Validation of the DNAm-atlas. a,b, Systematic validation of the DNAm-atlas tissue-specific DNAm reference matrices in the corresponding Illumina 450k DNAm datasets from TCGA. Heat map depicts the Pearson correlation coefficients (PCCs) between the tumor purity, as estimated using our DNAm-atlas and the tumor purity estimated with different methods, including ESTIMATE, ABSOLUTE (CNV-based), IHC and CPE (a). Data as for a, but for PCCs between total immune cell fraction, as estimated using DNAm-atlas, and corresponding total immune cell fraction obtained by other methods (ESTIMATE and LUMP) (b). * indicates statistical significance level (P value thresholds) as shown in b. P values were derived from a one-tailed correlation test. c, Depiction of skin’s anatomy. d, Validation of the DNAm reference matrix for skin in healthy bulk skin tissue (Illumina 450k DNAm data) from dermis and epidermis. Box plots display the estimated cell-type fractions for each cell type in the DNAm reference matrix: EC, endothelial cell; Fib, fibroblast; Kerat-D, differentiated keratinocytes; Kerat-UD, undifferentiated keratinocytes; Macro, macrophages; Mela, melanocytes. e, Validation of the DNAm reference matrix for skin in the skin cutaneous melanoma TCGA 450k DNAm dataset. Box plot displays the estimated cell-type fractions for each cell type across all primary and metastatic melanomas (left). Box plots display the estimated cell-type fractions for Mela and total keratinocytes (differentiated and undifferentiated) stratified by disease status: N, normal; P, primary melanoma; M, metastatic melanoma (right). f, Validation of the esophagus DNAm reference matrix in esophageal cancer (TCGA-ESCA). Box plots display estimated cell-type fractions in healthy and cancer (ESCA) samples. P value is from a one-tailed Wilcoxon test comparing the basal fraction between ESCA and healthy samples. g, Validation of the DNAm reference matrix for liver in hepatocytes and liver cancer. Box plot displays the estimated cell-type fractions in an Illumina EPIC DNAm dataset of primary hepatocytes for each cell type in the liver DNAm reference matrix: Chol, cholangiocyte; Hep, hepatocyte; Kup, Kupffer cell; Lym, lymphocyte (left). P value is from a one-tailed test for proportions. Box plot displays the estimated cell-type fractions in two independent Illumina DNAm datasets profiling cholangiocarcinoma (CCA1 and CCA2) and hepatocellular carcinoma (LIHC) (right). P values derive from one-tailed Wilcoxon rank-sum tests, comparing the estimated cholangiocyte fraction in CCA samples to LIHC and vice versa comparing the estimated hepatocyte fraction in LIHC to CCA samples. h, Validation of the DNAm reference matrix in purified neuronal (Neu+) and non-neuronal (Neu−) fractions. Box plots display the estimated neuron fractions in two independent DNAm datasets, profiling FACS-sorted neuronal (Neu+) and non-neuronal (Neu−) cell populations. In all box plots, the central bar denotes the median, the box width defines the interquartile range (IQR) and whiskers extend to 1.5 × IQR in either direction. Source data
Fig. 2 Validation of the DNAm-atlas. a,b, Systematic validation of the DNAm-atlas tissue-specific DNAm reference matrices in the corresponding Illumina 450k DNAm datasets from TCGA. Heat map depicts the Pearson correlation coefficients (PCCs) between the tumor purity, as estimated using our DNAm-atlas and the tumor purity estimated with different methods, including ESTIMATE, ABSOLUTE (CNV-based), IHC and CPE (a). Data as for a, but for PCCs between total immune cell fraction, as estimated using DNAm-atlas, and corresponding total immune cell fraction obtained by other methods (ESTIMATE and LUMP) (b). * indicates statistical significance level (P value thresholds) as shown in b. P values were derived from a one-tailed correlation test. c, Depiction of skin’s anatomy. d, Validation of the DNAm reference matrix for skin in healthy bulk skin tissue (Illumina 450k DNAm data) from dermis and epidermis. Box plots display the estimated cell-type fractions for each cell type in the DNAm reference matrix: EC, endothelial cell; Fib, fibroblast; Kerat-D, differentiated keratinocytes; Kerat-UD, undifferentiated keratinocytes; Macro, macrophages; Mela, melanocytes. e, Validation of the DNAm reference matrix for skin in the skin cutaneous melanoma TCGA 450k DNAm dataset. Box plot displays the estimated cell-type fractions for each cell type across all primary and metastatic melanomas (left). Box plots display the estimated cell-type fractions for Mela and total keratinocytes (differentiated and undifferentiated) stratified by disease status: N, normal; P, primary melanoma; M, metastatic melanoma (right). f, Validation of the esophagus DNAm reference matrix in esophageal cancer (TCGA-ESCA). Box plots display estimated cell-type fractions in healthy and cancer (ESCA) samples. P value is from a one-tailed Wilcoxon test comparing the basal fraction between ESCA and healthy samples. g, Validation of the DNAm reference matrix for liver in hepatocytes and liver cancer. Box plot displays the estimated cell-type fractions in an Illumina EPIC DNAm dataset of primary hepatocytes for each cell type in the liver DNAm reference matrix: Chol, cholangiocyte; Hep, hepatocyte; Kup, Kupffer cell; Lym, lymphocyte (left). P value is from a one-tailed test for proportions. Box plot displays the estimated cell-type fractions in two independent Illumina DNAm datasets profiling cholangiocarcinoma (CCA1 and CCA2) and hepatocellular carcinoma (LIHC) (right). P values derive from one-tailed Wilcoxon rank-sum tests, comparing the estimated cholangiocyte fraction in CCA samples to LIHC and vice versa comparing the estimated hepatocyte fraction in LIHC to CCA samples. h, Validation of the DNAm reference matrix in purified neuronal (Neu+) and non-neuronal (Neu−) fractions. Box plots display the estimated neuron fractions in two independent DNAm datasets, profiling FACS-sorted neuronal (Neu+) and non-neuronal (Neu−) cell populations. In all box plots, the central bar denotes the median, the box width defines the interquartile range (IQR) and whiskers extend to 1.5 × IQR in either direction. Source dataCC BY · PubMed Central
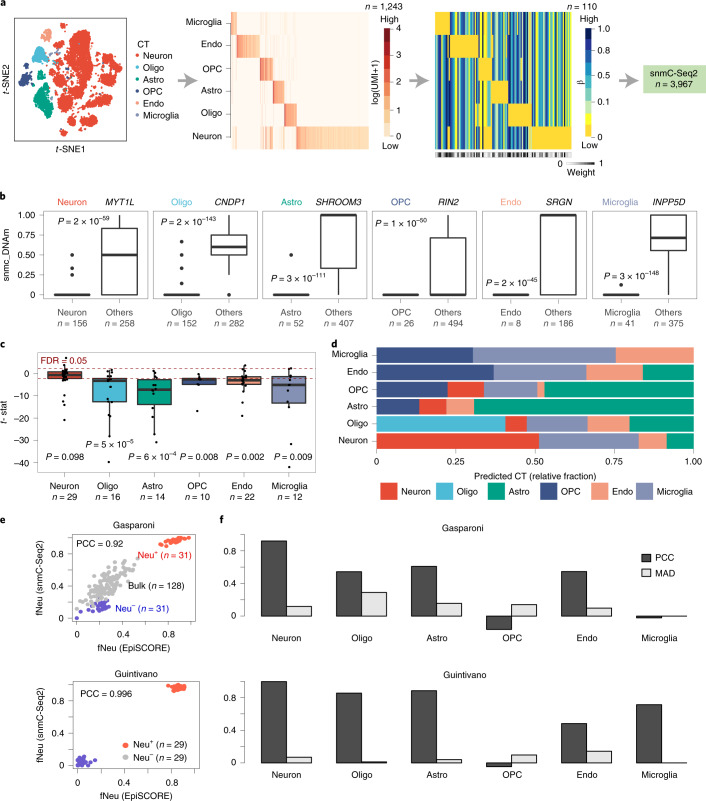
Fig. 3 Validation of the brain DNAm-atlas in single-nucleus prefrontal cortex data. a, t-distributed stochastic neighbor embedding (t-SNE) diagram of the scRNA-seq brain atlas data displaying the main cell types. From this atlas we built an mRNA expression reference matrix defined for 1,243 marker genes and six cell types, from which we imputed a corresponding DNAm reference matrix over 110 marker genes (gene-promoter DNAm) and the same six cell types. The weight bar at the bottom indicates which marker genes are expected to be reliable. This DNAm reference matrix was then evaluated in single-nucleus DNAm (snmC-Seq2) data from the prefrontal cortex. b, Box plots displaying snmC-Seq2 DNAm data mapping to the TSS200 promoter region of specific brain cell subtype marker genes, comparing the DNAm values (y axis) between cells annotated to the corresponding cell type and cells annotated to other cell types (‘others’). We display box plots for six marker genes, including the neuronal marker MYT1L, the oligodendrocyte marker ONDP1, the astrocyte marker SHR, the OPC marker RIN2, the endothelial marker SRGN and the microglia marker INPP5D. The P values are derived from a one-tailed t-test. c, Box plot displaying t-statistics for each marker gene, derived by comparing scnmC-Seq2 values in the cell type the gene is a marker of, against all other cell types. Box plots are shown for each cell type, including only those marker genes for that given cell type. Red dashed line indicates the false discovery rate (FDR) = 0.05 significance level for individual t-statistics. P value derives from a one-tailed Wilcoxon rank-sum test, with the alternative hypothesis being that the t-statistics are significantly <0 (significant hypomethylation at the promoters of the marker genes in the corresponding cell types they define). d, Bar plots displaying estimated cell-type fractions for each cell type, obtained by applying our weighted robust partial correlations (wRPC) framework to the mean DNAm profile of each cell type, obtained by averaging over all single cells annotated to that cell type. e, Scatter-plots of the estimated neuron fractions of both reference matrices (x axis labels the ones derived from our DNAm-atlas using EpiSCORE, y axis labels the ones derived from the pseudo-bulk snmC-Seq2 data in FACS-sorted neuronal (Neu+) and non-neuronal (Neu−) populations (Gasparoni and Guintivano), as well as in bulk frontal cortex tissue (only Gasparoni). In Gasparoni we display both Alzheimer and control samples. f, We display the PCC and MAD between the snmC-Seq2 and EpiSCORE derived cell-type fractions for each brain cell type. In all box plots, the central bar denotes the median, the box width defines the IQR and whiskers extend to 1.5 × IQR in either direction. Source data
Fig. 3 Validation of the brain DNAm-atlas in single-nucleus prefrontal cortex data. a, t-distributed stochastic neighbor embedding (t-SNE) diagram of the scRNA-seq brain atlas data displaying the main cell types. From this atlas we built an mRNA expression reference matrix defined for 1,243 marker genes and six cell types, from which we imputed a corresponding DNAm reference matrix over 110 marker genes (gene-promoter DNAm) and the same six cell types. The weight bar at the bottom indicates which marker genes are expected to be reliable. This DNAm reference matrix was then evaluated in single-nucleus DNAm (snmC-Seq2) data from the prefrontal cortex. b, Box plots displaying snmC-Seq2 DNAm data mapping to the TSS200 promoter region of specific brain cell subtype marker genes, comparing the DNAm values (y axis) between cells annotated to the corresponding cell type and cells annotated to other cell types (‘others’). We display box plots for six marker genes, including the neuronal marker MYT1L, the oligodendrocyte marker ONDP1, the astrocyte marker SHR, the OPC marker RIN2, the endothelial marker SRGN and the microglia marker INPP5D. The P values are derived from a one-tailed t-test. c, Box plot displaying t-statistics for each marker gene, derived by comparing scnmC-Seq2 values in the cell type the gene is a marker of, against all other cell types. Box plots are shown for each cell type, including only those marker genes for that given cell type. Red dashed line indicates the false discovery rate (FDR) = 0.05 significance level for individual t-statistics. P value derives from a one-tailed Wilcoxon rank-sum test, with the alternative hypothesis being that the t-statistics are significantly <0 (significant hypomethylation at the promoters of the marker genes in the corresponding cell types they define). d, Bar plots displaying estimated cell-type fractions for each cell type, obtained by applying our weighted robust partial correlations (wRPC) framework to the mean DNAm profile of each cell type, obtained by averaging over all single cells annotated to that cell type. e, Scatter-plots of the estimated neuron fractions of both reference matrices (x axis labels the ones derived from our DNAm-atlas using EpiSCORE, y axis labels the ones derived from the pseudo-bulk snmC-Seq2 data in FACS-sorted neuronal (Neu+) and non-neuronal (Neu−) populations (Gasparoni and Guintivano), as well as in bulk frontal cortex tissue (only Gasparoni). In Gasparoni we display both Alzheimer and control samples. f, We display the PCC and MAD between the snmC-Seq2 and EpiSCORE derived cell-type fractions for each brain cell type. In all box plots, the central bar denotes the median, the box width defines the IQR and whiskers extend to 1.5 × IQR in either direction. Source dataCC BY · PubMed Central
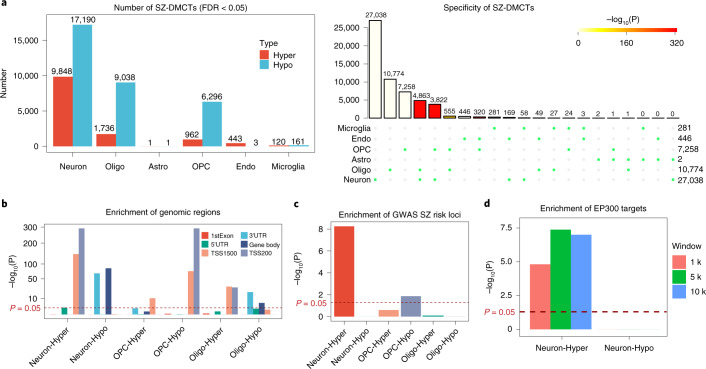
Fig. 4 Application of the brain DNAm-atlas to an EWAS of schizophrenia. a, Bar plots display the number of cell-type-specific SZ-associated DMCTs, as inferred using CellDMC in an EWAS of SZ performed in the prefrontal cortex. Upset plot (right) displays the overlap of DMCTs between cell types. P value was computed from a one-tailed Fisher’s exact test of multiple-set intersections. b, Enrichment of regulatory regions among DMCTs displaying only those cell types (neurons, oligodendrocytes and OPCs) with sufficient numbers of DMCTs. P value was computed from a one-tailed Fisher’s exact test. c, Enrichment of SZ-associated GWAS loci among the DMCTs displayed in f. P values were estimated using a one-tailed Fisher’s test. d, Enrichment of EP300 ChIP-seq targets among neuron DMCTs and for three different choices of window size (1 kb, 5 kb, 10 kb). P values were estimated using a one-tailed Wilcoxon rank-sum test comparing binding intensity of neuron-DMCT genes against the binding intensity of genes not linked to DMCTs. Source data
Fig. 4 Application of the brain DNAm-atlas to an EWAS of schizophrenia. a, Bar plots display the number of cell-type-specific SZ-associated DMCTs, as inferred using CellDMC in an EWAS of SZ performed in the prefrontal cortex. Upset plot (right) displays the overlap of DMCTs between cell types. P value was computed from a one-tailed Fisher’s exact test of multiple-set intersections. b, Enrichment of regulatory regions among DMCTs displaying only those cell types (neurons, oligodendrocytes and OPCs) with sufficient numbers of DMCTs. P value was computed from a one-tailed Fisher’s exact test. c, Enrichment of SZ-associated GWAS loci among the DMCTs displayed in f. P values were estimated using a one-tailed Fisher’s test. d, Enrichment of EP300 ChIP-seq targets among neuron DMCTs and for three different choices of window size (1 kb, 5 kb, 10 kb). P values were estimated using a one-tailed Wilcoxon rank-sum test comparing binding intensity of neuron-DMCT genes against the binding intensity of genes not linked to DMCTs. Source dataCC BY · PubMed Central
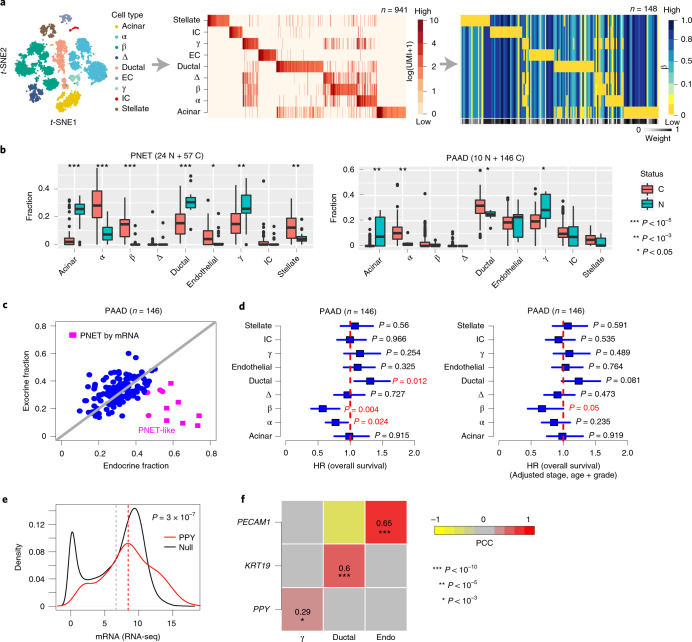
Fig. 5 DNAm-atlas reveals cell of origin of pancreatic cancers and misdiagnosed cases. a, t-SNE diagram of pancreas scRNA-seq atlas, from which the mRNA expression reference and the imputed DNAm reference matrices are derived. The weight bar indicates the confidence level of the markers in the DNAm reference matrix. References are defined over nine cell types, as shown. b, Estimated cell-type fraction using the DNAm reference matrix in a in an Illumina 450k DNAm dataset of PNETs (C) and normals (N) and in the TCGA PAAD cohort. P values derive from a two-tailed Wilcoxon rank-sum test. c, Scatter-plot of the total exocrine (ductal and acinar) fraction (y axis) versus endocrine (α, β, γ and δ) fraction in the PAADs of TCGA. In pink we highlight samples that our DNAm-atlas predicts to be neuroendocrine in origin. Samples labeled as pink squares have been independently confirmed by mRNA expression to be PNETs. d, Hazard ratio (HR) forest plots derived from Cox regressions of overall survival versus estimated cell-type fractions in PAADs from TCGA. HRs, 95% CIs and P values are derived from univariate two-tailed Cox regressions (left) or multivariate Cox regressions (right), which included stage, age and grade as covariates. e, Density curves comparing mRNA expression level of PPY, a highly specific marker for pancreatic γ cells, across 146 PAAD tumors from TCGA, against the distribution of average gene expression across the same samples (‘null distribution’). The red dashed line indicates the mean expression for PPY, the gray dashed value is the mean of the null. The P value is derived from a one-tailed Wilcoxon rank-sum test, confirming that PPY displays higher than average gene expression. f, PCC heat map between the estimated cell-type fractions from the DNAm-atlas for the three most abundant cell types (ductal, endothelial and γ cells) and the corresponding mRNA expression levels of ductal (KRT19), endothelial (PECAM1) and γ-specific (PPY) markers. PCCs and one-tailed linear correlation test P values were derived from 144 PAAD samples with matched mRNA and DNAm data. In all box plots, the central bar denotes the median, the box width defines the IQR and whiskers extend to 1.5 × IQR in either direction. Source data
Fig. 5 DNAm-atlas reveals cell of origin of pancreatic cancers and misdiagnosed cases. a, t-SNE diagram of pancreas scRNA-seq atlas, from which the mRNA expression reference and the imputed DNAm reference matrices are derived. The weight bar indicates the confidence level of the markers in the DNAm reference matrix. References are defined over nine cell types, as shown. b, Estimated cell-type fraction using the DNAm reference matrix in a in an Illumina 450k DNAm dataset of PNETs (C) and normals (N) and in the TCGA PAAD cohort. P values derive from a two-tailed Wilcoxon rank-sum test. c, Scatter-plot of the total exocrine (ductal and acinar) fraction (y axis) versus endocrine (α, β, γ and δ) fraction in the PAADs of TCGA. In pink we highlight samples that our DNAm-atlas predicts to be neuroendocrine in origin. Samples labeled as pink squares have been independently confirmed by mRNA expression to be PNETs. d, Hazard ratio (HR) forest plots derived from Cox regressions of overall survival versus estimated cell-type fractions in PAADs from TCGA. HRs, 95% CIs and P values are derived from univariate two-tailed Cox regressions (left) or multivariate Cox regressions (right), which included stage, age and grade as covariates. e, Density curves comparing mRNA expression level of PPY, a highly specific marker for pancreatic γ cells, across 146 PAAD tumors from TCGA, against the distribution of average gene expression across the same samples (‘null distribution’). The red dashed line indicates the mean expression for PPY, the gray dashed value is the mean of the null. The P value is derived from a one-tailed Wilcoxon rank-sum test, confirming that PPY displays higher than average gene expression. f, PCC heat map between the estimated cell-type fractions from the DNAm-atlas for the three most abundant cell types (ductal, endothelial and γ cells) and the corresponding mRNA expression levels of ductal (KRT19), endothelial (PECAM1) and γ-specific (PPY) markers. PCCs and one-tailed linear correlation test P values were derived from 144 PAAD samples with matched mRNA and DNAm data. In all box plots, the central bar denotes the median, the box width defines the IQR and whiskers extend to 1.5 × IQR in either direction. Source dataCC BY · PubMed Central
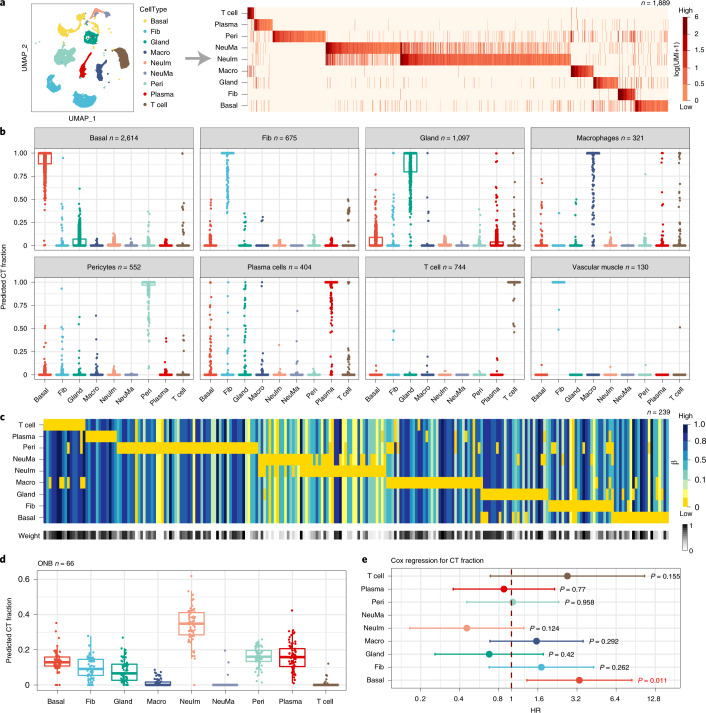
Fig. 6 Validation and application of the olfactory epithelium DNAm-atlas to ONBs. a, t-SNE diagram displaying the main cell types in the OE and the associated mRNA expression reference matrix, all derived from the Durante et al. scRNA-seq dataset of two OE samples. The reference matrix is defined over 1,889 marker genes and nine cell types, including pericytes, endothelial cells, T cells, plasma cells, immature and mature neurons, fibroblasts, glandular and basal cells. b, Validation of the mRNA expression reference matrix in independent scRNA-seq data from two respiratory epithelium (RE) samples. Box plots display the estimated cell-type fractions (y axis) for all RE samples annotated to a given cell type. In all box plots, the central bar denotes the median, the box width defines the IQR and whiskers extend to 1.5 × IQR in either direction. c, The imputed DNAm reference matrix for OE, as derived using the EpiSCORE algorithm, defined over 239 marker genes and the same nine cell types. Weight bar indicates the reliability of the marker genes for inferring cell-type fractions. d, Application of the DNAm reference matrix in c to Illumina 450k DNAm data from 66 ONBs, with box plot displaying the estimated cell-type fractions in the ONBs. In all box plots, the central bar denotes the median, the box width defines the IQR and whiskers extend to 1.5 × IQR in either direction. e, HR forest plot derived by Cox regression of overall survival against the estimated cell-type fractions. 95% CIs and chi-squared test two-tailed P values are given (n = 66). Source data
Fig. 6 Validation and application of the olfactory epithelium DNAm-atlas to ONBs. a, t-SNE diagram displaying the main cell types in the OE and the associated mRNA expression reference matrix, all derived from the Durante et al. scRNA-seq dataset of two OE samples. The reference matrix is defined over 1,889 marker genes and nine cell types, including pericytes, endothelial cells, T cells, plasma cells, immature and mature neurons, fibroblasts, glandular and basal cells. b, Validation of the mRNA expression reference matrix in independent scRNA-seq data from two respiratory epithelium (RE) samples. Box plots display the estimated cell-type fractions (y axis) for all RE samples annotated to a given cell type. In all box plots, the central bar denotes the median, the box width defines the IQR and whiskers extend to 1.5 × IQR in either direction. c, The imputed DNAm reference matrix for OE, as derived using the EpiSCORE algorithm, defined over 239 marker genes and the same nine cell types. Weight bar indicates the reliability of the marker genes for inferring cell-type fractions. d, Application of the DNAm reference matrix in c to Illumina 450k DNAm data from 66 ONBs, with box plot displaying the estimated cell-type fractions in the ONBs. In all box plots, the central bar denotes the median, the box width defines the IQR and whiskers extend to 1.5 × IQR in either direction. e, HR forest plot derived by Cox regression of overall survival against the estimated cell-type fractions. 95% CIs and chi-squared test two-tailed P values are given (n = 66). Source dataCC BY · PubMed Central

Verification

Claims the paper makes

The claims and statistics of this paper haven’t been checked yet.

Run the check — free, no account needed. It reads the open-access text and checks the sources it cites.

A few free checks a day · papers already verified open instantly · results are public

Claims other papers make about this one

Each is checked against this paper’s own text: does it say what the citing paper says it does?

Self-check

Percentages, sums and reported differences re-computed from the paper’s own numbers.

The self-check needs the paper’s full text.

Citations

Cites

Show all 99 references

Research works printed but not linked: 1

  1. Teschendorff, A.E., Zhu, T., Breeze, C.E. & Beck, S. EpiSCORE. GitHub https://github.com/aet21/EpiSCORE (2019). · DOI

Cited by

Sorted by citations

See all 105

Metadata

Authors
Zhu, T., Liu, J., Beck, S., Pan, S., Capper, D., Lechner, M., Thirlwell, C., Breeze, C. E., & Teschendorff, A. E.
Affiliations
  • Shanghai Institute of Nutrition and Health (CN)
  • University College London (GB)
  • German Cancer Research Center (DE)
  • Barts Health NHS Trust (GB)
  • Altius Institute for Biomedical Sciences (US)
Corresponding author
  • Breeze, Charles E.
  • Teschendorff, Andrew E.
Venue
Nature Methods
Published
2022-03
Volume
19
Issue
3
Pages
296-306
ISSN
  • 1548-7091 (ISSN-L)
  • 1548-7105
OpenAlex
W4221136004
Cited by
103
References
99
Citations by year
2026: 14 · 2025: 21 · 2024: 33 · 2023: 26 · 2022: 9
FWCI
7.43
Type
journal article
Language
en
Open access
Locations
  • Nature Methods (publishedVersion, cc-by)
  • PubMed Central (publishedVersion, cc-by)
  • PubMed (publishedVersion)
  • UCL Discovery (University College London) (submittedVersion)
Funders
National Science Foundation of China | National Natural Science Foundation of China-Yunnan Joint Fund (31970632)
Topics
  • Life Sciences › Biochemistry, Genetics and Molecular Biology › Molecular Biology › Epigenetics and DNA Methylation
  • Life Sciences › Biochemistry, Genetics and Molecular Biology › Molecular Biology › Single-cell and spatial transcriptomics
  • Life Sciences › Biochemistry, Genetics and Molecular Biology › Molecular Biology › Genomics and Chromatin Dynamics
Keywords
cell-type resolution, single-cell RNA sequencing, tumor cell of origin, olfactory neuroblastoma, melanoma, schizophrenia, neuronal origin
MeSH terms
Epigenome, Humans, Neurons, CpG Islands, DNA Methylation, Epigenesis, Genetic, Genome-Wide Association Study, Epigenomics

About these checks

Registry, retraction, Cites and statistics results are computed, not judged, with one exception: a printed reference that no index lists is read once by a model before it counts as a citation error. Claims are extracted by a model and kept only when their quote appears verbatim in the text; each cited source is then checked, with a model’s help, for whether it says what the claim relies on. Those verdicts can be wrong — read the claim’s quote and the cited source before relying on one.

Statistics and arithmetic are recomputed, not judged.

Confidence bands are shown only for fields calibrated on our annotated test set. None is calibrated yet, so no band is shown.

What counts as a claim ›How we measure confidence ›How we check this ›

Are you an author, or do you see a problem with this page? Request a review