

The DOI matches its Crossref record; 46 of the 46 references it cites were found in a registry or an index.
Systematic comparison of sequencing-based spatial transcriptomic methods
Open accessPublished version of a preprint
Abstract
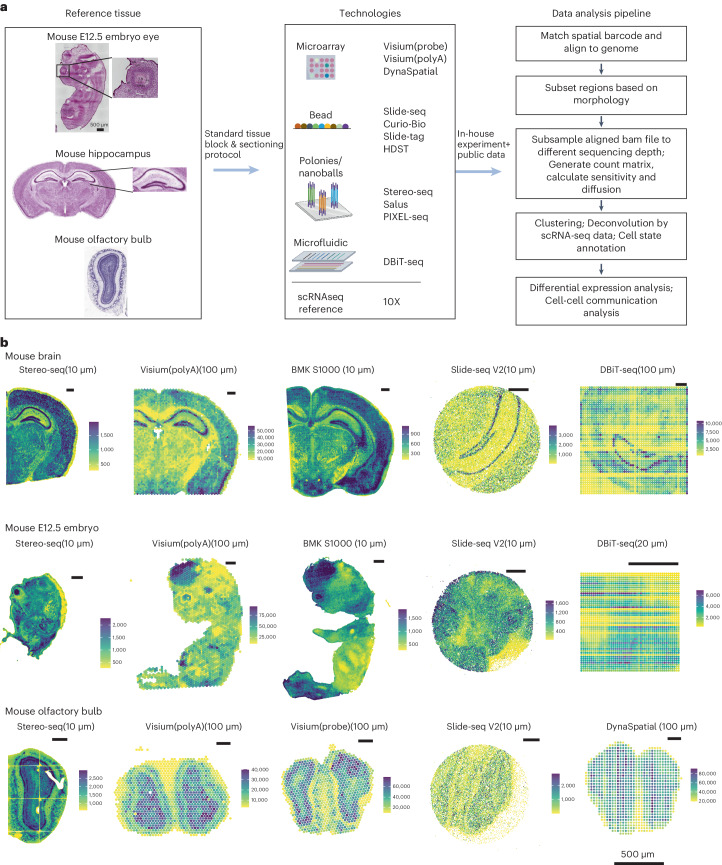
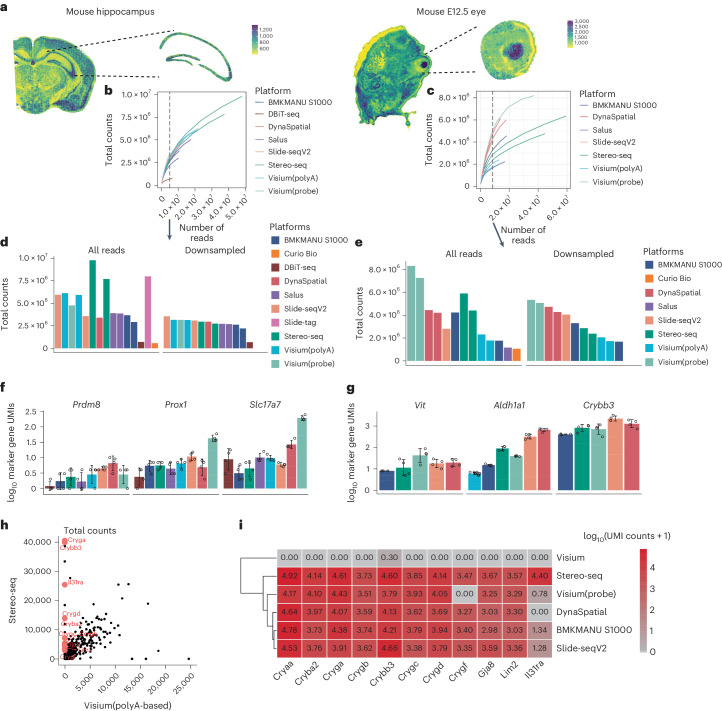
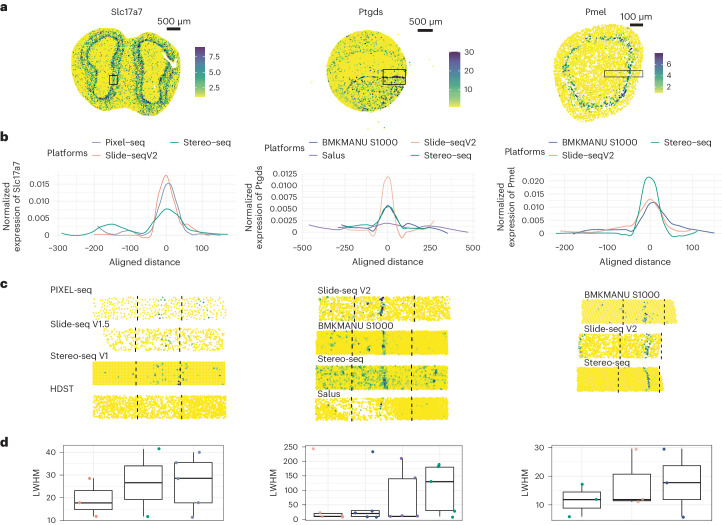
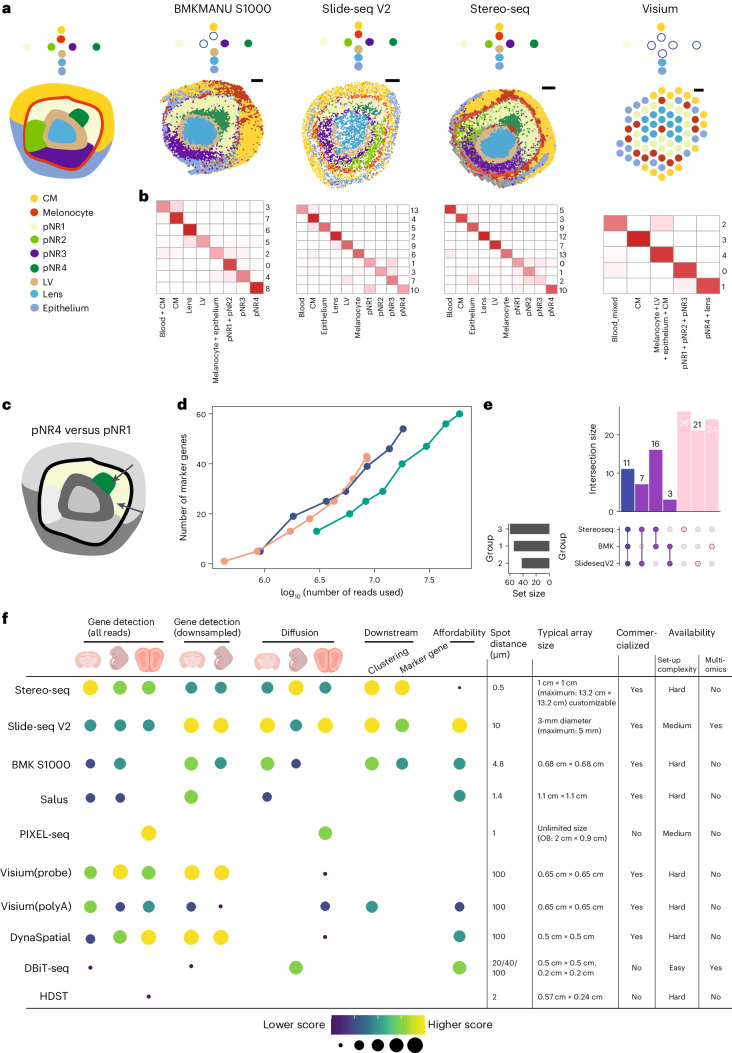
Recent developments of sequencing-based spatial transcriptomics (sST) have catalyzed important advancements by facilitating transcriptome-scale spatial gene expression measurement. Despite this progress, efforts to comprehensively benchmark different platforms are currently lacking. The extant variability across technologies and datasets poses challenges in formulating standardized evaluation metrics. In this study, we established a collection of reference tissues and regions characterized by well-defined histological architectures, and used them to generate data to compare 11 sST methods. We highlighted molecular diffusion as a variable parameter across different methods and tissues, significantly affecting the effective resolutions. Furthermore, we observed that spatial transcriptomic data demonstrate unique attributes beyond merely adding a spatial axis to single-cell data, including an enhanced ability to capture patterned rare cell states along with specific markers, albeit being influenced by multiple factors including sequencing depth and resolution. Our study assists biologists in sST platform selection, and helps foster a consensus on evaluation standards and establish a framework for future benchmarking efforts that can be used as a gold standard for the development and benchmarking of computational tools for spatial transcriptomic analysis.
Overview
The claims and statistics of this paper haven’t been checked yet.
Run the check — free, no account needed. It reads the open-access text and checks the sources it cites.
Integrity signals
Registry
Cites
Statistics
Figures
Verification
Claims the paper makes
The claims and statistics of this paper haven’t been checked yet.
Run the check — free, no account needed. It reads the open-access text and checks the sources it cites.
Self-check
Percentages, sums and reported differences re-computed from the paper’s own numbers.
The self-check needs the paper’s full text.
Citations
Cites
Comprehensive Integration of Single-Cell Data
Stuart, T., Butler, A., Hoffman, P., Hafemeister, C., Papalexi, E., Mauck, W. M., Hao, Y., Stoeckius, M., Smibert, P., & Satija, R. (2019) · Cell · doi:10.1016/j.cell.2019.05.031 · Cited by 15,453
Inference and analysis of cell-cell communication using CellChat
Jin, S., Guerrero-Juarez, C. F., Zhang, L., Chang, I., Ramos, R., Kuan, C.-H., Myung, P., Plikus, M. V., & Nie, Q. (2021) · Nature Communications · doi:10.1038/s41467-021-21246-9 · Cited by 8,409
Genome-wide atlas of gene expression in the adult mouse brain
Lein, E. S., Hawrylycz, M. J., Ao, N., Ayres, M., Bensinger, A., Bernard, A., Boe, A. F., Boguski, M. S., Brockway, K. S., Byrnes, E. J., et al. (2007) · Nature · doi:10.1038/nature05453 · Cited by 5,572 · cited 2×
“24, the integration of snRNA-seq data with sST data using Seurat aided the annotation of sST data.”
InfluentialSelf-citationVisualization and analysis of gene expression in tissue sections by spatial transcriptomics
Ståhl, P. L., Salmén, F., Vickovic, S., Lundmark, A., Navarro, J. F., Magnusson, J., Giacomello, S., Asp, M., Westholm, J. O., Huss, M., et al. (2016) · Science · doi:10.1126/science.aaf2403 · Cited by 3,834
Molecular Architecture of the Mouse Nervous System
Zeisel, A., Hochgerner, H., Lönnerberg, P., Johnsson, A., Memic, F., van der Zwan, J., Häring, M., Braun, E., Borm, L. E., La Manno, G., et al. (2018) · Cell · doi:10.1016/j.cell.2018.06.021 · Cited by 2,552
Slide-seq: A scalable technology for measuring genome-wide expression at high spatial resolution
Rodriques, S. G., Stickels, R. R., Goeva, A., Martin, C. A., Murray, E., Vanderburg, C. R., Welch, J., Chen, L. M., Chen, F., & Macosko, E. Z. (2019) · Science · doi:10.1126/science.aaw1219 · Cited by 2,424
Spatiotemporal transcriptomic atlas of mouse organogenesis using DNA nanoball-patterned arrays
Chen, A., Liao, S., Cheng, M., Ma, K., Wu, L., Lai, Y., Qiu, X., Yang, J., Xu, J., Hao, S., et al. (2022) · Cell · doi:10.1016/j.cell.2022.04.003 · Cited by 1,784
Self-citationHighly sensitive spatial transcriptomics at near-cellular resolution with Slide-seqV2
Stickels, R. R., Murray, E., Kumar, P., Li, J., Marshall, J. L., Di Bella, D. J., Arlotta, P., Macosko, E. Z., & Chen, F. (2021) · Nature Biotechnology · doi:10.1038/s41587-020-0739-1 · Cited by 1,295
High-definition spatial transcriptomics for in situ tissue profiling
Vickovic, S., Eraslan, G., Salmén, F., Klughammer, J., Stenbeck, L., Schapiro, D., Äijö, T., Bonneau, R., Bergenstråhle, L., Navarro, J. F., et al. (2019) · Nature Methods · doi:10.1038/s41592-019-0548-y · Cited by 1,150
Method of the Year: spatially resolved transcriptomics
Marx, V. (2021) · Nature Methods · doi:10.1038/s41592-020-01033-y · Cited by 1,132
Cited by
Minimal residual disease as a target for liquid biopsy in patients with solid tumours
Pantel, K., & Alix-Panabières, C. (2025) · Nature Reviews Clinical Oncology · doi:10.1038/s41571-024-00967-y · Cited by 146
Tumour and microenvironment crosstalk in NSCLC progression and response to therapy
Rahal, Z., Darzi, R. E., Moghaddam, S. J., Cascone, T., & Kadara, H. N. (2025) · Nature Reviews Clinical Oncology · doi:10.1038/s41571-025-01021-1 · Cited by 118
Lim, H. J., Wang, Y., Buzdin, A. A., & Li, X. (2025) · BMC Genomics · doi:10.1186/s12864-025-11235-3 · Cited by 103
Ren, P., Zhang, R., Wang, Y., Zhang, P., Luo, C., Wang, S., Li, X., Zhang, Z., Zhao, Y., He, Y., et al. (2025) · Nature Communications · doi:10.1038/s41467-025-64292-3 · Cited by 129
Self-citationStereo-seq V2: Spatial mapping of total RNA on FFPE sections with high resolution
Zhao, Y., Li, Y., He, Y., Wu, J., Liu, Y., Li, X., Li, Z., Yuan, Q., Li, J., Zhang, X., et al. (2025) · Cell · doi:10.1016/j.cell.2025.08.008 · Cited by 84
Self-citation
Metadata
- Authors
- You, Y., Fu, Y., Li, L., Zhang, Z., Jia, S., Lu, S., Ren, W., Liu, Y., Xu, Y., Liu, X., Jiang, F., Peng, G., Sampath Kumar, A., Ritchie, M. E., Liu, X., & Tian, L.
- Affiliations
- Guangzhou Laboratory (CN)
- Westlake University (CN)
- The University of Melbourne (AU)
- Chinese Academy of Sciences (CN)
- Corresponding author
- Liu, Xiaodong
- Tian, Luyi
- ORCID
- Venue
- Nature Methods
- Published
- 2024-07-04
- Volume
- 21
- Issue
- 9
- Pages
- 1743-1754
- ISSN
- 1548-7091 (ISSN-L)
- 1548-7105
- PMC
- PMC11399101
- OpenAlex
- W4400324827
- Cited by
- 220
- References
- 46
- Citations by year
- 2026: 102 · 2025: 96 · 2024: 22
- FWCI
- 29.86
- Type
- journal article
- Language
- en
- Open access
- hybrid
- doi.org
- Licence
- cc-by
- creativecommons.org/licenses/by/4.0 (tdm)
- creativecommons.org/licenses/by/4.0 (vor)
- Locations
- Nature Methods (publishedVersion, cc-by)
- bioRxiv (Cold Spring Harbor Laboratory) (acceptedVersion, cc-by-nc-nd)
- PubMed Central (publishedVersion, cc-by)
- PubMed (publishedVersion)
- Minerva Access (University of Melbourne) (submittedVersion, cc-by)
- Funders
- National Natural Science Foundation of China (22DAA01467, 32370784)
- Topics
- Life Sciences › Biochemistry, Genetics and Molecular Biology › Molecular Biology › Single-cell and spatial transcriptomics
- Life Sciences › Biochemistry, Genetics and Molecular Biology › Molecular Biology › Gene expression and cancer classification
- Life Sciences › Biochemistry, Genetics and Molecular Biology › Molecular Biology › Genomics and Phylogenetic Studies
- Keywords
- spatial transcriptomics, benchmarking, platform comparison, molecular diffusion, spatial resolution, reference tissue, evaluation metrics, sequencing depth, platform selection
- MeSH terms
- Animals, Humans, Sequence Analysis, RNA, Computational Biology, Gene Expression Profiling, Mice, Single-Cell Analysis, High-Throughput Nucleotide Sequencing, Transcriptome
About these checks
Registry, retraction, Cites and statistics results are computed, not judged, with one exception: a printed reference that no index lists is read once by a model before it counts as a citation error. Claims are extracted by a model and kept only when their quote appears verbatim in the text; each cited source is then checked, with a model’s help, for whether it says what the claim relies on. Those verdicts can be wrong — read the claim’s quote and the cited source before relying on one.
Statistics and arithmetic are recomputed, not judged.
Confidence bands are shown only for fields calibrated on our annotated test set. None is calibrated yet, so no band is shown.
What counts as a claim ›How we measure confidence ›How we check this ›
Are you an author, or do you see a problem with this page? Request a review
How to cite
Cite CoChat for the checks on this page, and the paper for its own findings.
- This page
- CoChat. (2026). Citation check: Systematic comparison of sequencing-based spatial transcriptomic methods. https://app.cochat.ai/papers/10.1038/s41592-024-02325-3
- The paper
- You, Y., Fu, Y., Li, L., Zhang, Z., Jia, S., Lu, S., Ren, W., Liu, Y., Xu, Y., Liu, X., Jiang, F., Peng, G., Sampath Kumar, A., Ritchie, M. E., Liu, X., & Tian, L. (2024). Systematic comparison of sequencing-based spatial transcriptomic methods. Nature Methods. https://doi.org/10.1038/s41592-024-02325-3
Data sources
Bibliographic data: Semantic Scholar, OpenAlex, Crossref.
Contains information from the Semantic Scholar Academic Graph Datasets, made available under the ODC Attribution License (ODC-BY 1.0).
Semantic Scholar’s data is described in: Kinney, R., et al. (2023). The Semantic Scholar Open Data Platform. arXiv:2301.10140.
