

The DOI matches its Crossref record; 21 of the 22 references it cites were found in a registry or an index.
Bilateral international migration flow estimates for 200 countries
Open accessAbstract
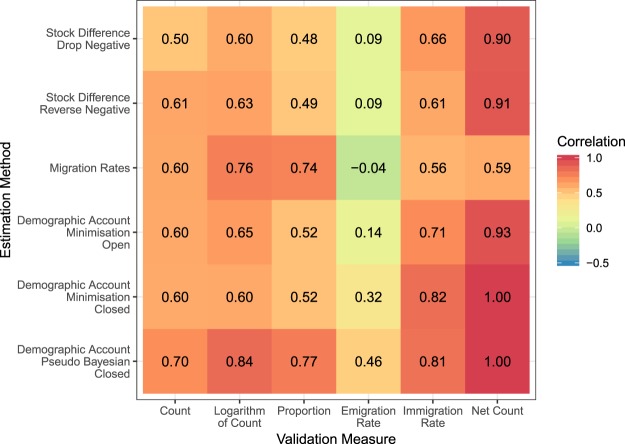
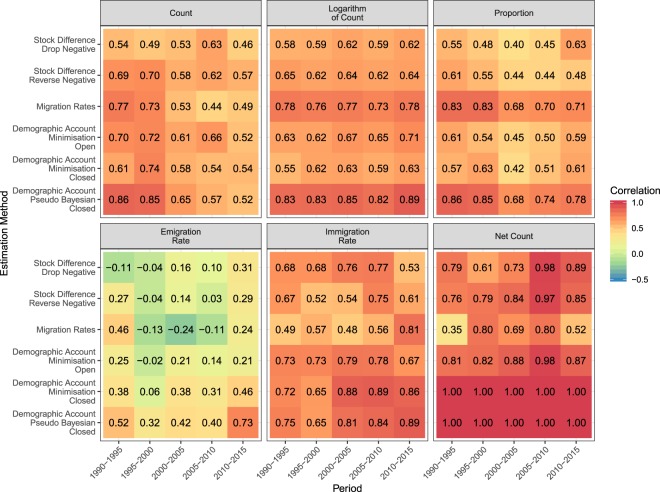
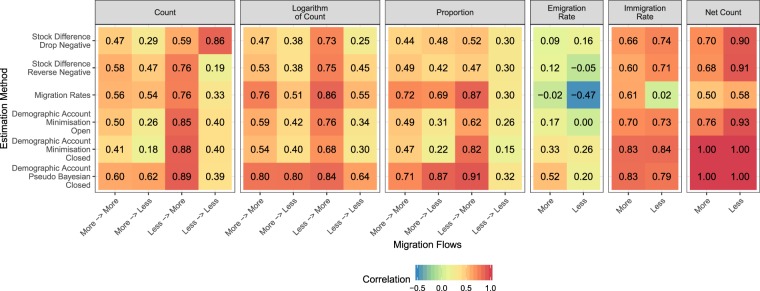
Data on stocks and flows of international migration are necessary to understand migrant patterns and trends and to monitor and evaluate migration-relevant international development agendas. Many countries do not publish data on bilateral migration flows. At least six methods have been proposed recently to estimate bilateral migration flows between all origin-destination country pairs based on migrant stock data published by the World Bank and United Nations. We apply each of these methods to the latest available stock data to provide six estimates of five-year bilateral migration flows between 1990 and 2015. To assess the resulting estimates, we correlate estimates of six migration measures from each method with equivalent reported data where possible. Such systematic efforts at validation have largely been neglected thus far. We show that the correlation between the reported data and the estimates varies widely among different migration measures, over space, and over time. We find that the two methods using a closed demographic accounting approach perform consistently better than the four other estimation approaches.
Overview
The claims and statistics of this paper haven’t been checked yet.
Run the check — free, no account needed. It reads the open-access text and checks the sources it cites.
Integrity signals
Registry
Cites
Statistics
Figures
Verification
Claims the paper makes
The claims and statistics of this paper haven’t been checked yet.
Run the check — free, no account needed. It reads the open-access text and checks the sources it cites.
Claims other papers make about this one
Each is checked against this paper’s own text: does it say what the citing paper says it does?
The source backs part of the claim, not all of it — or backs it for a different population, condition or comparison.
In the citing paper
“As a robustness check (see online Appendix: Supplemental Materials), we also produce estimates based on the “demographic account minimization closed” approach by Abel–Cohen. The latter approach provides the highest correlation with immigration rates in their validation exercise (0.84), but a substantially lower correlation with outmigration rates (0.30).”
From Demography: Fast and Slow (2022) · cites this paper as Abel and Cohen 2019
Experimental — accuracy not yet measuredThe source backs part of the claim, not all of it — or backs it for a different population, condition or comparison.
In the citing paper
“For our main results, we select Abel–Cohen estimates based on the “demographic account pseudo Bayesian closed” method, which provides the largest correlation coefficient with “ground truth” validation sets for outmigration rates (0.44), and the second‐largest correlation coefficient for immigration rates (0.82).”
From Demography: Fast and Slow (2022) · cites this paper as Abel and Cohen 2019
Experimental — accuracy not yet measuredThe cited source says what the claim attributes to it.
In the citing paper
“At the global level, thanks to new bilateral migration flow estimates provided by Abel and Cohen (2019), combined with UN birth and death rate estimates, it is possible to estimate national‐level turnover rates.”
From Demography: Fast and Slow (2022) · cites this paper as Abel and Cohen 2019
The cited source says what the claim attributes to it.
In the citing paper
“A major challenge in estimating country‐level PTRs is related to data quality and availability: while birth and death rates are widely available over time and space, reliably estimating data on immigration and emigration flows at the country level is difficult (Abel and Cohen 2019; Abel and Sander 2014).”
From Demography: Fast and Slow (2022) · cites this paper as Abel and Cohen 2019
Self-check
Percentages, sums and reported differences re-computed from the paper’s own numbers.
The self-check needs the paper’s full text.
Citations
Cites
World Population Prospects The 2006 Revision
Zlotnik, H. (2007) · United Nations eBooks · Cited by 7,896
circlize implements and enhances circular visualization in R
Gu, Z., Gu, L., Eils, R., Schlesner, M., & Brors, B. (2014) · Bioinformatics · doi:10.1093/bioinformatics/btu393 · Cited by 4,290
Quantifying Global International Migration Flows
Abel, G. J., & Sander, N. (2014) · Science · doi:10.1126/science.1248676 · Cited by 565
Self-citationBeine, M. A. R., Docquier, F., & Özden, Ç. (2009) · Journal of Development Economics · doi:10.1016/j.jdeveco.2009.11.004 · Cited by 467
Climatic factors as determinants of international migration
Beine, M., & Parsons, C. (2015) · The Scandinavian Journal of Economics · doi:10.1111/sjoe.12098 · Cited by 447
The outlook for population growth
Lee, R. (2011) · Science · doi:10.1126/science.1208859 · Cited by 415
An Iterative Procedure for Estimation in Contingency Tables
Fienberg, S. E. (1970) · The Annals of Mathematical Statistics · doi:10.1214/aoms/1177696968 · Cited by 363
Estimation of emigration, return migration, and transit migration between all pairs of countries
Azose, J. J., & Raftery, A. E. (2018) · Proceedings of the National Academy of Sciences · doi:10.1073/pnas.1722334116 · Cited by 172
International migration under the microscope
Willekens, F., Massey, D. S., Raymer, J., & Beauchemin, C. (2016) · Science · doi:10.1126/science.aaf6545 · Cited by 143
Impact of migration on economic and social development: A review of evidence and emerging issues
Mohapatra, S., Ratha, D., & Scheja, E. (2011) · doi:10.1596/1813-9450-5558 · Cited by 134
Integrated Modeling of European Migration
Raymer, J., Wiśniowski, A., Forster, J. J., Smith, P. W. F., & Bijak, J. (2013) · Journal of the American Statistical Association · doi:10.1080/01621459.2013.789435 · Cited by 133
The size of the cliff at the border
Bertoli, S., & Moraga, J. F. (2014) · Regional Science and Urban Economics · doi:10.1016/j.regsciurbeco.2014.12.002 · Cited by 123
Estimating global migration flow tables using place of birth data
Abel, G. (2013) · Demographic Research · doi:10.4054/demres.2013.28.18 · Cited by 107
Self-citationEstimates of Global Bilateral Migration Flows by Gender between 1960 and 20151
Abel, G. (2017) · International Migration Review · doi:10.1111/imre.12327 · Cited by 84
Self-citationGrowing Restrictiveness or Changing Selection? The Nature and Evolution of Migration Policies1
de Haas, H., Natter, K., & Vezzoli, S. (2018) · International Migration Review · doi:10.1177/0197918318781584 · Cited by 60
Multistate Demographic Accounts: Measurement and Estimation Procedures
Rees, P. (1980) · Environment and Planning A Economy and Space · doi:10.1068/a120499 · Cited by 14
migest: Tools for Estimating, Measuring and Working with Migration Data
Abel, G. (2012) · doi:10.32614/cran.package.migest · Cited by 8
Self-citation(2015) · Oxford University Press eBooks · doi:10.1093/acprof:oso/9780198729624.001.0001 · Cited by 5
(2018) · Global education monitoring report ... · doi:10.18356/e6d9231b-en · Cited by 3
Bilateral international migration flow estimates for 200 countries
Abel, G., & Cohen, J. E. (2019) · IIASA PURE (International Institute of Applied Systems Analysis) · doi:10.6084/m9.figshare.c.4470464 · Cited by 2
Self-citation
Cited by
Sorted by citations
Forecasting: theory and practice
Petropoulos, F., Apiletti, D., Assimakopoulos, V., Babaï, M. Z., Barrow, D. K., Taieb, S. B., Bergmeir, C., Bessa, R. J., Bijak, J., Boylan, J. E., et al. (2022) · International Journal of Forecasting · doi:10.1016/j.ijforecast.2021.11.001 · Cited by 1,187
Climate change increases resource-constrained international immobility
Benveniste, H., Oppenheimer, M., & Fleurbaey, M. (2022) · Nature Climate Change · doi:10.1038/s41558-022-01401-w · Cited by 115
World’s human migration patterns in 2000–2019 unveiled by high-resolution data
Niva, V., Horton, A., Virkki, V., Heino, M., Kosonen, M., Kallio, M., Kinnunen, P., Abel, G., Muttarak, R., Taka, M., et al. (2023) · Nature Human Behaviour · doi:10.1038/s41562-023-01689-4 · Cited by 87
Self-citationProbabilistic population forecasting: Short to very long-term
Raftery, A. E., & Ševčíková, H. (2021) · International Journal of Forecasting · doi:10.1016/j.ijforecast.2021.09.001 · Cited by 95
Migration and sustainable development
Adger, W. N., Fransen, S., de Campos, R. S., & Clark, W. C. (2024) · Proceedings of the National Academy of Sciences · doi:10.1073/pnas.2206193121 · Cited by 65
Metadata
- Authors
- Abel, G. J., & Cohen, J. E.
- Affiliations
- Shanghai University (CN)
- University of Chicago (US)
- Corresponding author
- Abel, Guy J.
- Venue
- Scientific Data
- Published
- 2019-06-17
- Volume
- 6
- Issue
- 1
- Pages
- 82-82
- ISSN
- 2052-4463 (ISSN-L)
- PMC
- PMC6572777
- OpenAlex
- W2951293227
- Cited by
- 129
- References
- 22
- Citations by year
- 2026: 14 · 2025: 20 · 2024: 25 · 2023: 17 · 2022: 23 · 2021: 18 · 2020: 10 · 2019: 2
- Type
- data paper
- Language
- en
- Open access
- gold
- doi.org
- Locations
- Scientific Data (publishedVersion, cc-by)
- Europe PMC (PubMed Central) (publishedVersion, cc-by)
- PubMed Central (publishedVersion, cc-by)
- PubMed (publishedVersion)
- IIASA PURE (International Institute of Applied Systems Analysis) (acceptedVersion)
- ePubWU Institutional Repository (Wirtschaftsuniversität Wien) (submittedVersion, cc-by)
- DOAJ (DOAJ: Directory of Open Access Journals) (submittedVersion)
- Funders
- China National Funds for Distinguished Young Scientists (41650110483)
- National Science Foundation (DMS-1225529)
- Topics
- Social Sciences › Sociology and Political Science › Migration and Labor Dynamics
- Social Sciences › Sociology and Political Science › Migration, Refugees, and Integration
- Social Sciences › Demography › Migration, Health, Geopolitics, Historical Geography
- Keywords
- bilateral migration flows, international migration, origin-destination pairs, migration and development
- MeSH terms
- Data Analysis, Humans, Emigrants and Immigrants, Human Migration
About these checks
Registry, retraction, Cites and statistics results are computed, not judged, with one exception: a printed reference that no index lists is read once by a model before it counts as a citation error. Claims are extracted by a model and kept only when their quote appears verbatim in the text; each cited source is then checked, with a model’s help, for whether it says what the claim relies on. Those verdicts can be wrong — read the claim’s quote and the cited source before relying on one.
Statistics and arithmetic are recomputed, not judged.
Confidence bands are shown only for fields calibrated on our annotated test set. None is calibrated yet, so no band is shown.
What counts as a claim ›How we measure confidence ›How we check this ›
Are you an author, or do you see a problem with this page? Request a review
