Cited by 181Immunotherapy and Immune Responses3D Printing in Biomedical ResearchMicrofluidic and Capillary Electrophoresis Applications

The DOI matches its Crossref record; 64 of the 64 references it cites were found in a registry or an index.

3D Microfluidic model for evaluating immunotherapy efficacy by tracking dendritic cell behaviour toward tumor cells

Open access

Abstract

Immunotherapy efficacy relies on the crosstalk within the tumor microenvironment between cancer and dendritic cells (DCs) resulting in the induction of a potent and effective antitumor response. DCs have the specific role of recognizing cancer cells, taking up tumor antigens (Ags) and then migrating to lymph nodes for Ag (cross)-presentation to naïve T cells. Interferon-α-conditioned DCs (IFN-DCs) exhibit marked phagocytic activity and the special ability of inducing Ag-specific T-cell response. Here, we have developed a novel microfluidic platform recreating tightly interconnected cancer and immune systems with specific 3D environmental properties, for tracking human DC behaviour toward tumor cells. By combining our microfluidic platform with advanced microscopy and a revised cell tracking analysis algorithm, it was possible to evaluate the guided efficient motion of IFN-DCs toward drug-treated cancer cells and the succeeding phagocytosis events. Overall, this platform allowed the dissection of IFN-DC-cancer cell interactions within 3D tumor spaces, with the discovery of major underlying factors such as CXCR4 involvement and underscored its potential as an innovative tool to assess the efficacy of immunotherapeutic approaches.

Overview

The claims and statistics of this paper haven’t been checked yet.

Run the check — free, no account needed. It reads the open-access text and checks the sources it cites.

A few free checks a day · papers already verified open instantly · results are public

Integrity signals

Registry

Crossref · 10.1038/s41598-017-01013-x

Cites

64 of 64 references verified0 citation errors · 0 not checkable

Statistics

Figures

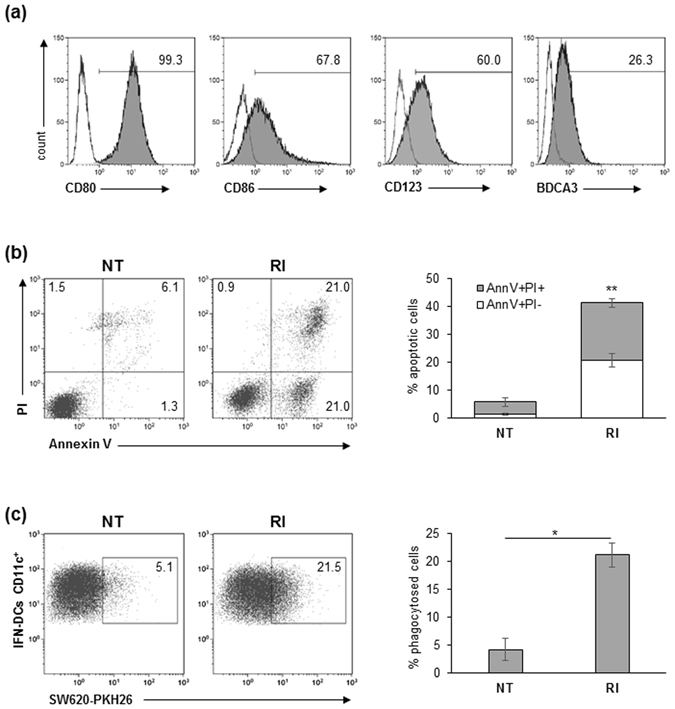
Figure 1 IFN-DCs efficiently phagocytose RI-treated SW620 cells. (a) Human monocyte-derived DCs generated in the presence of both IFN-α2b and GM-CSF were analysed by flow cytometry for the expression of maturation and differentiation markers. Percentages of positive cells (filled histograms) are shown; empty histograms represent isotype controls. Data are representative of three independent experiments. (b) Analysis of apoptosis of SW620 cells induced by 48 h-treatment with the combination of romidepsin and IFN-α2b (RI), as compared to untreated (NT) cancer cells. In the flow plots, early apoptotic cells (Annexin V+/PI−), late apoptotic cells (Annexin V+/PI+), necrotic cells (Annexin V−/PI+) and vital cells (Annexin V−/PI−) can be distinguished. One representative experiment out of four independent experiments is shown (left panel). In the right panel, percentages ± s.d. of AnnV+/PI− and AnnV+/PI+ cells are shown (N = 4). (c) Flow cytometry analysis of phagocytosis of NT or RI-treated PKH26-labeled SW620 cells by IFN-DCs after a 4 h co-culture. IFN-DCs were stained with anti-CD11c mAb. One representative experiment (left panel) and the mean percentage ± s.d. of phagocytosed cells (right panel) are shown (N = 3).
Figure 1 IFN-DCs efficiently phagocytose RI-treated SW620 cells. (a) Human monocyte-derived DCs generated in the presence of both IFN-α2b and GM-CSF were analysed by flow cytometry for the expression of maturation and differentiation markers. Percentages of positive cells (filled histograms) are shown; empty histograms represent isotype controls. Data are representative of three independent experiments. (b) Analysis of apoptosis of SW620 cells induced by 48 h-treatment with the combination of romidepsin and IFN-α2b (RI), as compared to untreated (NT) cancer cells. In the flow plots, early apoptotic cells (Annexin V+/PI−), late apoptotic cells (Annexin V+/PI+), necrotic cells (Annexin V−/PI+) and vital cells (Annexin V−/PI−) can be distinguished. One representative experiment out of four independent experiments is shown (left panel). In the right panel, percentages ± s.d. of AnnV+/PI− and AnnV+/PI+ cells are shown (N = 4). (c) Flow cytometry analysis of phagocytosis of NT or RI-treated PKH26-labeled SW620 cells by IFN-DCs after a 4 h co-culture. IFN-DCs were stained with anti-CD11c mAb. One representative experiment (left panel) and the mean percentage ± s.d. of phagocytosed cells (right panel) are shown (N = 3).CC BY · PubMed Central
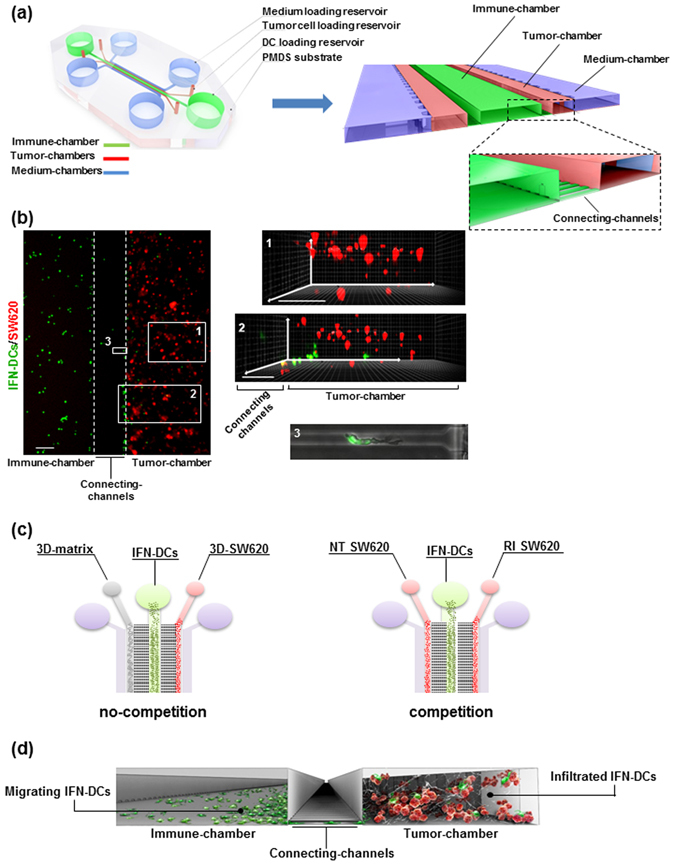
Figure 2 Design of the microfluidic device reconstructing the 3D immune-cancer spaces to track DC-cancer cells dialogue. (a) Schematic model of the 3D microfluidic device used for real time monitoring of DC migration toward cancer cells and their interactions. The device is composed of a 1.2 mm-wide central immune-chamber, with rounded loading reservoirs at both ends for DC loading, connected through a network of narrow microgrooves (connecting-channels) (10 × 12 × 200 µm, H × W × L) to two side tumor-chambers (150 × 500 × 1000 µm) end-closed with rounded loading reservoirs and designed to recreate 3D tumor spaces. Two external medium chambers ensure the optimal gas and nutrient exchange to the cell cultures. An enlarged 3D section of the device is shown. The boxed area represents a magnification of the connecting-channels. (b) Fluorescence image of the immune-tumor area of the device analysed in microfluidic experiments (left panel) showing the immune-chamber filled with PKH67 green-stained DCs, the connecting-channels and the tumor-chamber loaded with type I collagen embedded-PKH26 red-stained cancer cells. Images were acquired with an inverted Olympus IX73 microscope using a Plan Achromat 4×/0.10NA objective and processed with ImageJ software. Scale bar 100 μm. The inset photographs of the 3D projections represent: (1) a 3D rendering of a confocal image of SW620 cancer cells in the reconstructed 3D-matrix tumor space. Scale bar, 100 μm; (2) a 3D rendering of a confocal image of the connecting-channels entering the 3D-matrix tumor space showing IFN-DCs moving toward cancer cells; scale bar, 100 μm. Image stacks (100 images of 1 μm Z-step size) were acquired using a spinning disk microscope with a 20×/0.45NA objective and processed with Imaris software; (3) brightfield and green fluorescence merged image (20×) of a representative connecting-channel crossed by one IFN-DC actively moving toward the 3D-matrix tumor space. The image was processed with ImageJ software. (c) Schematic representation of isometric views of microfluidic devices showing the two experimental configurations used: no-competition and competition settings. (d) A 3D graphic representation of a section of the microfluidic device showing the interconnection between immune and tumor spaces and reproducing the motion of migrating DCs from the immune-chamber, crossing connecting-channels, toward the tumor-chamber, where cancer cells are targeted by infiltrated DCs.
Figure 2 Design of the microfluidic device reconstructing the 3D immune-cancer spaces to track DC-cancer cells dialogue. (a) Schematic model of the 3D microfluidic device used for real time monitoring of DC migration toward cancer cells and their interactions. The device is composed of a 1.2 mm-wide central immune-chamber, with rounded loading reservoirs at both ends for DC loading, connected through a network of narrow microgrooves (connecting-channels) (10 × 12 × 200 µm, H × W × L) to two side tumor-chambers (150 × 500 × 1000 µm) end-closed with rounded loading reservoirs and designed to recreate 3D tumor spaces. Two external medium chambers ensure the optimal gas and nutrient exchange to the cell cultures. An enlarged 3D section of the device is shown. The boxed area represents a magnification of the connecting-channels. (b) Fluorescence image of the immune-tumor area of the device analysed in microfluidic experiments (left panel) showing the immune-chamber filled with PKH67 green-stained DCs, the connecting-channels and the tumor-chamber loaded with type I collagen embedded-PKH26 red-stained cancer cells. Images were acquired with an inverted Olympus IX73 microscope using a Plan Achromat 4×/0.10NA objective and processed with ImageJ software. Scale bar 100 μm. The inset photographs of the 3D projections represent: (1) a 3D rendering of a confocal image of SW620 cancer cells in the reconstructed 3D-matrix tumor space. Scale bar, 100 μm; (2) a 3D rendering of a confocal image of the connecting-channels entering the 3D-matrix tumor space showing IFN-DCs moving toward cancer cells; scale bar, 100 μm. Image stacks (100 images of 1 μm Z-step size) were acquired using a spinning disk microscope with a 20×/0.45NA objective and processed with Imaris software; (3) brightfield and green fluorescence merged image (20×) of a representative connecting-channel crossed by one IFN-DC actively moving toward the 3D-matrix tumor space. The image was processed with ImageJ software. (c) Schematic representation of isometric views of microfluidic devices showing the two experimental configurations used: no-competition and competition settings. (d) A 3D graphic representation of a section of the microfluidic device showing the interconnection between immune and tumor spaces and reproducing the motion of migrating DCs from the immune-chamber, crossing connecting-channels, toward the tumor-chamber, where cancer cells are targeted by infiltrated DCs.CC BY · PubMed Central
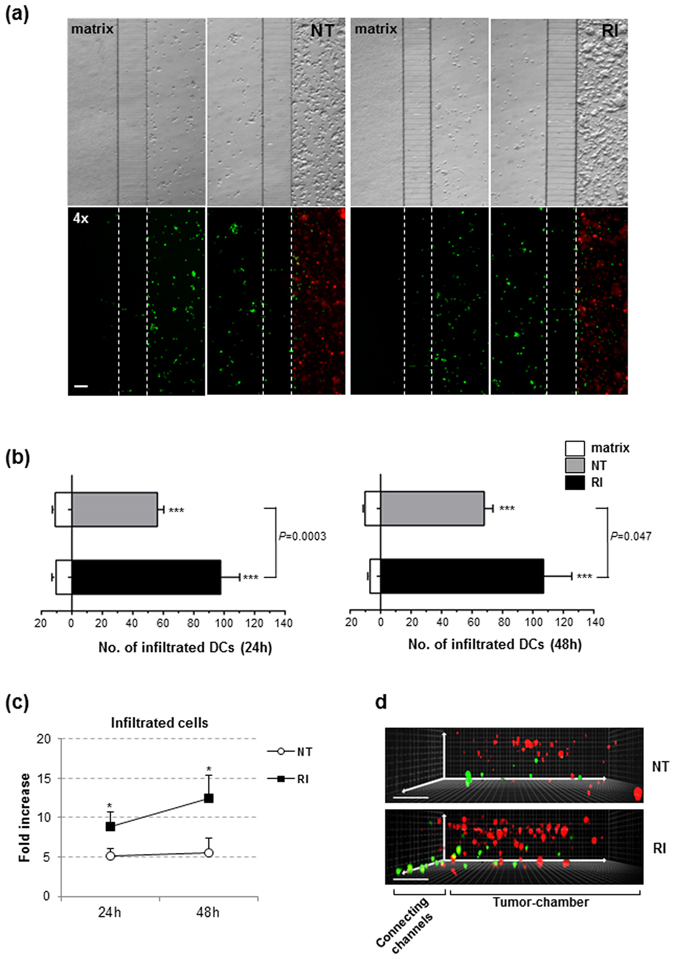
Figure 3 IFN-DCs migrate toward 3D tumor spaces. (a) Wide-field images of immune-tumor areas of microfluidic devices analysed in no-competition experiments. Brightfield images (top panels) and fluorescence images (bottom panels) show the preferential migration of IFN-DCs toward NT SW620 and RI SW620 spaces rather than an empty matrix. Images were acquired at 48 h from the start of migration using a Plan Achromat 4×/0.10NA objective and processed with ImageJ software. Scale bar, 100 μm. One out of three independent experiments is shown. (b) Distribution of infiltrated IFN-DCs into NT and RI spaces versus matrix, at 24 and 48 h. Means ± s.e.m. are shown. (N = 3 experiments; n = 6 and 5 for NT, 7 and 5 for RI, at 24 and 48 h, respectively. n = no. of fluorescence images analysed in each experiment). ***P ≤ 0.001, IFN-DCs migrating toward tumor chambers versus matrix. P = 0.5 and P = 0.047, infiltrated IFN-DCs into RI SW620 versus NT SW620 at 24 and 48 h, respectively (Student’s t-test). (c) Fold increase of infiltrating IFN-DCs into RI SW620 and NT SW620 spaces, with respect to the matrix. Means ± s.e.m. are shown (*P ≤ 0.05, Student’s t-test). (d) A 3D reconstruction of confocal image stacks (100 images of 1 μm Z-step size) of connecting-channels and tumor-chambers acquired using a 20×/0.45NA objective. PKH67 green-stained IFN-DCs actively migrate in the three spatial directions into the NT (upper panel) and RI (lower panel) spaces with an increased distribution into the 3D tumor space containing drug-treated PKH26 red-stained cancer cells. One representative image, for each image stack analysed, is shown. Three independent acquisitions were performed.
Figure 3 IFN-DCs migrate toward 3D tumor spaces. (a) Wide-field images of immune-tumor areas of microfluidic devices analysed in no-competition experiments. Brightfield images (top panels) and fluorescence images (bottom panels) show the preferential migration of IFN-DCs toward NT SW620 and RI SW620 spaces rather than an empty matrix. Images were acquired at 48 h from the start of migration using a Plan Achromat 4×/0.10NA objective and processed with ImageJ software. Scale bar, 100 μm. One out of three independent experiments is shown. (b) Distribution of infiltrated IFN-DCs into NT and RI spaces versus matrix, at 24 and 48 h. Means ± s.e.m. are shown. (N = 3 experiments; n = 6 and 5 for NT, 7 and 5 for RI, at 24 and 48 h, respectively. n = no. of fluorescence images analysed in each experiment). ***P ≤ 0.001, IFN-DCs migrating toward tumor chambers versus matrix. P = 0.5 and P = 0.047, infiltrated IFN-DCs into RI SW620 versus NT SW620 at 24 and 48 h, respectively (Student’s t-test). (c) Fold increase of infiltrating IFN-DCs into RI SW620 and NT SW620 spaces, with respect to the matrix. Means ± s.e.m. are shown (*P ≤ 0.05, Student’s t-test). (d) A 3D reconstruction of confocal image stacks (100 images of 1 μm Z-step size) of connecting-channels and tumor-chambers acquired using a 20×/0.45NA objective. PKH67 green-stained IFN-DCs actively migrate in the three spatial directions into the NT (upper panel) and RI (lower panel) spaces with an increased distribution into the 3D tumor space containing drug-treated PKH26 red-stained cancer cells. One representative image, for each image stack analysed, is shown. Three independent acquisitions were performed.CC BY · PubMed Central
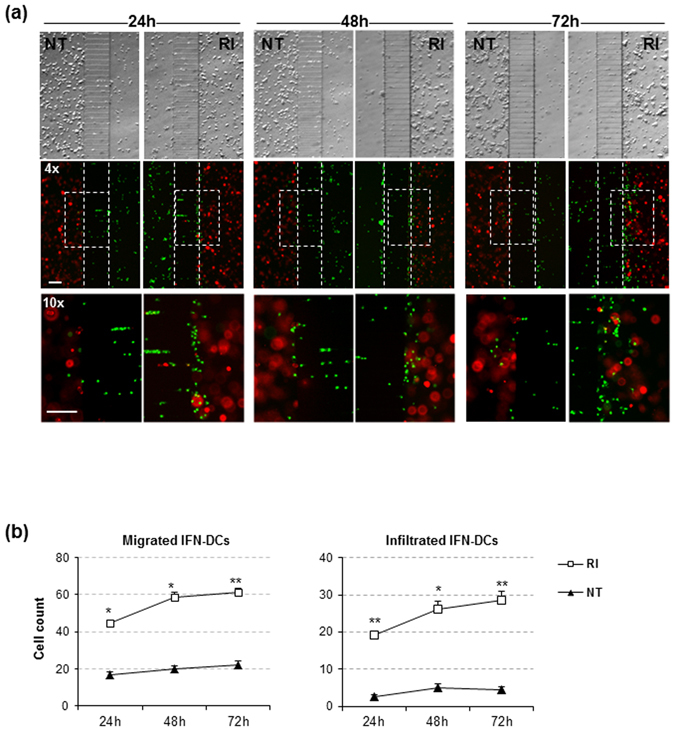
Figure 4 IFN-DCs preferentially migrate toward RI-treated SW620 cells. (a) Images of immune-tumor areas of the microfluidic devices analysed in competition experiments. Brightfield images (top panels) and fluorescence images (middle panels) acquired using a Plan Achromat 4×/0.10NA objective show the preferential migration of PKH67 green-stained IFN-DCs toward RI versus NT spaces containing PKH26 red-stained cancer cells at 24, 48 and 72 h observation time points (Scale bar, 100 μm). Bottom panels represent the magnification of boxed areas in the middle panels, acquired by 10×/0.25NA objective (Scale bar, 100 μm). One representative experiment out of three is shown. (b) Kinetics of migrating IFN-DCs, represented by cells counted in the analysed connecting-channel and tumor-chamber areas, and infiltrating IFN-DCs, represented by cells counted in the analysed tumor-chamber area, showing the massive recruitment of these cells by drug-treated SW620 cells. Images acquired with 10× magnification were quantified. Means ± s.e.m. are shown (*P ≤ 0.05, **≤0.01, Student’s t-test) (N = 3 experiments; n = 32, 30 and 34 for NT; n = 29, 26 and 29 for RI, at 24, 48 and 72 h, respectively. n = no. of fluorescent images analysed).
Figure 4 IFN-DCs preferentially migrate toward RI-treated SW620 cells. (a) Images of immune-tumor areas of the microfluidic devices analysed in competition experiments. Brightfield images (top panels) and fluorescence images (middle panels) acquired using a Plan Achromat 4×/0.10NA objective show the preferential migration of PKH67 green-stained IFN-DCs toward RI versus NT spaces containing PKH26 red-stained cancer cells at 24, 48 and 72 h observation time points (Scale bar, 100 μm). Bottom panels represent the magnification of boxed areas in the middle panels, acquired by 10×/0.25NA objective (Scale bar, 100 μm). One representative experiment out of three is shown. (b) Kinetics of migrating IFN-DCs, represented by cells counted in the analysed connecting-channel and tumor-chamber areas, and infiltrating IFN-DCs, represented by cells counted in the analysed tumor-chamber area, showing the massive recruitment of these cells by drug-treated SW620 cells. Images acquired with 10× magnification were quantified. Means ± s.e.m. are shown (*P ≤ 0.05, **≤0.01, Student’s t-test) (N = 3 experiments; n = 32, 30 and 34 for NT; n = 29, 26 and 29 for RI, at 24, 48 and 72 h, respectively. n = no. of fluorescent images analysed).CC BY · PubMed Central
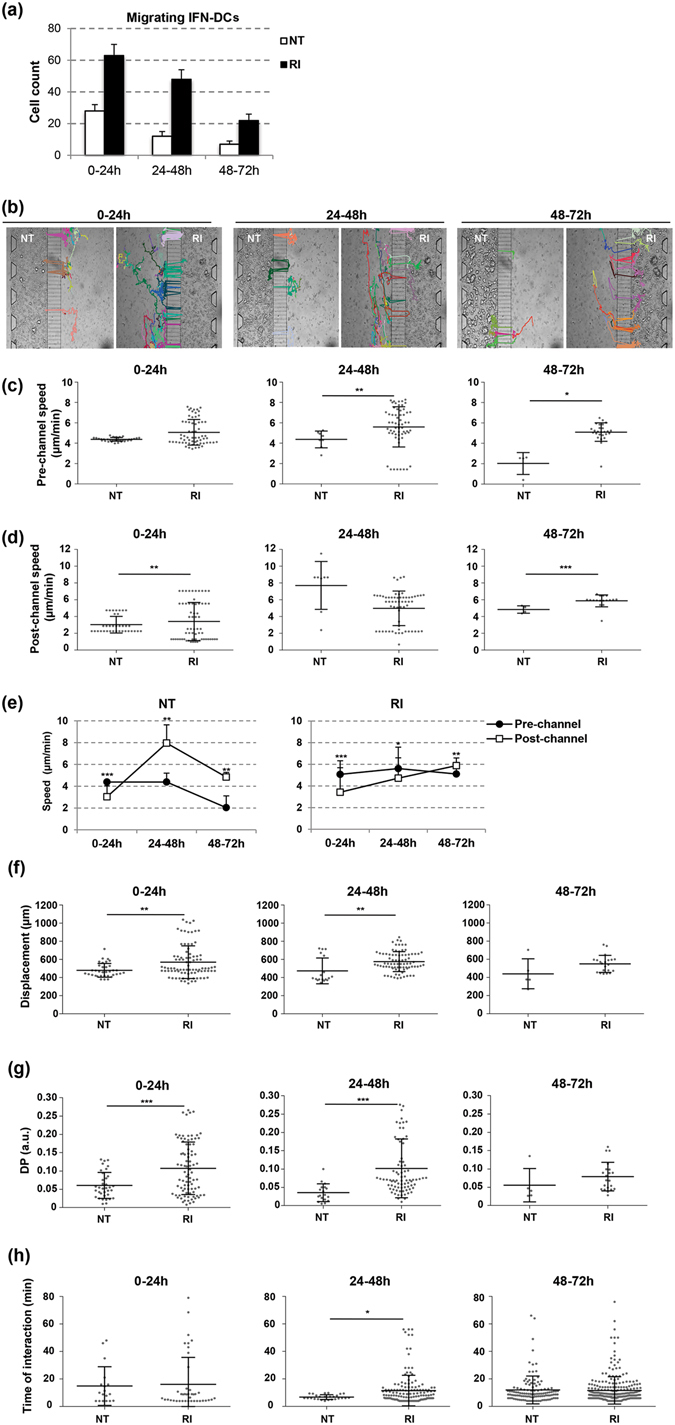
Figure 5 Analysis of IFN-DCs and RI-treated SW620 cells interaction. (a) Quantification of migrating IFN-DCs crossing connecting-channels towards NT or RI-treated SW620 cells by the revised unsupervised algorithm for cell tracking analysis of 0–72 h time-lapse recording. Images were acquired every 2 min by a Juli Smart microscope (4× magnification). Means ± s.d. are shown. Three independent experiments were analysed. (b) Migratory patterns of IFN-DCs toward NT or RI-treated SW620 cells were analysed in 0–72 h time-lapse experiments with cell tracking analysis. Paths of each IFN-DC crossing the connecting-channels from the immune-chamber in the direction of either NT or RI tumor-chambers are shown. Representative photos taken from three independent video recordings are shown. (c,d) Scatter plots of the migratory speed of IFN-DCs in the immune-chamber (pre-channel speed) and in the tumor-chambers (post-channel speed) both toward NT and RI-treated SW620 cells. Each data point represents the average velocity of one cell over the time periods of 0–24, 24–48 or 48–72 h. Horizontal bars indicate mean ± s.d. (e) Pre- and post-channel migratory speed of IFN-DCs toward and into the NT and RI-treated SW620 cell space over 0–72 h period. (f) Total horizontal path displacements of IFN-DCs. Each data point represents the average displacement of one cell over the time periods of 0–24, 24–48 or 48–72 h. Horizontal bars correspond to mean ± s.d. (g) IFN-DC migratory persistence recorded in time-lapse experiments. The DP of IFN-DCs is significantly higher toward RI than NT SW620 cells for up to 48 h. Each data point represents directional persistence of one cell over the time periods of 0–24, 24–48 or 48–72 h. Horizontal bars correspond to mean ± s.d. (h) Time of interaction between one IFN-DC and one SW620 cell calculated into the NT and RI tumor-chambers over the time periods of 0–24, 24–48 or 48–72 h. The value was based on a defined circular region of interaction around each cancer cell (see Supplementary Information for details). Horizontal bars represent mean ± s.d. (*P ≤ 0.05, **≤0.01, ***≤0.001, Student’s t-test).
Figure 5 Analysis of IFN-DCs and RI-treated SW620 cells interaction. (a) Quantification of migrating IFN-DCs crossing connecting-channels towards NT or RI-treated SW620 cells by the revised unsupervised algorithm for cell tracking analysis of 0–72 h time-lapse recording. Images were acquired every 2 min by a Juli Smart microscope (4× magnification). Means ± s.d. are shown. Three independent experiments were analysed. (b) Migratory patterns of IFN-DCs toward NT or RI-treated SW620 cells were analysed in 0–72 h time-lapse experiments with cell tracking analysis. Paths of each IFN-DC crossing the connecting-channels from the immune-chamber in the direction of either NT or RI tumor-chambers are shown. Representative photos taken from three independent video recordings are shown. (c,d) Scatter plots of the migratory speed of IFN-DCs in the immune-chamber (pre-channel speed) and in the tumor-chambers (post-channel speed) both toward NT and RI-treated SW620 cells. Each data point represents the average velocity of one cell over the time periods of 0–24, 24–48 or 48–72 h. Horizontal bars indicate mean ± s.d. (e) Pre- and post-channel migratory speed of IFN-DCs toward and into the NT and RI-treated SW620 cell space over 0–72 h period. (f) Total horizontal path displacements of IFN-DCs. Each data point represents the average displacement of one cell over the time periods of 0–24, 24–48 or 48–72 h. Horizontal bars correspond to mean ± s.d. (g) IFN-DC migratory persistence recorded in time-lapse experiments. The DP of IFN-DCs is significantly higher toward RI than NT SW620 cells for up to 48 h. Each data point represents directional persistence of one cell over the time periods of 0–24, 24–48 or 48–72 h. Horizontal bars correspond to mean ± s.d. (h) Time of interaction between one IFN-DC and one SW620 cell calculated into the NT and RI tumor-chambers over the time periods of 0–24, 24–48 or 48–72 h. The value was based on a defined circular region of interaction around each cancer cell (see Supplementary Information for details). Horizontal bars represent mean ± s.d. (*P ≤ 0.05, **≤0.01, ***≤0.001, Student’s t-test).CC BY · PubMed Central
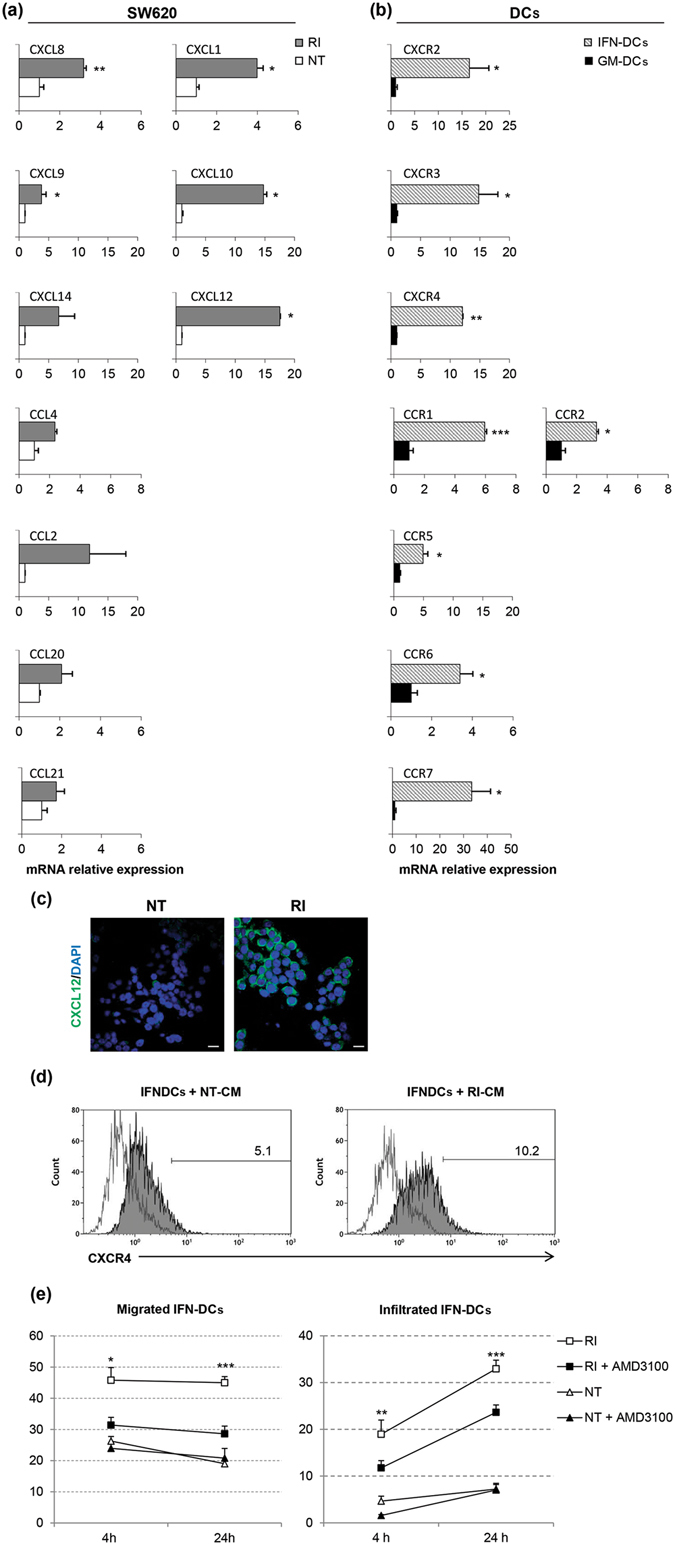
Figure 6 The CXCR4/CXCL12 axis drives the migration of IFN-DCs toward RI-treated SW620 cells. Analysis of the expression of CC-/CXC-chemokines in SW620 cells (a) and of relative chemokine receptors in IFN-DCs (b) by qPCR. Expression values in the RI-treated SW620 cells and in the IFN-DCs are relative to the NT SW620 cells and to the GM-DCs, respectively (means ± s.e.m., *P ≤ 0.05, **≤0.01, ***≤0.001). (c) Immunofluorescence analysis of CXCL12 expression on both NT and RI-treated SW620. Images were collected with the same acquisition parameters. Scale bar, 20 µm. (d) Analysis of CXCR4 expression by flow cytometry on IFN-DCs after exposure to CM from 48 and 72 h NT and RI-treated SW620 cells (N = 3). (e) IFN-DC migration toward RI-treated SW620 cells is significantly inhibited by the CXCR4 inhibitor, AMD3100. Migration in the presence or absence of AMD3100 were performed in microfluidic devices, and the acquired images were quantified at 4 and 24 h (magnification 4×). Means ± s.e.m. are shown (*P ≤ 0.05, **≤0.01, ***≤0.001, Student’s t-test) (N = 3 experiments; a means of 10 images for group were analysed).
Figure 6 The CXCR4/CXCL12 axis drives the migration of IFN-DCs toward RI-treated SW620 cells. Analysis of the expression of CC-/CXC-chemokines in SW620 cells (a) and of relative chemokine receptors in IFN-DCs (b) by qPCR. Expression values in the RI-treated SW620 cells and in the IFN-DCs are relative to the NT SW620 cells and to the GM-DCs, respectively (means ± s.e.m., *P ≤ 0.05, **≤0.01, ***≤0.001). (c) Immunofluorescence analysis of CXCL12 expression on both NT and RI-treated SW620. Images were collected with the same acquisition parameters. Scale bar, 20 µm. (d) Analysis of CXCR4 expression by flow cytometry on IFN-DCs after exposure to CM from 48 and 72 h NT and RI-treated SW620 cells (N = 3). (e) IFN-DC migration toward RI-treated SW620 cells is significantly inhibited by the CXCR4 inhibitor, AMD3100. Migration in the presence or absence of AMD3100 were performed in microfluidic devices, and the acquired images were quantified at 4 and 24 h (magnification 4×). Means ± s.e.m. are shown (*P ≤ 0.05, **≤0.01, ***≤0.001, Student’s t-test) (N = 3 experiments; a means of 10 images for group were analysed).CC BY · PubMed Central
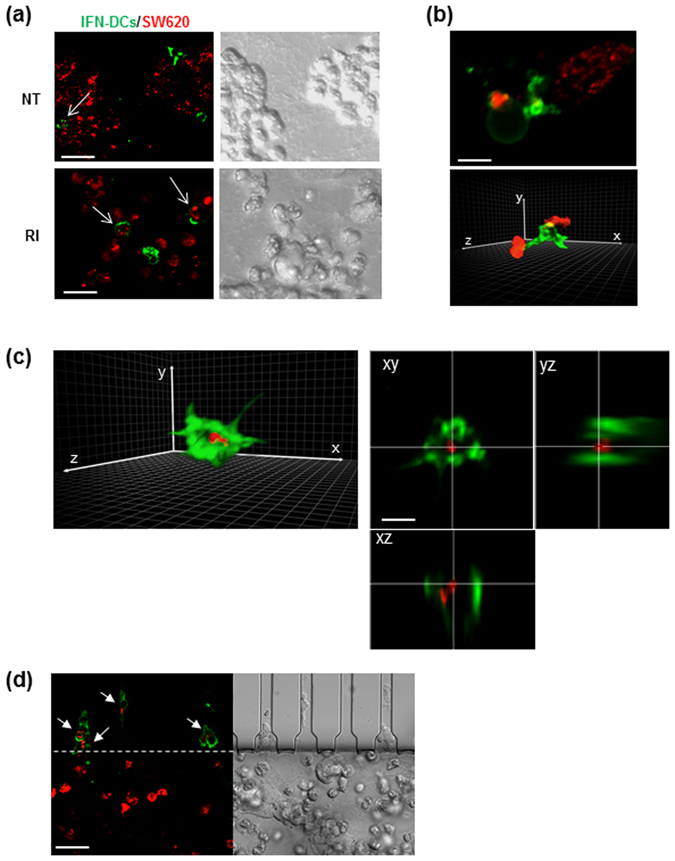
Figure 7 IFN-DCs efficiently phagocytose RI-treated SW620 cells. (a) Fluorescence images (left panels) of HLA-DR-stained IFN-DCs (green) performing phagocytosis of PKH26-stained cancer cells (red) into NT or RI spaces, as evaluated by CLSM after 48 h from the beginning of migration in the microfluidic device under competition experimental conditions. The right panels show DIC (Differential Interference Contrast) images of the same fields. Images acquired using a UPLANSAPO 20×/0.75NA objective are shown. Zoom 3; scale bar, 15 μm. To avoid crosstalk between different fluorophores, sequential acquisition was performed. Data are representative of three independent experiments. (b) A 3D rendering of image stacks (16 slices of 0.5 μm Z-step size) acquired within the RI tumor space. Zoom 6; scale bar, 5 μm. One IFN-DC extending trans-cellular dendrites toward SW620 cells is depicted in green (top panel) and one IFN-DC establishing contact with two different SW620 cells is depicted in green (bottom panel). (c) A 3D rendering of one IFN-DC (green) engulfing one SW620 cell (red) from the image stacks (16 slices of 0.5 μm Z-step size) acquired within the RI tumor space (left panel). Orthogonal sections of the phagocytic event depicted in the right panel are shown (left panels). Scale bar 5 μm. In (b and c), a 3D rendering was edited by Adobe Photoshop CC software preserving the original parameters of image acquisition (d) Fluorescence image showing IFN-DCs (green) crossing connecting-channels facing RI space upon phagocytosis of PKH26-stained SW620 cells (red) as evaluated by CLSM after 48 h from the beginning of migration in the microfluidic device, under competition experimental conditions. The right panel shows a DIC image of the same field. Images are acquired as in (a). Scale bar, 15 μm. Representative images of two independent experiments are shown.
Figure 7 IFN-DCs efficiently phagocytose RI-treated SW620 cells. (a) Fluorescence images (left panels) of HLA-DR-stained IFN-DCs (green) performing phagocytosis of PKH26-stained cancer cells (red) into NT or RI spaces, as evaluated by CLSM after 48 h from the beginning of migration in the microfluidic device under competition experimental conditions. The right panels show DIC (Differential Interference Contrast) images of the same fields. Images acquired using a UPLANSAPO 20×/0.75NA objective are shown. Zoom 3; scale bar, 15 μm. To avoid crosstalk between different fluorophores, sequential acquisition was performed. Data are representative of three independent experiments. (b) A 3D rendering of image stacks (16 slices of 0.5 μm Z-step size) acquired within the RI tumor space. Zoom 6; scale bar, 5 μm. One IFN-DC extending trans-cellular dendrites toward SW620 cells is depicted in green (top panel) and one IFN-DC establishing contact with two different SW620 cells is depicted in green (bottom panel). (c) A 3D rendering of one IFN-DC (green) engulfing one SW620 cell (red) from the image stacks (16 slices of 0.5 μm Z-step size) acquired within the RI tumor space (left panel). Orthogonal sections of the phagocytic event depicted in the right panel are shown (left panels). Scale bar 5 μm. In (b and c), a 3D rendering was edited by Adobe Photoshop CC software preserving the original parameters of image acquisition (d) Fluorescence image showing IFN-DCs (green) crossing connecting-channels facing RI space upon phagocytosis of PKH26-stained SW620 cells (red) as evaluated by CLSM after 48 h from the beginning of migration in the microfluidic device, under competition experimental conditions. The right panel shows a DIC image of the same field. Images are acquired as in (a). Scale bar, 15 μm. Representative images of two independent experiments are shown.CC BY · PubMed Central

Verification

Claims the paper makes

The claims and statistics of this paper haven’t been checked yet.

Run the check — free, no account needed. It reads the open-access text and checks the sources it cites.

A few free checks a day · papers already verified open instantly · results are public

Claims other papers make about this one

Each is checked against this paper’s own text: does it say what the citing paper says it does?

Self-check

Percentages, sums and reported differences re-computed from the paper’s own numbers.

The self-check needs the paper’s full text.

Citations

Cites

Show all 64 references

Cited by

Sorted by citations

See all 181

Metadata

Authors
Parlato, S., De Ninno, A., Molfetta, R., Toschi, E., Salerno, D., Mencattini, A., Romagnoli, G., Fragale, A., Roccazzello, L., Buoncervello, M., Canini, I., Bentivegna, E., Falchi, M., Bertani, F. R., Gerardino, A., Martinelli, E., Natale, C., Paolini, R., Businaro, L., & Gabriele, L.
Affiliations
  • Istituto Superiore di Sanità (IT)
  • Istituto Pasteur (IT)
  • Italian Institute of Technology (IT)
  • University of Rome Tor Vergata (IT)
  • National Research Council (IT)
Corresponding author
  • Businaro, Luca
  • Gabriele, Lucia
Venue
Scientific Reports
Published
2017-04-24
Volume
7
Issue
1
Pages
1093-1093
ISSN
2045-2322 (ISSN-L)
OpenAlex
W2606007772
Cited by
181
References
64
Citations by year
2026: 11 · 2025: 15 · 2024: 18 · 2023: 24 · 2022: 18 · 2021: 27 · 2020: 25 · 2019: 21 · 2018: 16 · 2017: 6
FWCI
8.42
Type
journal article
Language
en
Open access
Locations
  • Scientific Reports (publishedVersion, cc-by)
  • PubMed Central (publishedVersion, cc-by)
  • PubMed (publishedVersion)
  • Cineca Institutional Research Information System (Tor Vergata University) (submittedVersion)
  • DOAJ (DOAJ: Directory of Open Access Journals) (submittedVersion, cc-by-sa)
  • IRIS Research product catalog (Sapienza University of Rome) (submittedVersion, cc-by)
Funders
  • Ministero dell’Istruzione, dell’Università e della Ricerca (MIUR-PRIN2012, SIR 2014, PRIN2012, RBSI14TX20, RBSI14TX20-MUSIC, 20125NMMLA)
  • Associazione Italiana per la Ricerca sul Cancro (#11610)
  • Istituto Italiano di Tecnologia
Topics
  • Life Sciences › Immunology and Microbiology › Immunology › Immunotherapy and Immune Responses
  • Physical Sciences › Engineering › Biomedical Engineering › 3D Printing in Biomedical Research
  • Physical Sciences › Engineering › Biomedical Engineering › Microfluidic and Capillary Electrophoresis Applications
Keywords
dendritic cells, immunotherapy efficacy, phagocytosis, CXCR4, tumor microenvironment, antitumor immunity, cancer immunotherapy
MeSH terms
Cells, Cultured, Colonic Neoplasms, Dendritic Cells, Humans, Immunologic Factors, Immunotherapy, Microscopy, Models, Biological, Treatment Outcome, Interferon-alpha, Microfluidics, Cell Tracking

About these checks

Registry, retraction, Cites and statistics results are computed, not judged, with one exception: a printed reference that no index lists is read once by a model before it counts as a citation error. Claims are extracted by a model and kept only when their quote appears verbatim in the text; each cited source is then checked, with a model’s help, for whether it says what the claim relies on. Those verdicts can be wrong — read the claim’s quote and the cited source before relying on one.

Statistics and arithmetic are recomputed, not judged.

Confidence bands are shown only for fields calibrated on our annotated test set. None is calibrated yet, so no band is shown.

What counts as a claim ›How we measure confidence ›How we check this ›

Are you an author, or do you see a problem with this page? Request a review