

The DOI matches its Crossref record; 44 of the 44 references it cites were found in a registry or an index.
A Novel Indication for Panobinostat as a Senolytic Drug in NSCLC and HNSCC
Open accessAbstract
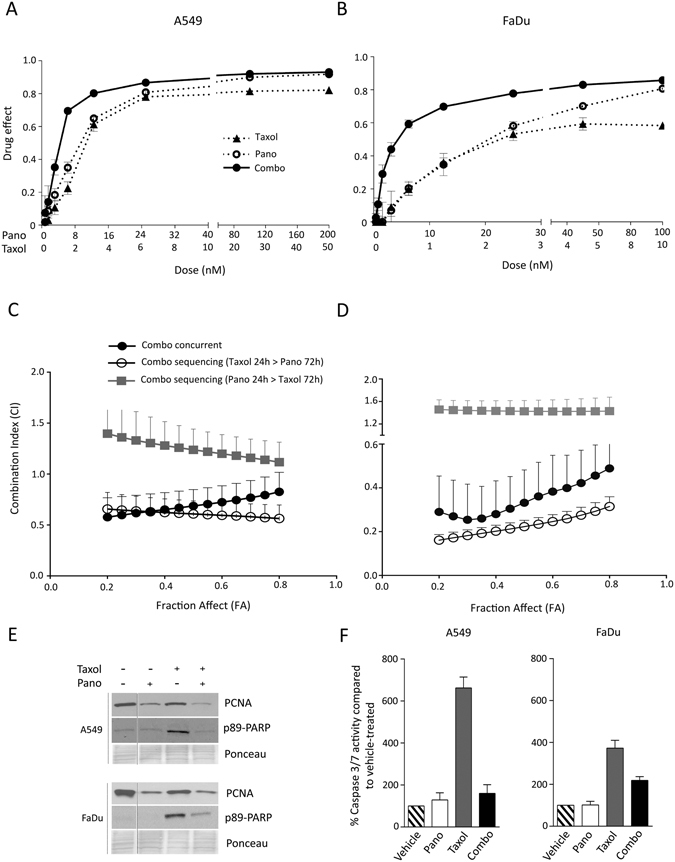
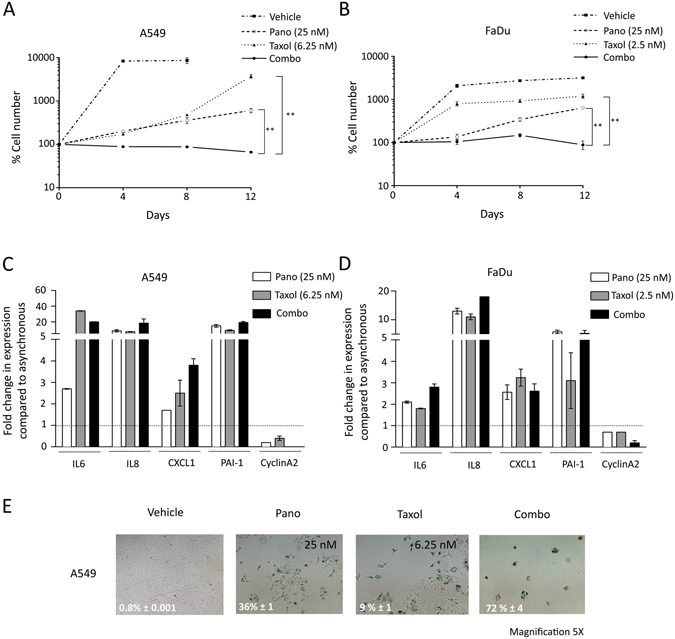
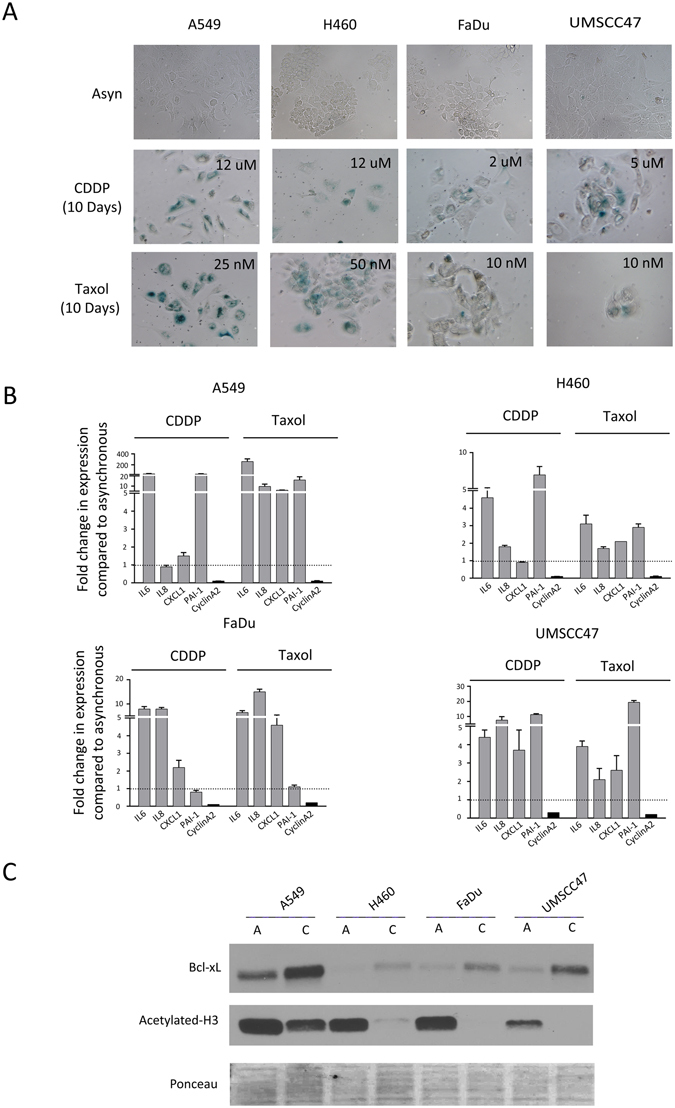
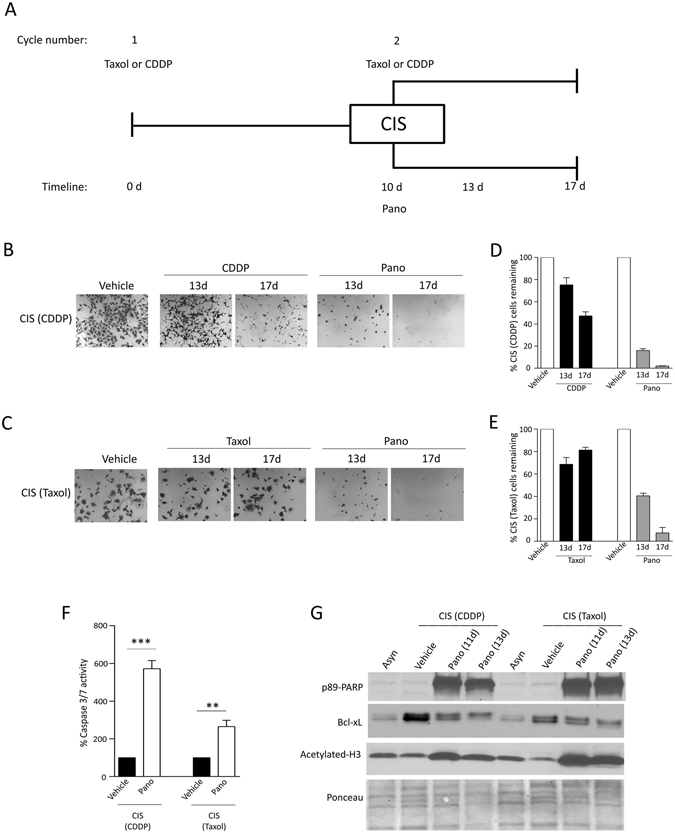
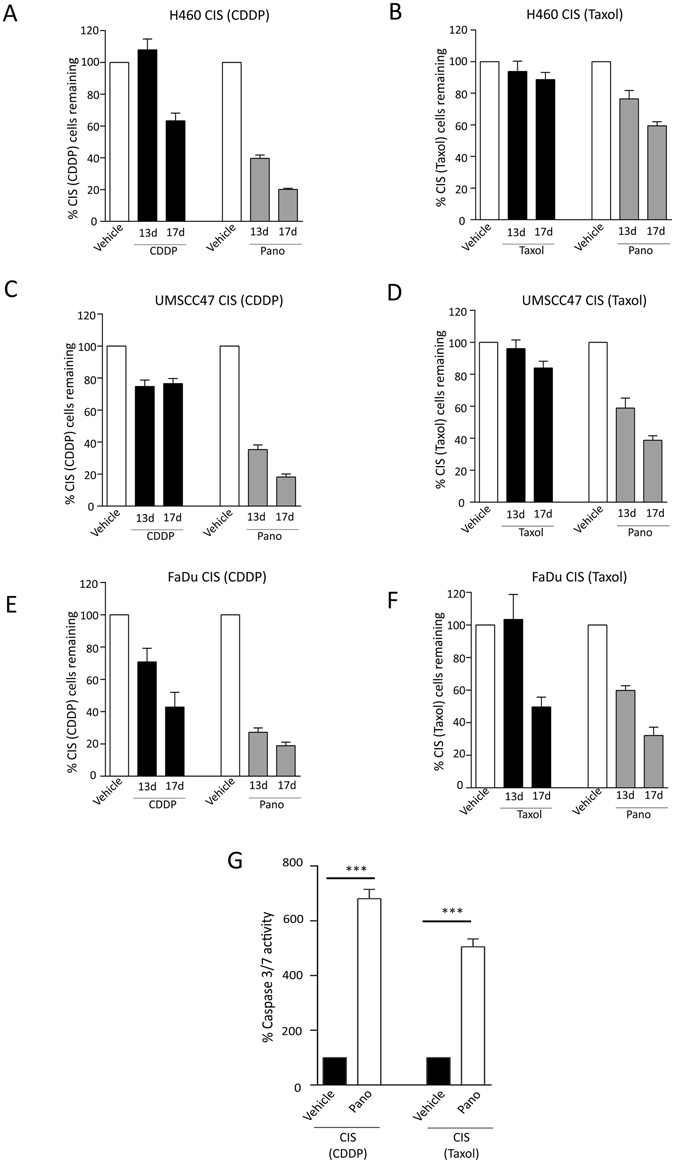
Panobinostat (pano) is an FDA-approved histone deacetylase inhibitor. There is interest in evaluating alternate dosing schedules and novel combinations of pano for the treatment of upper aerodigestive and lung malignancies; thus we evaluated it in combination with Taxol, a chemotherapeutic with activity in both diseases. Dose-dependent synergy was observed in Non-Small Cell Lung Cancer (NSCLC) and Head and Neck Squamous Cell Carcinoma (HNSCC) cell lines and was due to senescence rather than potentiation of cell death. Senescence occurred following cisplatin- or Taxol-treatment in cell lines from both cancer types and was associated with decreased histone 3 (H3) acetylation and increased Bcl-xL expression: the latter a biomarker of senescence and target of anti-senescence therapeutics, or senolytics. Since H3 acetylation and Bcl-xL expression were altered in senescence, we subsequently evaluated pano as a senolytic in chemotherapy-treated cancer cells enriched for senescent cells. Pano caused cell death at significantly higher rates compared to repeat dosing with chemotherapy. This was associated with decreased expression of Bcl-xL and increased acetylated H3, reversing the expression patterns observed in senescence. These data support evaluating pano as a post-chemotherapy senolytic with the potential to kill persistent senescent cells that accumulate during standard chemotherapy in NSCLC and HNSCC.
Overview
The claims and statistics of this paper haven’t been checked yet.
Run the check — free, no account needed. It reads the open-access text and checks the sources it cites.
Integrity signals
Registry
Cites
Statistics
Figures
Verification
Claims the paper makes
The claims and statistics of this paper haven’t been checked yet.
Run the check — free, no account needed. It reads the open-access text and checks the sources it cites.
Claims other papers make about this one
Each is checked against this paper’s own text: does it say what the citing paper says it does?
The cited source says what the claim attributes to it.
In the citing paper
“treatment with histone deacetylase (HDAC) inhibitors, which induce chromatin relaxation, boosts DDR signalling with consequent cell death by apoptosis. This treatment is probably the first reported example of a successful senolytic approach52, which was later supported by the reported senolytic activity of the HDAC inhibitor panobinostat55”
From Cellular senescence in ageing: from mechanisms to therapeutic opportunities (2021) · cites this paper as [55]
Self-check
Percentages, sums and reported differences re-computed from the paper’s own numbers.
The self-check needs the paper’s full text.
Citations
Cites
1 retracted
Zuco, V., Cesare, M. D., Cincinelli, R., Nannei, R., Pisano, C., Zaffaroni, N., & Zunino, F. (2011) · PLoS ONE · doi:10.1371/journal.pone.0029085 · Cited by 63
RetractedChou, T.-C., & Talalay, P. (1984) · Advances in Enzyme Regulation · doi:10.1016/0065-2571(84)90007-4 · Cited by 7,178
The senescence-associated secretory phenotype: the dark side of tumor suppression
Coppé, J.-P., Desprez, P.-Y., Krtolica, A., & Campisi, J. (2010) · Annual Review of Pathology: Mechanisms of Disease · doi:10.1146/annurev-pathol-121808-102144 · Cited by 5,206
Sulforhodamine B colorimetric assay for cytotoxicity screening
Vichai, V., & Kirtikara, K. (2006) · Nature Protocols · doi:10.1038/nprot.2006.179 · Cited by 3,752
Clearance of p16Ink4a-positive senescent cells delays ageing-associated disorders
Baker, D. J., Wijshake, T., Tchkonia, T., LeBrasseur, N. K., Childs, B. G., van de Sluis, B., Kirkland, J. L., & van Deursen, J. M. (2011) · Nature · doi:10.1038/nature10600 · Cited by 3,670
The Achilles' heel of senescent cells: from transcriptome to senolytic drugs
Zhu, Y., Tchkonia, T., Pirtskhalava, T., Gower, A. C., Ding, H., Giorgadze, N., Palmer, A. K., Ikeno, Y., Hubbard, G. B., Lenburg, M., et al. (2015) · Aging Cell · doi:10.1111/acel.12344 · Cited by 2,584
Senescent cells, tumor suppression, and organismal aging: good citizens, bad neighbors
Campisi, J. (2005) · Cell · doi:10.1016/j.cell.2005.02.003 · Cited by 2,379
Clearance of senescent cells by ABT263 rejuvenates aged hematopoietic stem cells in mice
Chang, J., Wang, Y., Shao, L., Laberge, R.-M., Demaria, M., Campisi, J., Janakiraman, K., Sharpless, N. E., Ding, S., Feng, W., et al. (2016) · Nature Medicine · doi:10.1038/nm.4010 · Cited by 1,819
Senescence surveillance of pre-malignant hepatocytes limits liver cancer development
Kang, T.-W., Yevsa, T., Woller, N., Hoenicke, L., Wuestefeld, T., Dauch, D., Hohmeyer, A., Gereke, M., Rudalska, R., Potapova, A., et al. (2011) · Nature · doi:10.1038/nature10599 · Cited by 1,621
Histone deacetylase inhibitors: molecular mechanisms of action
Xu, W. S., Parmigiani, R. B., & Marks, P. A. (2007) · Oncogene · doi:10.1038/sj.onc.1210620 · Cited by 1,542
Ink4a/Arf expression is a biomarker of aging
Krishnamurthy, J., Torrice, C., Ramsey, M. R., Kovalev, G. I., Al-Regaiey, K., Su, L., & Sharpless, N. E. (2004) · Journal of Clinical Investigation · doi:10.1172/jci22475 · Cited by 1,486
New and emerging HDAC inhibitors for cancer treatment
West, A. C., & Johnstone, R. W. (2014) · Journal of Clinical Investigation · doi:10.1172/jci69738 · Cited by 1,404
Zhu, Y., Tchkonia, T., Fuhrmann‐Stroissnigg, H., Dai, H. M., Ling, Y. Y., Stout, M. B., Pirtskhalava, T., Giorgadze, N., Johnson, K. O., Giles, C. B., et al. (2016) · Aging Cell · doi:10.1111/acel.12445 · Cited by 1,148
Sun, Y., Campisi, J., Higano, C., Beer, T. M., Porter, P., Coleman, I., True, L., & Nelson, P. S. (2012) · Nature Medicine · doi:10.1038/nm.2890 · Cited by 793
Methods to Detect Biomarkers of Cellular Senescence
Itahana, K., Campisi, J., & Dimri, G. P. (2007) · Methods in molecular biology · doi:10.1007/978-1-59745-361-5_3 · Cited by 535
Munster, P. N., Thurn, K. T., Thomas, S., Raha, P., Lacevic, M., Miller, A., Melisko, M., Ismail-Khan, R., Rugo, H., Moasser, M., et al. (2011) · British Journal of Cancer · doi:10.1038/bjc.2011.156 · Cited by 391
The proliferation rate paradox in antimitotic chemotherapy
Mitchison, T. J. (2011) · Molecular Biology of the Cell · doi:10.1091/mbc.e10-04-0335 · Cited by 354
Current Treatment Options for Recurrent or Metastatic Head and Neck Squamous Cell Carcinoma
Sacco, A. G., & Cohen, E. E. W. (2015) · Journal of Clinical Oncology · doi:10.1200/jco.2015.62.0963 · Cited by 343
Mitosis is not a key target of microtubule agents in patient tumors
Komlodi-Pasztor, E., Sackett, D., Wilkerson, J., & Fojo, T. (2011) · Nature Reviews Clinical Oncology · doi:10.1038/nrclinonc.2010.228 · Cited by 314
Treatment of non-small cell lung cancer (NSCLC).
Zarogoulidis, P., Zarogoulidis, P., Darwiche, K., Boutsikou, E., Machairiotis, N., Tsakiridis, K., Katsikogiannis, N., Kougioumtzi, I., Karapantzos, Ι., Huang, H., et al. (2013) · Europe PMC (PubMed Central) · doi:10.3978/j.issn.2072-1439.2013.07.10 · Cited by 280
Ramalingam, S. S., Maitland, M. L., Frankel, P. H., Argiris, A. E., Koczywas, M., Gitlitz, B. J., Thomas, S. P., Espinoza‐Delgado, I., Vokes, E. E., Gandara, D. R., et al. (2009) · Journal of Clinical Oncology · doi:10.1200/jco.2009.24.9094 · Cited by 273
Epithelial-Mesenchymal Transition Induced by Senescent Fibroblasts
Laberge, R.-M., Awad, P., Campisi, J., & Desprez, P.-Y. (2012) · Cancer Microenvironment · doi:10.1007/s12307-011-0069-4 · Cited by 255
Duan, H., Heckman, C. A., & Boxer, L. M. (2005) · Molecular and Cellular Biology · doi:10.1128/mcb.25.5.1608-1619.2005 · Cited by 243
Rada-Iglesias, Á., Enroth, S., Ameur, A., Koch, C. M., Clelland, G. K., Respuela, P., Wilcox, S., Dovey, O. M., Ellis, P. D., Langford, C. F., et al. (2007) · Genome Research · doi:10.1101/gr.5540007 · Cited by 170
Münster, P. N., Marchion, D. C., Biçaku, E., Lacevic, M., Kim, J., Centeno, B. A., DAUD, A. I., Neuger, A. M., Minton, S. E., & Sullivan, D. M. (2009) · Clinical Cancer Research · doi:10.1158/1078-0432.ccr-08-1930 · Cited by 150
Qiu, T., Zhou, L. Q., Zhu, W., Wang, T., Wang, J., Shu, Y., & Liu, P. (2013) · Future Oncology · doi:10.2217/fon.12.173 · Cited by 148
Arce, C., Pérez‐Plasencia, C., González‐Fierro, A., la Cruz-Hernández, E. N. D., Vázquez, A. L. R., Chávez-Blanco, A. D., Trejo‐Becerril, C., Pérez‐Cárdenas, E., Taja‐Chayeb, L., Bargalló, E., et al. (2006) · PLoS ONE · doi:10.1371/journal.pone.0000098 · Cited by 146
Dowdy, S. C., Jiang, S., Zhou, X., Hou, X., Jin, F., Podratz, K. C., & Jiang, S. (2006) · Molecular Cancer Therapeutics · doi:10.1158/1535-7163.mct-06-0209 · Cited by 143
Cao, X. X., Mohuiddin, I., Ece, F., McConkey, D. J., & Smythe, W. R. (2001) · American Journal of Respiratory Cell and Molecular Biology · doi:10.1165/ajrcmb.25.5.4539 · Cited by 123
Senescence-Associated Oxidative DNA Damage Promotes the Generation of Neoplastic Cells
Gosselin, K., Martien, S., Pourtier, A., Vercamer, C., Ostoich, P. V., Morat, L., Sabatier, L., Duprez, L., de Roodenbeke, C. T., Gilson, É., et al. (2009) · Cancer Research · doi:10.1158/0008-5472.can-08-2510 · Cited by 119
To clear, or not to clear (senescent cells)? That is the question
Lujambio, A. (2016) · BioEssays · doi:10.1002/bies.201670910 · Cited by 108
Haigentz, M., Kim, M., Sarta, C., Lin, J., Keresztes, R. S., Culliney, B. E., Gaba, A. G., Smith, R. V., Shapiro, G. I., Chirieac, L. R., et al. (2012) · Oral Oncology · doi:10.1016/j.oraloncology.2012.05.024 · Cited by 90
Sidi, R., Pasello, G., Opitz, I., Soltermann, A., Tutic, M., Rehrauer, H., Weder, W., Stahel, R. A., & Felley‐Bosco, E. (2010) · European Journal of Cancer · doi:10.1016/j.ejca.2010.09.044 · Cited by 66
Gray, J. E., Haura, E. B., Chiappori, A., Tanvetyanon, T., Williams, C. C., Pinder-Schenck, M. C., Kish, J. A., Kreahling, J. M., Lush, R. M., Neuger, A. M., et al. (2014) · Clinical Cancer Research · doi:10.1158/1078-0432.ccr-13-2235 · Cited by 58
Frys, S., Simons, Z., Hu, Q., Barth, M. J., Gu, J. J., Mavis, C. K., Skitzki, J. J., Liu, S., Czuczman, M. S., & Hernandez‐Ilizaliturri, F. J. (2015) · British Journal of Haematology · doi:10.1111/bjh.13318 · Cited by 52
Bauer, S., Hilger, R. A., Mühlenberg, T., Grabellus, F., Nagarajah, J., Hoiczyk, M., Reichardt, A., Ahrens, M., Reichardt, P., Grünewald, S., et al. (2014) · British Journal of Cancer · doi:10.1038/bjc.2013.826 · Cited by 50
Oncogene‐induced cellular senescence elicits an anti‐ Warburg effect
Li, M., Durbin, K. R., Sweet, S. M. M., Tipton, J. D., Zheng, Y., & Kelleher, N. L. (2013) · PROTEOMICS · doi:10.1002/pmic.201200298 · Cited by 43
Chao, H., Wang, L., Hao, J., Ni, J., Chang, L., Graham, P., Kearsley, J. H., & Li, Y. (2012) · Cancer Letters · doi:10.1016/j.canlet.2012.08.035 · Cited by 29
Modesitt, S. C., & Parsons, S. J. (2010) · Gynecologic Oncology · doi:10.1016/j.ygyno.2010.06.030 · Cited by 29
Takhar, H. S., Singhal, N., Gowda, R., Penniment, M. G., Takhar, P., & Brown, M. P. (2015) · Anti-Cancer Drugs · doi:10.1097/cad.0000000000000282 · Cited by 26
Chao, S. K., Lin, J., Brouwer‐Visser, J., Smith, A. B., Horwitz, S. B., & McDaid, H. M. (2010) · Proceedings of the National Academy of Sciences · doi:10.1073/pnas.1016962108 · Cited by 22
Self-citationPrystowsky, M. B., Feeney, K. M., Kawachi, N., Montagna, C., Willmott, M., Wasson, C. W., Antkowiak, M. K., Loudig, O. D., & Parish, J. L. (2013) · Scientific Reports · doi:10.1038/srep02640 · Cited by 18
Zhang, W., Hu, D., Ji, W.-D., Yang, L.-Q., Yang, J.-P., Yuan, J.-H., Xuan, A.-G., Zou, F., & Zhuang, Z.-X. (2014) · Free radical research · doi:10.3109/10715762.2014.893580 · Cited by 11
微小管安定化剤と老化誘導剤,ディスコデルモリドに対する耐性は4E-BP1に依存する
Suzan, K. C., Juan, L., Jurriaan, B., Smith Amos, B., Horwitz, S. B., & McDaid, H. M. (2011) · Proceedings of the National Academy of Sciences · Cited by 5
Self-citation
Cited by
Sorted by citations
Cellular senescence in ageing: from mechanisms to therapeutic opportunities
Di Micco, R., Krizhanovsky, V., Baker, D., & d’Adda di Fagagna, F. (2021) · Nature Reviews Molecular Cell Biology · doi:10.1038/s41580-020-00314-w · Cited by 2,277
Hickson, L. J., Langhi Prata, L. G. P., Bobart, S. A., Evans, T. K., Giorgadze, N., Hashmi, S. K., Herrmann, S. M., Jensen, M. D., Jia, Q., Jordan, K. L., et al. (2019) · EBioMedicine · doi:10.1016/j.ebiom.2019.08.069 · Cited by 1,383
Targeting cellular senescence with senotherapeutics: senolytics and senomorphics
Zhang, L. J., Pitcher, L. E., Prahalad, V., Niedernhofer, L. J., & Robbins, P. D. (2022) · FEBS Journal · doi:10.1111/febs.16350 · Cited by 674
Senescent Cells in Cancer Therapy: Friends or Foes?
Wang, B., Kohli, J., & Demaria, M. (2020) · Trends in Cancer · doi:10.1016/j.trecan.2020.05.004 · Cited by 508
Ageing, Cellular Senescence and Neurodegenerative Disease
Kritsilis, M., V. Rizou, S., Koutsoudaki, P. N., Evangelou, K., Gorgoulis, V. G., & Papadopoulos, D. (2018) · International Journal of Molecular Sciences · doi:10.3390/ijms19102937 · Cited by 448
Metadata
- Authors
- Samaraweera, L., Adomako, A., Rodriguez-Gabin, A., & McDaid, H. M.
- Affiliations
- Albert Einstein College of Medicine (US)
- Corresponding author
- McDaid, Hayley M.
- ORCID
- McDaid, Hayley M.
- Venue
- Scientific Reports
- Published
- 2017-05-15
- Volume
- 7
- Issue
- 1
- Pages
- 1900-1900
- ISSN
- 2045-2322 (ISSN-L)
- PMC
- PMC5432488
- OpenAlex
- W2612435930
- Cited by
- 183
- References
- 44
- Citations by year
- 2026: 13 · 2025: 23 · 2024: 17 · 2023: 21 · 2022: 28 · 2021: 26 · 2020: 26 · 2019: 16 · 2018: 11 · 2017: 2
- FWCI
- 11.13
- Type
- journal article
- Language
- en
- Open access
- gold
- doi.org
- Locations
- Scientific Reports (publishedVersion, cc-by)
- PubMed Central (publishedVersion, cc-by)
- PubMed (publishedVersion)
- DOAJ (DOAJ: Directory of Open Access Journals) (submittedVersion, cc-by-sa)
- Funders
- Breast Cancer Research Foundation
- Albert Einstein Cancer Center (P30CA013330)
- National Institutes of Health (5k12ca132783-12)
- National Cancer Institute (K12-CA132783, R01CA077263, CA 077263, CA132783, P30CA013330)
- Topics
- Life Sciences › Biochemistry, Genetics and Molecular Biology › Cell Biology › Telomeres, Telomerase, and Senescence
- Life Sciences › Biochemistry, Genetics and Molecular Biology › Molecular Biology › Histone Deacetylase Inhibitors Research
- Life Sciences › Biochemistry, Genetics and Molecular Biology › Molecular Biology › Cell death mechanisms and regulation
- Keywords
- panobinostat, senolytics, histone deacetylase inhibitors, non-small cell lung cancer, head and neck squamous cell carcinoma, paclitaxel, cisplatin, cellular senescence, Bcl-xL, histone H3 acetylation, drug synergy
- MeSH terms
- Squamous Cell Carcinoma of Head and Neck, Panobinostat, Antineoplastic Agents, Carcinoma, Non-Small-Cell Lung, Cell Survival, Dose-Response Relationship, Drug, Drug Synergism, Humans, Lung Neoplasms, Cellular Senescence, Apoptosis, Paclitaxel, Cell Line, Tumor, Histone Deacetylase Inhibitors
About these checks
Registry, retraction, Cites and statistics results are computed, not judged, with one exception: a printed reference that no index lists is read once by a model before it counts as a citation error. Claims are extracted by a model and kept only when their quote appears verbatim in the text; each cited source is then checked, with a model’s help, for whether it says what the claim relies on. Those verdicts can be wrong — read the claim’s quote and the cited source before relying on one.
Statistics and arithmetic are recomputed, not judged.
Confidence bands are shown only for fields calibrated on our annotated test set. None is calibrated yet, so no band is shown.
What counts as a claim ›How we measure confidence ›How we check this ›
Are you an author, or do you see a problem with this page? Request a review
