

The Effects of GLCM parameters on LAI estimation using texture values from Quickbird Satellite Imagery
Open accessThe DOI matches its Crossref record; 32 of the 33 references it cites were found in a registry or an index.
Abstract
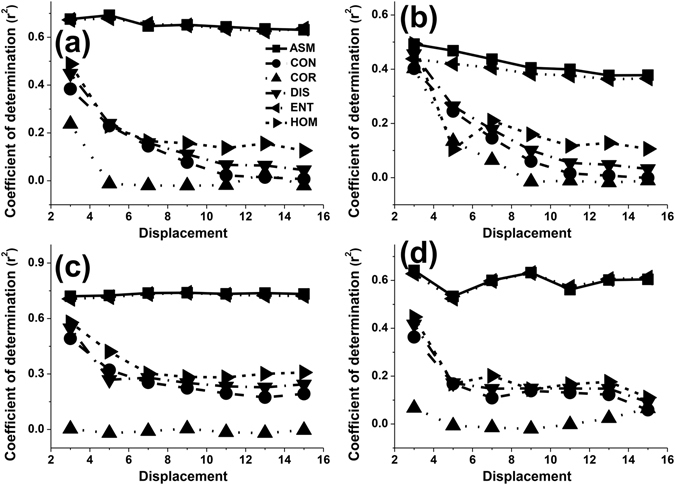
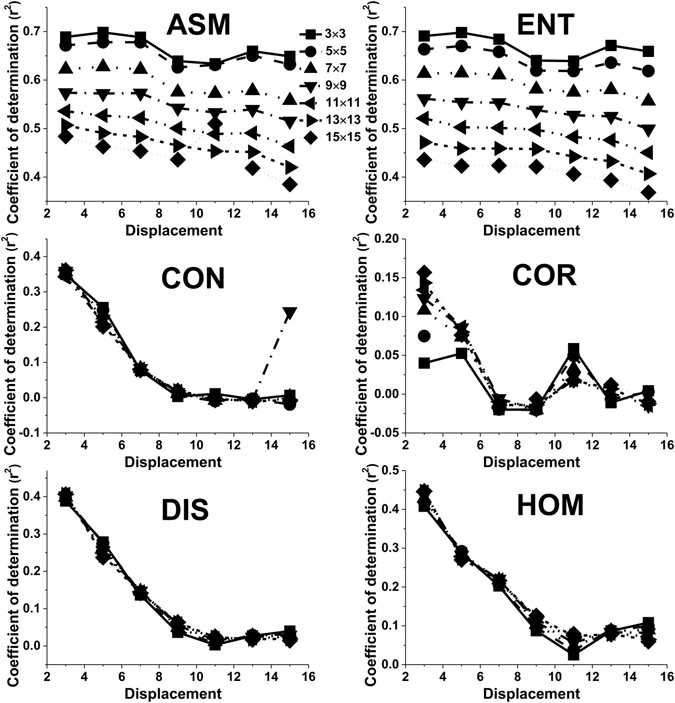
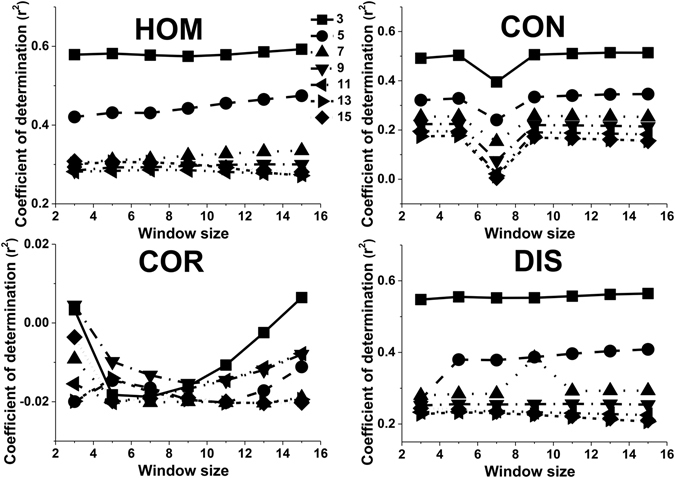
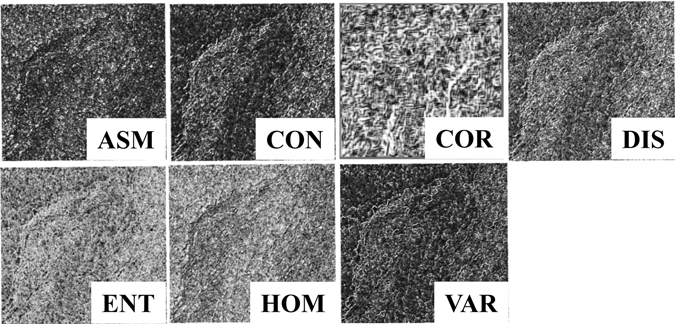
When the leaf area index (LAI) of a forest reaches 3, the problem of spectrum saturation becomes the main limitation to improving the accuracy of the LAI estimate. A sensitivity analysis of the Grey Level Co-occurrence Matrix (GLCM) parameters which can be applied to satellite image processing and analysis showed that the most important parameters included orientation, displacement and moving window size. We calculated the values of Angular Second Moment (ASM), Entropy (ENT), Correlation (COR), Contrast (CON), Dissimilarity (DIS) and Homogeneity (HOM) from Quickbird panchromatic imagery using a GLCM method. Four orientations, seven displacements and seven window sizes were considered. An orientation of 90° was best for estimating the LAI of black locust forest, regardless of moving window size, displacement and texture parameters. Displacements of 3 pixels appeared to be best. The orientation and window size had only a little influence on these settings. The highest adjusted r 2 values were obtained using a 3 × 3 moving window size for ASM and ENT. The tendency of CON, COR, DIS and HOM to vary with window size was significantly affected by orientation. This study can help with parameter selection when texture features from high resolution imagery are used to estimate broad-leaved forest structure information.
Overview
The claims and statistics of this paper haven’t been checked yet.
Free: it reads the open-access text and checks the first 5 claims that cite a source we can check. Create a free account to check every claim.
Integrity signals
Registry
Cites
Statistics
Figures





Verification
Claims the paper makes
The claims and statistics of this paper haven’t been checked yet.
Free: it reads the open-access text and checks the first 5 claims that cite a source we can check. Create a free account to check every claim.
Self-check
Percentages, sums and reported differences re-computed from the paper’s own numbers.
The self-check needs the paper’s full text.
Citations
Cites
Textural Features for Image Classification
Haralick, R. M., Shanmugam, K., & Dinstein, I. (1973) · IEEE Transactions on Systems, Man, and Cybernetics · doi:10.1109/tsmc.1973.4309314 · Cited by 22,886 · cited 1×
“11 was employed to measure texture features using a Quickbird panchromatic image.”
MethodStatistical and structural approaches to texture
Haralick, R. M. (1979) · Proceedings of the IEEE · doi:10.1109/proc.1979.11328 · Cited by 5,759 · cited 2×
“A GLCM is a symmetric matrix with each value representing the probability values of nearest neighbour grey tone at a given distance and orientation 28 .”
BackgroundAn analysis of co-occurrence texture statistics as a function of grey level quantization
Clausi, D. A. (2002) · Canadian Journal of Remote Sensing · doi:10.5589/m02-004 · Cited by 1,011 · cited 1×
“However, Clausi 19 suggested that each orientation should be used to calculate texture value.”
BackgroundRodriguez-Galiano, V. F., Chica-Olmo, M., Abarca-Hernandez, F., Atkinson, P. M., & Jeganathan, C. (2012) · Remote Sensing of Environment · doi:10.1016/j.rse.2011.12.003 · Cited by 590
Retrieval of leaf area index in different vegetation types using high resolution satellite data
Colombo, R. (2003) · Remote Sensing of Environment · doi:10.1016/s0034-4257(03)00094-4 · Cited by 376 · cited 1×
“32 , who reported that the best textural indicator for this purpose was the dissimilarity index, computed using a 6 × 6 pixel window.”
MethodRetrieving forest structure variables based on image texture analysis and IKONOS-2 imagery
Kayitakire, F., Hamel, C., & Defourny, P. (2006) · Remote Sensing of Environment · doi:10.1016/j.rse.2006.02.022 · Cited by 348 · cited 7×
“15 considered that the displacement and moving window size were the most sensitive input variables when they estimated forest structure parameters.”
BackgroundMethodResultInfluentialPuissant, A., Hirsch, J., & Weber, C. (2005) · International Journal of Remote Sensing · doi:10.1080/01431160512331316838 · Cited by 324 · cited 2×
“The sensitivity of these texture parameters in relation to LAI estimation using GLCM has not been thoroughly studied 16 .”
MethodRiaño, D., Valladares, F., Condés, S., & Chuvieco, E. (2004) · Agricultural and Forest Meteorology · doi:10.1016/j.agrformet.2004.02.005 · Cited by 284 · cited 1×
“= − iP Entropy (ENT) ( lnP ) (4) i j N”
A multiscale texture analysis procedure for improved forest stand classification
Coburn, C. A., & Roberts, A. C. B. (2004) · International Journal of Remote Sensing · doi:10.1080/0143116042000192367 · Cited by 273 · cited 2×
“Coburn & Roberts 13 showed that texture features cannot be described clearly by only using one moving window size.”
BackgroundImage texture as a remotely sensed measure of vegetation structure
Wood, E. M., Pidgeon, A. M., Radeloff, V. C., & Keuler, N. S. (2012) · Remote Sensing of Environment · doi:10.1016/j.rse.2012.01.003 · Cited by 270 · cited 1×
“Some studies have shown that image texture measures calculated using a small window size from high resolution imagery were most strongly associated with vegetation structure as observed on the ground 3, 6 .”
Background
Research works printed but not linked: 1
- Barber, D. G., Ledrew, E. F. & Barber, D. G. SAR sea ice discrimination using texture statistics: A multivariate approach. Photogramm. Eng. Rem. S. 57, 385–395 (1991).
Cited by
Automated Visual Defect Detection for Flat Steel Surface: A Survey
Luo, Q., Fang, X., Liu, L., Yang, C., & Sun, Y. (2020) · IEEE Transactions on Instrumentation and Measurement · doi:10.1109/tim.2019.2963555 · Cited by 559
“Subsequently, GLCM has shown powerful ability on automatic texture discrimination in [36-38].”
Mutanga, O., Masenyama, A., & Sibanda, M. (2023) · ISPRS Journal of Photogrammetry and Remote Sensing · doi:10.1016/j.isprsjprs.2023.03.010 · Cited by 244
Ferreira, M. P., Wagner, F. H., Aragão, L. E. O. C., Shimabukuro, Y. E., & de Souza Filho, C. R. (2019) · ISPRS Journal of Photogrammetry and Remote Sensing · doi:10.1016/j.isprsjprs.2019.01.019 · Cited by 176
Liu, S., Jin, X., Nie, C., Wang, S., Yu, X., Cheng, M., Shao, M., Wang, Z., Tuohuti, N., Bai, Y., et al. (2021) · Plant Physiology · doi:10.1093/plphys/kiab322 · Cited by 167
Self-citationMonitoring tropical forest carbon stocks and emissions using Planet satellite data
Csillik, O., Kumar, P., Mascaro, J., O’Shea, T., & Asner, G. P. (2019) · Scientific Reports · doi:10.1038/s41598-019-54386-6 · Cited by 160
Metadata
- Authors
- Zhou, J., Yan Guo, R., Sun, M., Di, T. T., Wang, S., Zhai, J., & Zhao, Z.
- Affiliations
- Huazhong Agricultural University (CN)
- Northwest A&F University (CN)
- Corresponding author
- Zhao, Zhong
- Venue
- Scientific Reports
- Published
- 2017-08-04
- Volume
- 7
- Issue
- 1
- Pages
- 7366-7366
- ISSN
- 2045-2322 (ISSN-L)
- PMC
- PMC5544764
- OpenAlex
- W2741876794
- Semantic Scholar
- 308f04c7f93cb926529975b9c1b54964c4b3f56e
- Cited by
- 95
- References
- 33
- Citations by year
- 2026: 13 · 2025: 10 · 2024: 12 · 2023: 16 · 2022: 14 · 2021: 11 · 2020: 10 · 2019: 8 · 2018: 1
- FWCI
- 3.92
- Type
- journal article
- Language
- en
- Open access
- gold
- doi.org
- Licence
- cc-by
- creativecommons.org/licenses/by/4.0 (tdm)
- creativecommons.org/licenses/by/4.0 (vor)
- Locations
- Scientific Reports (publishedVersion, cc-by)
- PubMed Central (publishedVersion, cc-by)
- PubMed (publishedVersion)
- DOAJ (DOAJ: Directory of Open Access Journals) (submittedVersion, cc-by-sa)
- Funders
- Fundamental Research Funds for the Central Universities
- Topics
- Physical Sciences › Environmental Science › Ecology › Remote Sensing in Agriculture
- Life Sciences › Agricultural and Biological Sciences › Forestry › Remote Sensing and LiDAR Applications
- Physical Sciences › Computer Science › Computer Vision and Pattern Recognition › Remote-Sensing Image Classification
- Keywords
- leaf area index retrieval, gray level co-occurrence matrix, texture features, QuickBird imagery, panchromatic imagery, spectral saturation, orientation, displacement, moving window size, angular second moment, entropy (information theory), forest structure
About these checks
Registry, retraction, Cites and statistics results are computed, not judged, with one exception: a printed reference that no index lists is read once by a model before it counts as a citation error. Claims are extracted by a model and kept only when their quote appears verbatim in the text; each cited source is then checked, with a model’s help, for whether it says what the claim relies on. Those verdicts can be wrong — read the claim’s quote and the cited source before relying on one.
Statistics and arithmetic are recomputed, not judged.
Confidence bands are shown only for fields calibrated on our annotated test set. None is calibrated yet, so no band is shown.
What counts as a claim ›How we measure confidence ›How we check this ›
Are you an author, or do you see a problem with this page? Request a review
How to cite
Cite CoChat for the checks on this page, and the paper for its own findings.
- This page
- CoChat. (2026). Citation check: The Effects of GLCM parameters on LAI estimation using texture values from Quickbird Satellite Imagery. https://app.cochat.ai/papers/10.1038/s41598-017-07951-w
- The paper
- Zhou, J., Yan Guo, R., Sun, M., Di, T. T., Wang, S., Zhai, J., & Zhao, Z. (2017). The Effects of GLCM parameters on LAI estimation using texture values from Quickbird Satellite Imagery. Scientific Reports. https://doi.org/10.1038/s41598-017-07951-w
Data sources
Bibliographic data: Semantic Scholar, OpenAlex, Crossref.
Contains information from the Semantic Scholar Academic Graph Datasets, made available under the ODC Attribution License (ODC-BY 1.0).
Semantic Scholar’s data is described in: Kinney, R., et al. (2023). The Semantic Scholar Open Data Platform. arXiv:2301.10140.
