

The DOI matches its Crossref record; 1 of the 1 references it cites were found in a registry or an index.
Localized iron accumulation precedes nucleation and growth of magnetite crystals in magnetotactic bacteria
Open accessAbstract
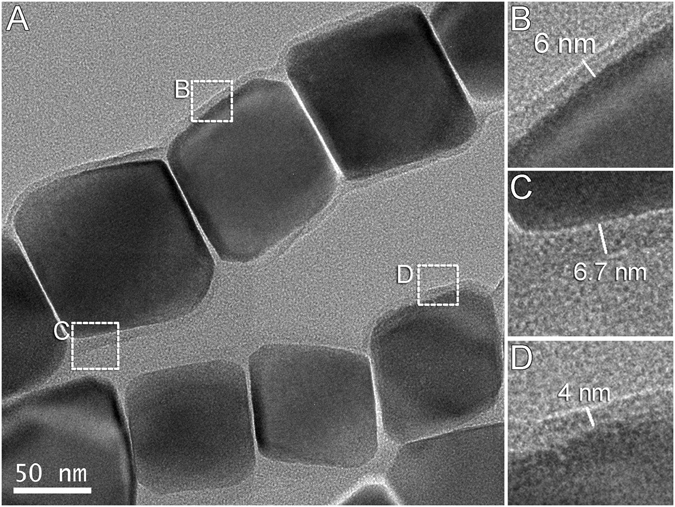
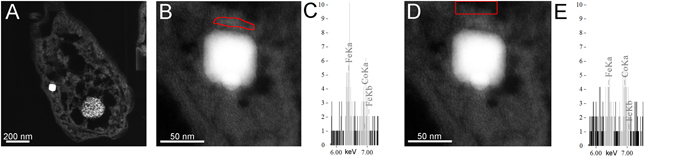
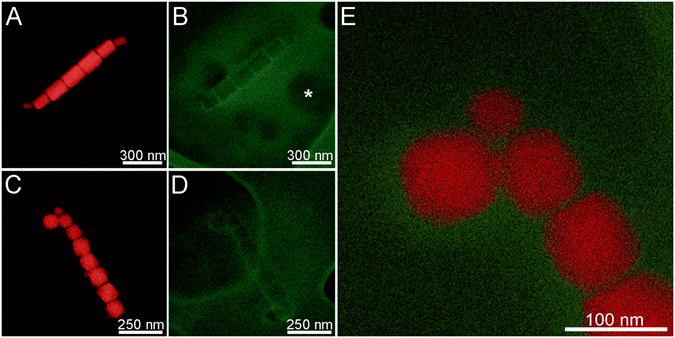
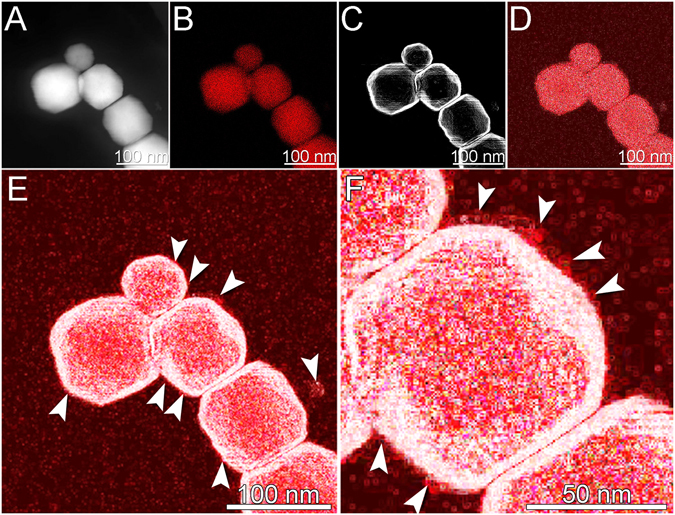
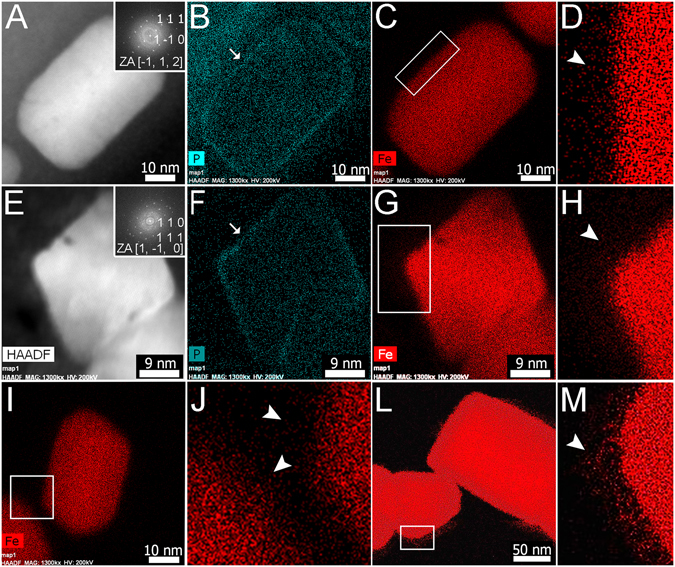
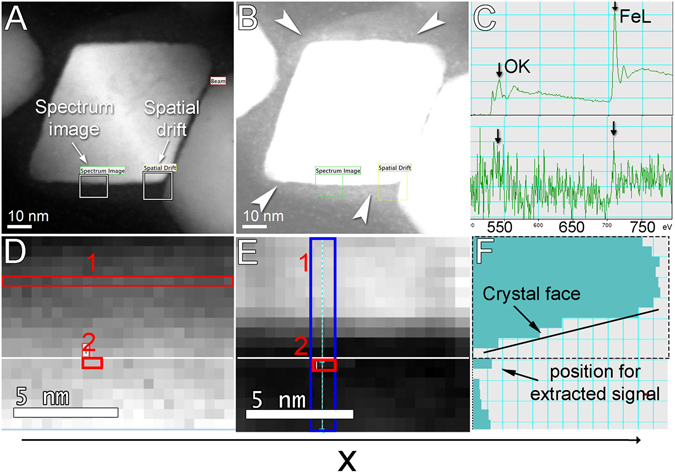
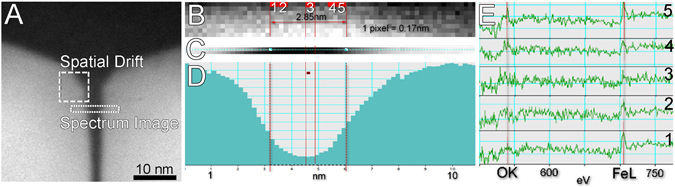
Many magnetotactic bacteria (MTB) biomineralize magnetite crystals that nucleate and grow inside intracellular membranous vesicles that originate from invaginations of the cytoplasmic membrane. The crystals together with their surrounding membranes are referred to magnetosomes. Magnetosome magnetite crystals nucleate and grow using iron transported inside the vesicle by specific proteins. Here we address the question: can iron transported inside MTB for the production of magnetite crystals be spatially mapped using electron microscopy? Cultured and uncultured MTB from brackish and freshwater lagoons were studied using analytical transmission electron microscopy in an attempt to answer this question. Scanning transmission electron microscopy was used at sub-nanometric resolution to determine the distribution of elements by implementing high sensitivity energy dispersive X-ray (EDS) mapping and electron energy loss spectroscopy (EELS). EDS mapping showed that magnetosomes are enmeshed in a magnetosomal matrix in which iron accumulates close to the magnetosome forming a continuous layer visually appearing as a corona. EELS, obtained at high spatial resolution, confirmed that iron was present close to and inside the lipid bilayer magnetosome membrane. This study provides important clues to magnetite formation in MTB through the discovery of a mechanism where iron ions accumulate prior to magnetite biomineralization.
Overview
The claims and statistics of this paper haven’t been checked yet.
Run the check — free, no account needed. It reads the open-access text and checks the sources it cites.
Integrity signals
Registry
Cites
Statistics
Figures
Verification
Claims the paper makes
The claims and statistics of this paper haven’t been checked yet.
Run the check — free, no account needed. It reads the open-access text and checks the sources it cites.
Claims other papers make about this one
Each is checked against this paper’s own text: does it say what the citing paper says it does?
The cited source says what the claim attributes to it.
In the citing paper
“This biomineralization also occurs within intracellular membranous vesicles that originate from invaginations of the cytoplasmic membrane [139].”
From Asbestos and Iron (2023) · cites this paper as [139]
Self-check
Percentages, sums and reported differences re-computed from the paper’s own numbers.
The self-check needs the paper’s full text.
Citations
Cites
An Overview of Biomineralization Processes and the Problem of the Vital Effect
Weiner, S. (2003) · Reviews in Mineralogy and Geochemistry · doi:10.2113/0540001 · Cited by 1,022
Research works printed but not linked: 40
- Cappellen, P. V. Biomineralization and global biogeochemical cycles. Rev. in Mineral. Geochem. 54, 357–381 (2003). · DOI
- Bazylinski, D. A. & Frankel, R. B. Magnetosome formation in prokaryotes. Nature Rev. Microbiol. 2, 217–230 (2004). · DOI
- Frankel, R. B., Bazylinski, D. A., Johnson, M. S. & Taylor, B. L. Magneto-aerotaxis in marine coccoid bacteria. Biophys. J. 73, 994–1000 (1997). · DOI
- Lowenstam, H. A. Minerals formed by organisms. Science 211, 1126–1131 (1981). · DOI · Paper page
- Pósfai, M., Lefèvre, C. T., Trubitsyn, D., Bazylinski, D. A. & Frankel, R. B. Phylogenetic significance of composition and crystal morphology of magnetosome minerals. Front. Microbiol. 4, 344, doi:10.3389/fmicb.2013.00344 (2013). · DOI
- Rahn-Lee, L. et al. A genetic strategy for probing the functional diversity of magnetosome formation. PLoS Genet. 11, e1004811, doi:10.1371/journal.pgen.1004811 (2015). · DOI
- Cornejo, E., Subramanian, P., Li, Z., Jensen, G. J. & Komeili, A. Dynamic remodeling of the magnetosome membrane is triggered by the initiation of biomineralization. MBio. 7, e01898–15, doi:10.1128/mBio.01898-15 (2016). · DOI
- Nudelman, H. et al. Structure-function studies of the magnetite-biomineralizing magnetosome-associated protein MamC. J. Struct. Biol. 194, 244–252 (2016). · DOI
- Yamagishi, A. et al. Control of magnetite nanocrystal morphology in magnetotactic bacteria by regulation of mms7 gene expression. Sci. Rep. 6, 29785, doi:10.1038/srep29785 (2016). · DOI
- Uebe, R. & Schüler, D. Magnetosome biogenesis in magnetotactic bacteria. Nature Rev. Microbiol. 14, 621–637 (2016). · DOI
- Grünberg, K., Wawer, C., Tebo, B. M. & Schüler, D. A large gene cluster encoding several magnetosome proteins is conserved in different species of magnetotactic bacteria. Appl. Environ. Microbiol. 67, 4573–4582 (2001). · DOI
- Ullrich, S., Kube, M., Schübbe, S., Reinhardt, R. & Schüler, D. A hypervariable 130kilobase genomic region of Magnetospirillum gryphiswaldense comprises a magnetosome island which undergoes frequent rearrangements during stationary growth. J. Bacteriol. 187, 7176–7184 (2005). · DOI
- Faivre, D. & Godec, U. K. From bacteria to mollusks: the principles underlying the biomineralization of iron oxide materials. Angew. Chem. Int. Ed. Engl. 54, 4728–4747 (2015). · DOI
- Mandernack, K. W., Bazylinski, D. A., Shanks, W. C. & Bullen, T. D. Oxygen and iron isotope studies of magnetite produced by magnetotactic bacteria. Science 285, 1892–1896 (1999). · DOI
- Frankel, R. B., Blakemore, R. & Wolfe, R. S. Magnetite in freshwater magnetotactic bacteria. Science 203, 1355–1356 (1979). · DOI
- Frankel, R. B., Papaefthymiou, G. C., Blakemore, R. P. & O’Brien, W. D. Fe3O4 precipitation in magnetotactic bacteria. Biochim. Biophys. Acta. 763, 147–159 (1983). · DOI
- Faivre, D., Böttger, L. H., Matzanke, B. F. & Schüler, D. Intracellular magnetite biomineralization in bacteria proceeds by a distinct pathway involving membrane-bound ferritin and an iron(II) species. Angew. Chem. Int. Ed. Engl. 46, 8495–8499 (2007). · DOI
- Staniland, S., Ward, B., Harrianson, A., Van der Laan, G. & Telling, N. Rapid magnetosome formation shown by real-time x-ray magnetic circular dichroism. Proc. Natl. Acad. Sci. USA 104, 19524–19528 (2007). · DOI
- Baumgartner, J. et al. Magnetotactic bacteria form magnetite from a phosphate-rich ferric hydroxide via nanometric ferric (oxyhydr)oxide intermediates. Proc. Natl. Acad. Sci. USA 110, 14883–14888 (2013). · DOI
- Dunin-Borkowski, R. E. et al. Magnetic microstructure of magnetotactic bacteria by electron holography. Science 282, 1868–1870 (1998). · DOI
- Lins, U., Mc Cartney, M. C., Farina, M., Frankel, R. B. & Buseck, P. R. Habits of magnetosome crystals in coccoid magnetotactic bacteria. Appl. Environ. Microbiol. 71, 4902–4905 (2005). · DOI
- Peyre, H., Duval, P. & Henry, L. Diffraction de Fresnel des électrons diffusés élastiquement et inélastiquement par des écrans semi-transparents. J. Phys. 41, 1353–1360 (1980). · DOI
- Pennycook, S. J. Z-Contrast STEM for materials science. Ultramicroscopy 30, 58–69 (1989). · DOI
- Nudelman, H. & Zarivach, R. Structure prediction of magnetosome-associated proteins. Front. Microbiol. 5, 9, doi:10.3389/fmicb.2014.00009 (2014). · DOI
- Balkwill, D. L., Maratea, D. & Blakemore, R. P. Ultrastructure of a magnetotactic spirillum. J. Bacteriol. 141, 1399–1408 (1980). · DOI
- Komeili, A., Li, Z., Newman, D. K. & Jensen, G. J. Magnetosomes are cell membrane invaginations organized by the actin-like protein mamk. Science 311, 242–245 (2006). · DOI
- Gorby, Y. A., Beveridge, T. J. & Blakemore, R. P. Characterization of the bacterial magnetosome membrane. J. Bacteriol. 170, 834–841 (1988). · DOI
- Andersen, O. S. & Koeppe, R. E. Bilayer thickness and membrane protein function: an energetic perspective. Annu. Rev. Biophys. Biomol. Struct. 36, 107–130 (2007). · DOI
- Taoka, A. et al. Spatial localizations of Mam22 and Mam12 in the magnetosomes of Magnetospirillum magnetotacticum. J. Bacteriol. 188, 3805–3812 (2006). · DOI
- Yamamoto, D. et al. Visualization and structural analysis of the bacterial magnetic organelle magnetosome using atomic force microscopy. Proc. Natl. Acad. Sci. USA 107, 9382–9387 (2010). · DOI
- Taylor, A. P. & Barry, J. C. Magnetosomal matrix: ultrafine structure may template biomineralization of magnetosomes. J. Microsc. 213, 180–197 (2004). · DOI
- Schüler, D. & Baeuerlein, E. Dynamics of iron uptake and Fe3O4 biomineralization during aerobic and microaerobic growth of Magnetospirillum gryphiswaldense. J. Bacteriol. 180, 159–162 (1998). · DOI
- Meghan, E. B. et al. Desulfovibrio magneticus RS-1 contains an iron- and phosphorus-rich organelle distinct from its bulletshaped magnetosomes. Proc. Natl. Acad. Sci. USA 107, 12263–12268 (2010). · DOI
- Lefèvre, C. T. et al. Morphological features of elongated-anisotropic magnetosome crystals in magnetotactic bacteria of the Nitrospirae phylum and the Deltaproteobacteria class. Earth Planet. Sci. Lett. 312, 194–200 (2011). · DOI
- Frankel, R. B. & Papaefthymiou, G. C. Biomineralization of Fe3O4 in bacteria. Chemical mossbauer spectroscopy (ed. Herber, R. H.) 113–132 (Plenum Press, New York, 1984). · DOI
- Abreu, F. et al. Cryo-electron tomography of the magnetotactic vibrio Magnetovibrio blakemorei: Insights into the biomineralization of prismatic magnetosomes. J. Struct. Biol. 181, 162–168 (2013). · DOI
- Lins, U. et al. Simple homemade apparatus for harvesting uncultured magnetotactic microorganisms. Braz. J. Microbiol. 34, 111–116 (2003). · DOI
- Morillo, V. et al. Isolation, cultivation and genomic analysis of magnetosome biomineralization genes of a new genus of South-seeking magnetotactic cocci within the Alphaproteobacteria. Front. Microbiol. 5, 72, doi:10.3389/fmicb.2014.00072 (2014). · DOI
- Silva, K. T. et al. Optimization of magnetosome production and growth by the magnetotactic vibrio Magnetovibrio blakemorei strain MV-1 through a statistics-based experimental design. Appl. Environ. Microbiol. 79, 2823–2827 (2013). · DOI
- Fdez-Gubieda, M. et al. Magnetite Biomineralization in Magnetospirillum gryphiswaldense: Time-Resolved Magnetic and Structural Studies. ACS Nano. 7, 3297–3305 (2013). · DOI
Cited by
Sorted by citations
Ghio, A. J., Stewart, M., Sangani, R. G., Pavlisko, E. N., & Roggli, V. L. (2023) · International Journal of Molecular Sciences · doi:10.3390/ijms241512390 · Cited by 15
“This biomineralization also occurs within intracellular membranous vesicles that originate from invaginations of the cytoplasmic membrane [139].”
Background
Metadata
- Authors
- Werckmann, J., Cypriano, J., Lefèvre, C. T., Dembelé, K., Ersen, O., Bazylinski, D. A., Lins, U., & Farina, M.
- Affiliations
- Universidade Federal do Rio de Janeiro (BR)
- Centre National de la Recherche Scientifique (FR)
- University of Nevada, Las Vegas (US)
- Corresponding author
- Werckmann, Jacques
- Venue
- Scientific Reports
- Published
- 2017-08-15
- Volume
- 7
- Issue
- 1
- Pages
- 8291-8291
- ISSN
- 2045-2322 (ISSN-L)
- PMC
- PMC5557804
- OpenAlex
- W2744758543
- Cited by
- 20
- References
- 1
- Citations by year
- 2025: 2 · 2024: 5 · 2023: 2 · 2022: 3 · 2021: 2 · 2020: 3 · 2019: 3
- FWCI
- 0.67
- Type
- journal article
- Language
- en
- Open access
- gold
- doi.org
- Locations
- Scientific Reports (publishedVersion, cc-by)
- PubMed Central (publishedVersion, cc-by)
- PubMed (publishedVersion)
- HAL (submittedVersion, cc-by)
- Digital Scholarship - UNLV (University of Nevada Reno) (submittedVersion, cc-by)
- DOAJ (DOAJ: Directory of Open Access Journals) (submittedVersion, cc-by-sa)
- Funders
- National Science Foundation (1423939)
- Agence Nationale de la Recherche (ANR-16-TERC-0025)
- Coordenação de Aperfeiçoamento de Pessoal de Nível Superior
- Conselho Nacional de Desenvolvimento Científico e Tecnológico
- Fundação Carlos Chagas Filho de Amparo à Pesquisa do Estado do Rio de Janeiro
- Centre National de la Recherche Scientifique
- Universidade Federal do Rio de Janeiro
- Topics
- Physical Sciences › Earth and Planetary Sciences › Geophysics › Geomagnetism and Paleomagnetism Studies
- Physical Sciences › Materials Science › Materials Chemistry › Magnetic Properties and Synthesis of Ferrites
- Physical Sciences › Environmental Science › Environmental Engineering › Microbial Fuel Cells and Bioremediation
- Keywords
- magnetotactic bacteria, magnetite biomineralization, magnetosomes, iron accumulation, crystal nucleation and growth, iron transport, electron energy loss spectroscopy, energy-dispersive X-ray mapping
- MeSH terms
- Crystallization, Iron, Rhodospirillaceae, Liquid Crystals, Ferrosoferric Oxide, Magnetosomes
About these checks
Registry, retraction, Cites and statistics results are computed, not judged, with one exception: a printed reference that no index lists is read once by a model before it counts as a citation error. Claims are extracted by a model and kept only when their quote appears verbatim in the text; each cited source is then checked, with a model’s help, for whether it says what the claim relies on. Those verdicts can be wrong — read the claim’s quote and the cited source before relying on one.
Statistics and arithmetic are recomputed, not judged.
Confidence bands are shown only for fields calibrated on our annotated test set. None is calibrated yet, so no band is shown.
What counts as a claim ›How we measure confidence ›How we check this ›
Are you an author, or do you see a problem with this page? Request a review
