

The DOI matches its Crossref record; 62 of the 62 references it cites were found in a registry or an index.
Real-time EEG-based brain-computer interface to a virtual avatar enhances cortical involvement in human treadmill walking
Open accessAbstract
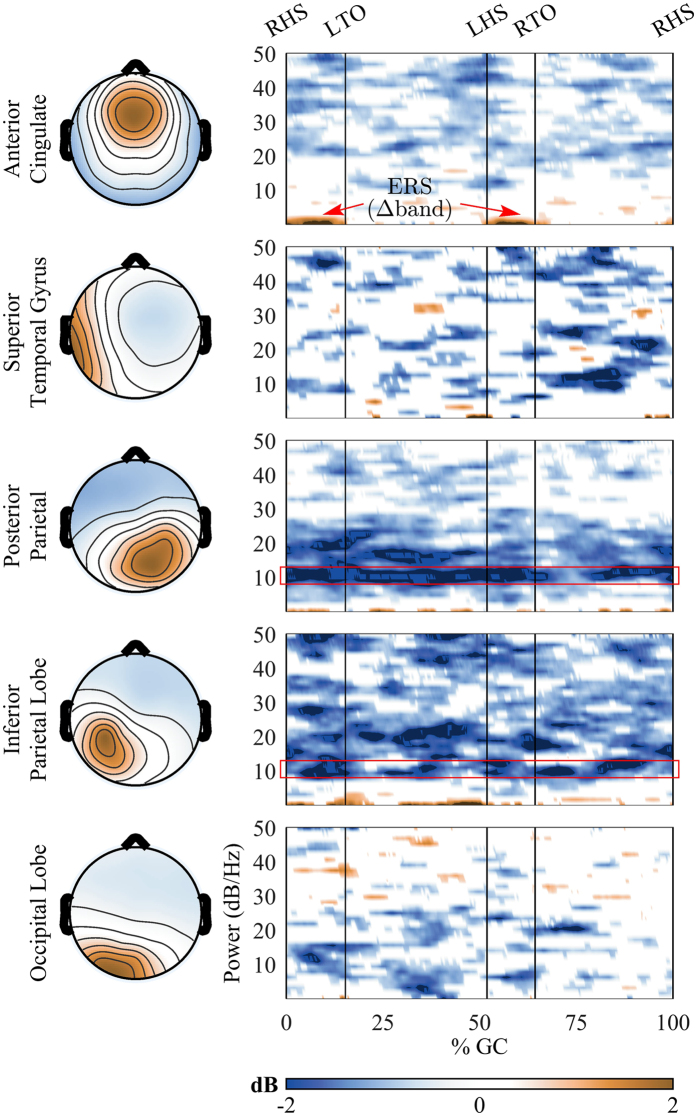
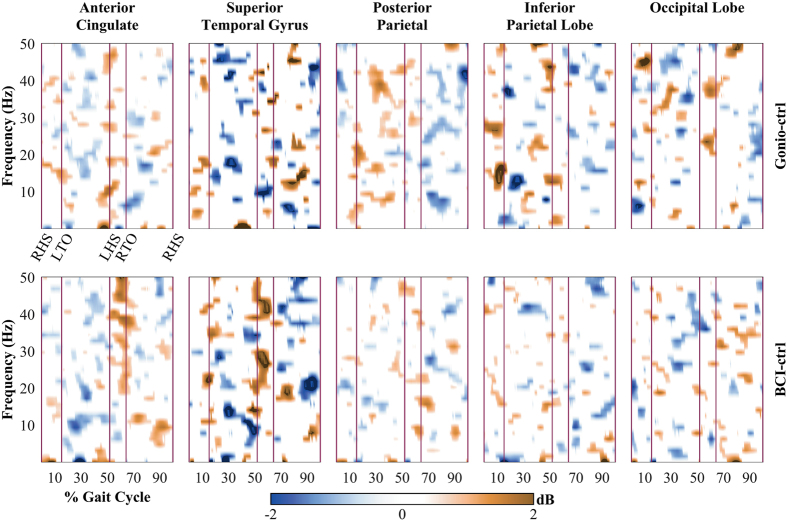
Recent advances in non-invasive brain-computer interface (BCI) technologies have shown the feasibility of neural decoding for both users’ gait intent and continuous kinematics. However, the dynamics of cortical involvement in human upright walking with a closed-loop BCI has not been investigated. This study aims to investigate the changes of cortical involvement in human treadmill walking with and without BCI control of a walking avatar. Source localization revealed significant differences in cortical network activity between walking with and without closed-loop BCI control. Our results showed sustained α/µ suppression in the Posterior Parietal Cortex and Inferior Parietal Lobe, indicating increases of cortical involvement during walking with BCI control. We also observed significant increased activity of the Anterior Cingulate Cortex (ACC) in the low frequency band suggesting the presence of a cortical network involved in error monitoring and motor learning. Additionally, the presence of low γ modulations in the ACC and Superior Temporal Gyrus may associate with increases of voluntary control of human gait. This work is a further step toward the development of a novel training paradigm for improving the efficacy of rehabilitation in a top-down approach.
Overview
The claims and statistics of this paper haven’t been checked yet.
Free: it reads the open-access text and checks the first 5 claims that cite a source we can check. Create a free account to check every claim.
Integrity signals
Registry
Cites
Statistics
Figures


Verification
Claims the paper makes
The claims and statistics of this paper haven’t been checked yet.
Free: it reads the open-access text and checks the first 5 claims that cite a source we can check. Create a free account to check every claim.
Claims other papers make about this one
Each is checked against this paper’s own text: does it say what the citing paper says it does?
The source backs part of the claim, not all of it — or backs it for a different population, condition or comparison.
In the citing paper
“Finally, speech decoders have yet to fully leverage paradigms of feedback-based learning that have the potential to entrain new patterns of neural activity for better control171–174.”
From The speech neuroprosthesis (2024) · cites this paper as [173]
Experimental — accuracy not yet measured
Self-check
Percentages, sums and reported differences re-computed from the paper’s own numbers.
The self-check needs the paper’s full text.
Citations
Cites
Delorme, A., & Makeig, S. (2004) · Journal of Neuroscience Methods · doi:10.1016/j.jneumeth.2003.10.009 · Cited by 24,371
Event-related EEG/MEG synchronization and desynchronization: basic principles
Pfurtscheller, G., & Lopes da Silva, F. H. (1999) · Clinical Neurophysiology · doi:10.1016/s1388-2457(99)00141-8 · Cited by 7,328
Frequency Dependence of Signal Power and Spatial Reach of the Local Field Potential
Leski, S., Lindén, H., Tetzlaff, T., Pettersen, K. H., & Einevoll, G. T. (2013) · PubMed · doi:10.18154/rwth-conv-084442 · Cited by 3,639
Automated Talairach Atlas labels for functional brain mapping
Lancaster, J. L., Woldorff, M. G., Parsons, L. M., Liotti, M., Freitas, C. S., Rainey, L., Kochunov, P. V., Nickerson, D., Mikiten, S. A., & Fox, P. T. (2000) · Human Brain Mapping · doi:10.1002/1097-0193(200007)10:3<120::aid-hbm30>3.0.co;2-8 · Cited by 3,387
Anterior Cingulate Cortex, Error Detection, and the Online Monitoring of Performance
Carter, C. S., Braver, T. S., Barch, D. M., Botvinick, M. M., Noll, D., & Cohen, J. D. (1998) · Science · doi:10.1126/science.280.5364.747 · Cited by 3,273
Beta-band oscillations—Signalling the status quo?
Engel, A. K., & Fries, P. (2010) · Current Opinion in Neurobiology · doi:10.1016/j.conb.2010.02.015 · Cited by 2,953
Anterior Cingulate Conflict Monitoring and Adjustments in Control
Kerns, J. G., Cohen, J. D., MacDonald, A. W., Cho, R. Y., Stenger, V. A., & Carter, C. S. (2004) · Science · doi:10.1126/science.1089910 · Cited by 2,891
Gevins, A. (1997) · Cerebral Cortex · doi:10.1093/cercor/7.4.374 · Cited by 1,623
Nonlinear dynamical analysis of EEG and MEG: Review of an emerging field
Stam, C. J. (2005) · Clinical Neurophysiology · doi:10.1016/j.clinph.2005.06.011 · Cited by 1,417
Wolff, P., & Barbey, A. K. (2015) · Frontiers in Human Neuroscience · doi:10.3389/fnhum.2015.00001 · Cited by 788
Research works printed but not linked: 1
- He, Y. et al. In 2014 36th Annual International Conference of the IEEE Engineering in Medicine and Biology Society 3985–3988 (IEEE, 2014).
Cited by
EEG-Based Brain-Computer Interfaces Using Motor-Imagery: Techniques and Challenges
Padfield, N., Zabalza, J., Zhao, H., Masero, V., & Ren, J. (2019) · Sensors · doi:10.3390/s19061423 · Cited by 596
Brain–machine interfaces for controlling lower-limb powered robotic systems
He, Y., Eguren, D., Azorín, J. M., Grossman, R. G., Luu, T. P., & Contreras-Vidal, J. L. (2018) · Journal of Neural Engineering · doi:10.1088/1741-2552/aaa8c0 · Cited by 224
Self-citationReal-Time EEG–EMG Human–Machine Interface-Based Control System for a Lower-Limb Exoskeleton
Gordleeva, S. Y., Lobov, S. A., Grigorev, N. A., Savosenkov, A. O., Shamshin, M. O., Lukoyanov, M. V., Khoruzhko, M. A., & Kazantsev, V. B. (2020) · IEEE Access · doi:10.1109/access.2020.2991812 · Cited by 174
EEG-Based Control for Upper and Lower Limb Exoskeletons and Prostheses: A Systematic Review
AL-Quraishi, M. S., Elamvazuthi, I., Daud, S. A., Parasuraman, S., & Borboni, A. (2018) · Sensors · doi:10.3390/s18103342 · Cited by 164
Peterson, S. M., & Ferris, D. P. (2018) · eNeuro · doi:10.1523/eneuro.0207-18.2018 · Cited by 160
Metadata
- Authors
- Luu, T. P., Nakagome, S., He, Y., & Contreras-Vidal, J. L.
- Affiliations
- University of Houston (US)
- Corresponding author
- Luu, Trieu Phat
- Venue
- Scientific Reports
- Published
- 2017-08-21
- Volume
- 7
- Issue
- 1
- Pages
- 8895-8895
- ISSN
- 2045-2322 (ISSN-L)
- PMC
- PMC5567182
- OpenAlex
- W2745687202
- Cited by
- 101
- References
- 62
- Citations by year
- 2026: 4 · 2025: 14 · 2024: 10 · 2023: 11 · 2022: 2 · 2021: 16 · 2020: 12 · 2019: 15 · 2018: 17
- FWCI
- 6.91
- Type
- journal article
- Language
- en
- Open access
- gold
- doi.org
- Licence
- cc-by
- creativecommons.org/licenses/by/4.0 (tdm)
- creativecommons.org/licenses/by/4.0 (vor)
- Locations
- Scientific Reports (publishedVersion, cc-by)
- PubMed Central (publishedVersion, cc-by)
- PubMed (publishedVersion)
- DOAJ (DOAJ: Directory of Open Access Journals) (submittedVersion, cc-by-sa)
- Funders
- National Institutes of Health
- National Institute of Neurological Disorders and Stroke (R01NS075889)
- Topics
- Life Sciences › Neuroscience › Cognitive Neuroscience › EEG and Brain-Computer Interfaces
- Health Sciences › Medicine › Rehabilitation › Stroke Rehabilitation and Recovery
- Physical Sciences › Engineering › Biomedical Engineering › Muscle activation and electromyography studies
- Keywords
- brain-computer interface, treadmill walking, avatars, cortical involvement, feedback control, source localization, posterior parietal cortex, inferior parietal lobule, anterior cingulate cortex, error monitoring, motor learning, gamma oscillations, gait rehabilitation, top-down control
- MeSH terms
- Adult, Biomechanical Phenomena, Brain Mapping, Cerebral Cortex, Computer Simulation, Electroencephalography, Exercise Test, Female, Humans, Male, Walking, Electrophysiological Phenomena, Young Adult, Brain Waves, Brain-Computer Interfaces
About these checks
Registry, retraction, Cites and statistics results are computed, not judged, with one exception: a printed reference that no index lists is read once by a model before it counts as a citation error. Claims are extracted by a model and kept only when their quote appears verbatim in the text; each cited source is then checked, with a model’s help, for whether it says what the claim relies on. Those verdicts can be wrong — read the claim’s quote and the cited source before relying on one.
Statistics and arithmetic are recomputed, not judged.
Confidence bands are shown only for fields calibrated on our annotated test set. None is calibrated yet, so no band is shown.
What counts as a claim ›How we measure confidence ›How we check this ›
Are you an author, or do you see a problem with this page? Request a review
How to cite
Cite CoChat for the checks on this page, and the paper for its own findings.
- This page
- CoChat. (2026). Citation check: Real-time EEG-based brain-computer interface to a virtual avatar enhances cortical involvement in human treadmill walking. https://app.cochat.ai/papers/10.1038/s41598-017-09187-0
- The paper
- Luu, T. P., Nakagome, S., He, Y., & Contreras-Vidal, J. L. (2017). Real-time EEG-based brain-computer interface to a virtual avatar enhances cortical involvement in human treadmill walking. Scientific Reports. https://doi.org/10.1038/s41598-017-09187-0
Data sources
Bibliographic data: Semantic Scholar, OpenAlex, Crossref.
Contains information from the Semantic Scholar Academic Graph Datasets, made available under the ODC Attribution License (ODC-BY 1.0).
Semantic Scholar’s data is described in: Kinney, R., et al. (2023). The Semantic Scholar Open Data Platform. arXiv:2301.10140.
