

The DOI matches its Crossref record; 4 of the 4 references it cites were found in a registry or an index.
Cardiovascular Function of Modern Pigs Does not Comply with Allometric Scaling Laws
Open accessAbstract
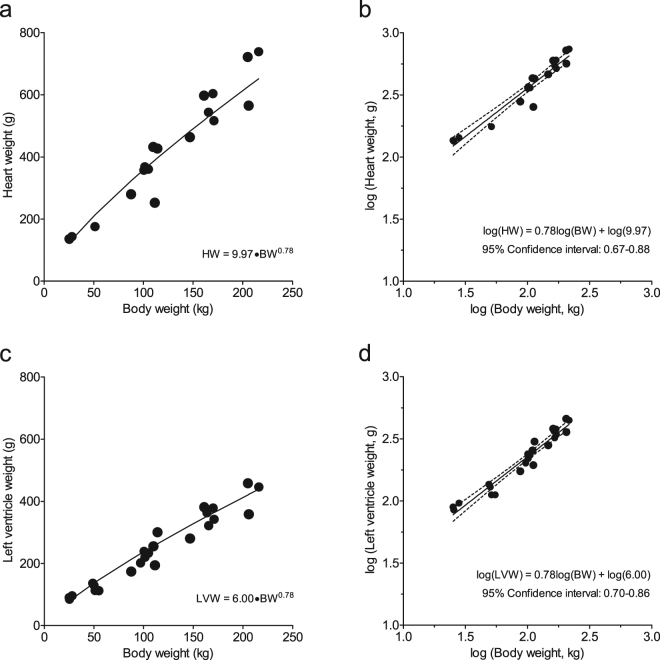
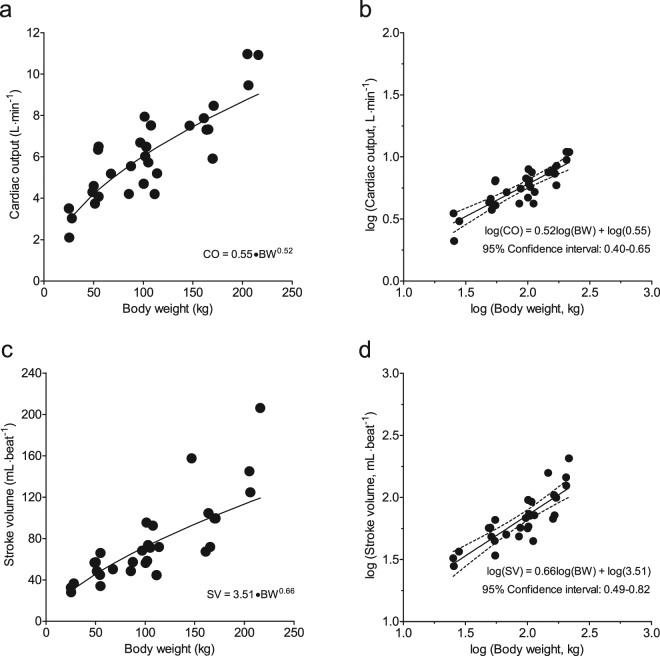
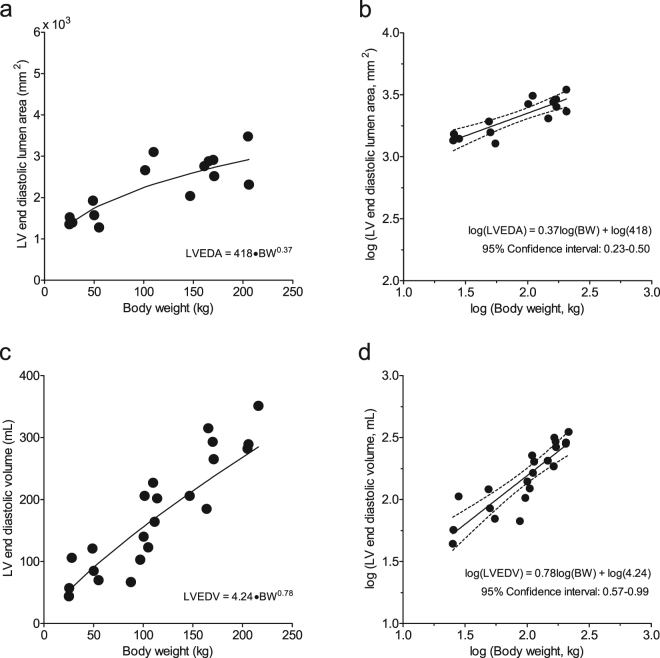
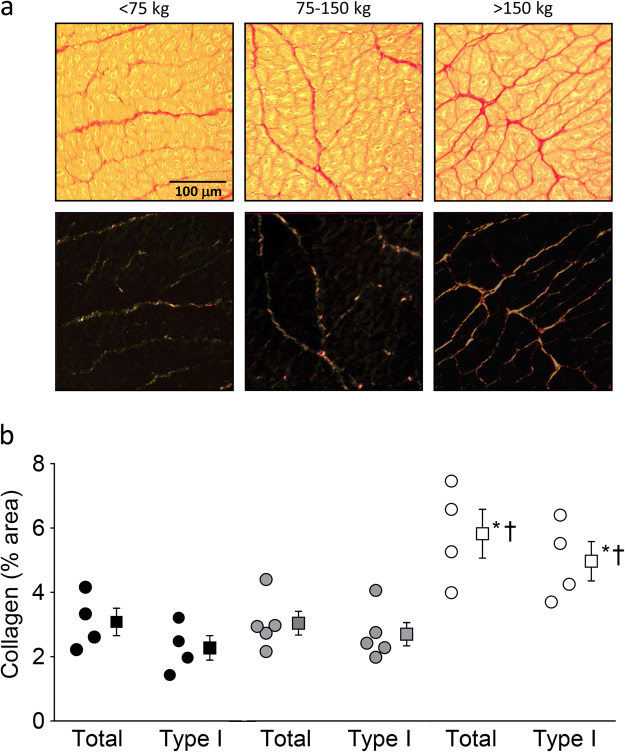
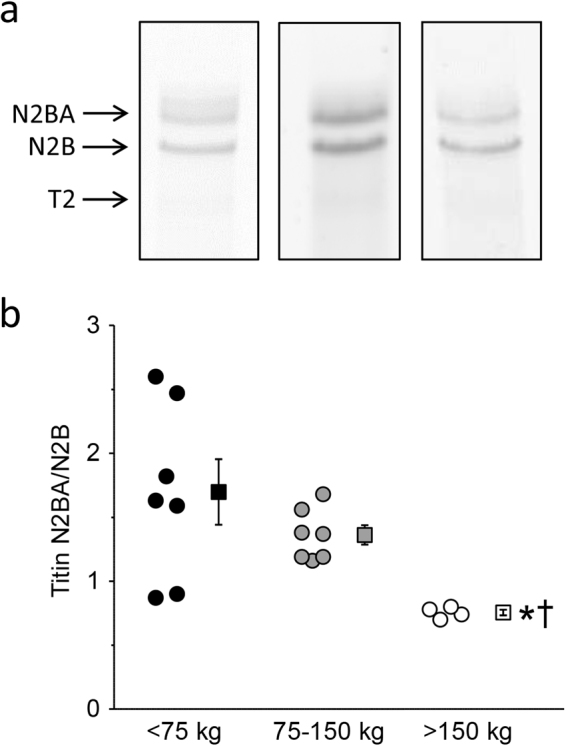
Growing concerns have been expressed regarding cardiovascular performance in modern farm pigs, which has been proposed as a critical factor contributing to the reduced adaptability of modern pigs to stress. Here we tested the hypothesis that cardiac dimensions and pump function in modern heavy farm pigs are disproportionally low for their body weight, and investigated potential underlying mechanisms. The results from the present study indeed demonstrate disproportionally low values for stroke volume and cardiac output in pigs with bodyweights over 150 kg. Importantly, these low values were not the result of impaired left ventricular (LV) systolic contractile function, but were due to a disproportionally small LV end-diastolic volume. The latter was associated with changes in determinants of LV passive stiffness, including (i) an increase in LV myocardial collagen, (ii) a shift from the compliant N2BA titin isoform towards the stiff N2B, and (iii) a marked elevation of aortic blood pressure. Taken together, these results demonstrate reduced pumping capacity of the hearts of heavy modern pigs, due to structural abnormalities in the LV myocardium.
Overview
The claims and statistics of this paper haven’t been checked yet.
Run the check — free, no account needed. It reads the open-access text and checks the sources it cites.
Integrity signals
Registry
Cites
Statistics
Figures
Verification
Claims the paper makes
The claims and statistics of this paper haven’t been checked yet.
Run the check — free, no account needed. It reads the open-access text and checks the sources it cites.
Claims other papers make about this one
Each is checked against this paper’s own text: does it say what the citing paper says it does?
The cited source says what the claim attributes to it.
In the citing paper
“van Essen et al. (2018) indicated that the cardiac output of the pigs was proportional to the 0.52nd power of the body mass.”
From A two-node mechanistic thermophysiological model for pigs reared in hot climates – Part 1: Physiological responses and model development (2021) · cites this paper as van Essen et al. (2018)
Self-check
Percentages, sums and reported differences re-computed from the paper’s own numbers.
The self-check needs the paper’s full text.
Citations
Cites
Kleiber, M. (1932) · Hilgardia · doi:10.3733/hilg.v06n11p315 · Cited by 2,222
Kleiber, M. (1947) · Physiological Reviews · doi:10.1152/physrev.1947.27.4.511 · Cited by 1,817
The Fourth Dimension of Life: Fractal Geometry and Allometric Scaling of Organisms
West, G. B., Brown, J. H., & Enquist, B. J. (1999) · Science · doi:10.1126/science.284.5420.1677 · Cited by 1,718
Differential expression of cardiac titin isoforms and modulation of cellular stiffness
Cazorla, O., Freiburg, A., Helmes, M., Centner, T., McNabb, M., Wu, Y., Trombitás, K., Labeit, S., & Granzier, H. (2000) · Circulation Research · doi:10.1161/01.res.86.1.59 · Cited by 418
Research works printed but not linked: 29
- Giuffra, E. et al. The origin of the domestic pig: independent domestication and subsequent introgression. Genetics 154, 1785–1791 (2000). · DOI
- Müller, E., Moser, G., Bartenslager, H. & Gelderman, H. Trait values of growth, carcass and meat quality in Wild Boar, Meishan and Piétrain pigs as well as their crossbred generations. J. Anim. Breed. Genet. 117, 189–202 (2000). · DOI
- Saunders, G. & McLeod, S. Predicting home range size from body mass or population densities of feral pigs, Sus scrofa (Artiodactyla: Suidae). Austral. Ecology 24, 538–543 (1999). · DOI
- Huisman, G. H. De bloedcirculatie van het varken. Tijdschr. Diergeneeskunde 94, 1428–1436 (1969).
- Niewold, T. A., van Essen, G. J., Nabuurs, M. J., Stockhofe-Zurwieden, N. & van der Meulen, J. A review of porcine pathophysiology: a different approach to disease. Vet. Q. 22, 209–212, https://doi.org/10.1080/01652176.2000.9695060 (2000). · DOI
- Holt, J. P., Rhode, E. A. & Kines, H. Ventricular volumes and body weight in mammals. Am. J. Physiol. 215, 704–715 (1968). · DOI
- West, G. B., Brown, J. H. & Enquist, B. J. A general model for the origin of allometric scaling laws in biology. Science 276, 122–126 (1997). · DOI · Paper page
- van Essen, G. J. et al. Does cardiovascular performance of modern fattening pigs obey allometric scaling laws? J. Anim. Sci. 87, 1991–1997, https://doi.org/10.2527/jas.2009-1860 (2009). · DOI
- van Essen, G. J. et al. Cardiovascular performance of adult breeding sows fails to obey allometric scaling laws. J. Anim. Sci. 89, 376–382, https://doi.org/10.2527/jas.2010-3059 (2011). · DOI
- West, G. B. & Brown, J. H. The origin of allometric scaling laws in biology from genomes to ecosystems: towards a quantitative unifying theory of biological structure and organization. J. Exp. Biol. 208, 1575–1592, https://doi.org/10.1242/jeb.01589 (2005). · DOI
- Rovira, S., Munoz, A. & Rodilla, V. Allometric scaling of echocardiographic measurements in healthy Spanish foals with different body weight. Res. Vet. Sci. 86, 325–331, https://doi.org/10.1016/j.rvsc.2008.08.001 (2009). · DOI
- Dawson, T. H. Allometric relations and scaling laws for the cardiovascular system of mammals. Systems 2, 168–185 (2014). · DOI
- Agutter, P. S. & Wheatley, D. N. Metabolic scaling: consensus or controversy? Theor. Biol. Med. Model. 1, 13, https://doi.org/10.1186/1742-4682-1-13 (2004). · DOI
- Dewey, F. E., Rosenthal, D., Murphy, D. J. Jr., Froelicher, V. F. & Ashley, E. A. Does size matter? Clinical applications of scaling cardiac size and function for body size. Circulation 117, 2279–2287, https://doi.org/10.1161/CIRCULATIONAHA.107.736785 (2008). · DOI
- Al-Haidar, A. et al. Effect of breed, sex, age and body weight on echocardiographic measurements in the equine species. Res. Vet. Sci. 95, 255–260, https://doi.org/10.1016/j.rvsc.2013.02.014 (2013). · DOI
- Martos, R. et al. Diastolic heart failure: evidence of increased myocardial collagen turnover linked to diastolic dysfunction. Circulation 115, 888–895, https://doi.org/10.1161/CIRCULATIONAHA.106.638569 (2007). · DOI
- Wu, Y. et al. Changes in titin isoform expression in pacing-induced cardiac failure give rise to increased passive muscle stiffness. Circulation 106, 1384–1389 (2002). · DOI
- Zile, M. R., Baicu, C. F. & Gaasch, W. H. Diastolic heart failure–abnormalities in active relaxation and passive stiffness of the left ventricle. N. Engl. J. Med. 350, 1953–1959, https://doi.org/10.1056/NEJMoa032566350/19/1953 (2004). · DOI
- Cliplef, R. L. & McKay, R. M. Visceral organ weights of swine selected for reduced backfat thickness and increased growth rate. Can. J. Anim. Sci. 73, 201–206 (1993). · DOI
- Yang, T. S. & Lin, J. H. Variation of heart size and its correlation with growth performance and vascular space in domestic pigs. Animal Science 64, 523–528 (1997). · DOI
- Sharma, S., Merghani, A. & Mont, L. Exercise and the heart: the good, the bad, and the ugly. Eur. Heart. J. 36, 1445–1453, https://doi.org/10.1093/eurheartj/ehv090 (2015). · DOI · Paper page
- Booth, F. W., Roberts, C. K., Thyfault, J. P., Ruegsegger, G. N. & Toedebusch, R. G. Role of Inactivity in Chronic Diseases: Evolutionary Insight and Pathophysiological Mechanisms. Physiol Rev 97, 1351–1402, https://doi.org/10.1152/physrev.00019.2016 (2017). · DOI · Paper page
- Bhella, P. S. et al. Impact of lifelong exercise “dose” on left ventricular compliance and distensibility. J. Am. Coll. Cardiol. 64, 1257–1266, https://doi.org/10.1016/j.jacc.2014.03.062 S0735-1097(14)04546-X (2014). · DOI
- Booth, J. N. et al. Reduced physical activity in adults at risk for type 2 diabetes who curtail their sleep. Obesity (Silver Spring) 20, 278–284, https://doi.org/10.1038/oby.2011.306 (2012). · DOI
- Aune, D. et al. Body Mass Index, Abdominal Fatness, and Heart Failure Incidence and Mortality: A Systematic Review and Dose-Response Meta-Analysis of Prospective Studies. Circulation 133, 639–649, https://doi.org/10.1161/CIRCULATIONAHA.115.016801 (2016). · DOI
- Sorop, O. et al. Functional and structural adaptations of coronary microvessels distal to a chronic coronary artery stenosis. Circ. Res. 102, 795–803, https://doi.org/10.1161/CIRCRESAHA.108.172528 (2008). · DOI
- Duncker, D. J. et al. Prevention of myofilament dysfunction by beta-blocker therapy in postinfarct remodeling. Circ. Heart Fail. 2, 233–242, https://doi.org/10.1161/CIRCHEARTFAILURE.108.806125 (2009). · DOI
- Schipke, J. et al. Assessment of cardiac fibrosis: a morphometric method comparison for collagen quantification. J Appl Physiol (1985) 122, 1019–1030, https://doi.org/10.1152/japplphysiol.00987.2016 (2017). · DOI
- Warren, C. M., Krzesinski, P. R. & Greaser, M. L. Vertical agarose gel electrophoresis and electroblotting of high-molecular-weight proteins. Electrophoresis 24, 1695–1702, https://doi.org/10.1002/elps.200305392 (2003). · DOI
Cited by
Sorted by citations
Huang, T., Rong, L., Zhang, G., Brandt, P., Bjerg, B., Pedersen, P., & Granath, S. W. Y. (2021) · Biosystems Engineering · doi:10.1016/j.biosystemseng.2021.08.024 · Cited by 13
Metadata
- Authors
- van Essen, G. J., te Lintel Hekkert, M., Sorop, O., Heinonen, I., van der Velden, J., Merkus, D., & Duncker, D. J.
- Affiliations
- Erasmus MC (NL)
- University of Turku (FI)
- Netherlands Heart Institute (NL)
- Corresponding author
- Duncker, Dirk J.
- Venue
- Scientific Reports
- Published
- 2018-01-15
- Volume
- 8
- Issue
- 1
- Pages
- 792-792
- ISSN
- 2045-2322 (ISSN-L)
- PMC
- PMC5768797
- OpenAlex
- W2783442741
- Cited by
- 41
- References
- 4
- Citations by year
- 2025: 6 · 2024: 7 · 2023: 8 · 2022: 5 · 2021: 6 · 2020: 6 · 2019: 3
- FWCI
- 2.84
- Type
- journal article
- Language
- en
- Open access
- gold
- doi.org
- Locations
- Scientific Reports (publishedVersion, cc-by)
- PubMed Central (publishedVersion, cc-by)
- PubMed (publishedVersion)
- Pure Amsterdam UMC (publishedVersion, cc-by)
- EUR Research Repository (Erasmus University Rotterdam) (publishedVersion, other-oa)
- UTUPub (University of Turku) (submittedVersion)
- EUR Research Repository (Erasmus University Rotterdam) (submittedVersion, other-oa)
- RePub (Erasmus University Rotterdam) (submittedVersion, other-oa)
- DOAJ (DOAJ: Directory of Open Access Journals) (submittedVersion)
- Data Archiving and Networked Services (DANS) (submittedVersion, other-oa)
- Funders
- Foundation for Cardiovascular Research
- European Commission (FP7-Health- 2010, 261409)
- Sydäntutkimussäätiö
- Topics
- Health Sciences › Medicine › Cardiology and Cardiovascular Medicine › Cardiovascular Function and Risk Factors
- Health Sciences › Medicine › Cardiology and Cardiovascular Medicine › Cardiomyopathy and Myosin Studies
- Health Sciences › Medicine › Cardiology and Cardiovascular Medicine › Cardiac Fibrosis and Remodeling
- Keywords
- farm pigs, cardiovascular function, allometric scaling, stroke volume, cardiac output, left ventricular end-diastolic volume, myocardial collagen, titin isoforms, aortic pressure, heavy pigs, stress adaptability, cardiac pump function
- MeSH terms
- Animals, Blood Pressure, Body Weight, Collagen, Heart Ventricles, Myocardium, Swine, Ventricular Function, Left, Protein Isoforms, Connectin
About these checks
Registry, retraction, Cites and statistics results are computed, not judged, with one exception: a printed reference that no index lists is read once by a model before it counts as a citation error. Claims are extracted by a model and kept only when their quote appears verbatim in the text; each cited source is then checked, with a model’s help, for whether it says what the claim relies on. Those verdicts can be wrong — read the claim’s quote and the cited source before relying on one.
Statistics and arithmetic are recomputed, not judged.
Confidence bands are shown only for fields calibrated on our annotated test set. None is calibrated yet, so no band is shown.
What counts as a claim ›How we measure confidence ›How we check this ›
Are you an author, or do you see a problem with this page? Request a review
