

The DOI matches its Crossref record; 77 of the 77 references it cites were found in a registry or an index.
An integrated flow cytometry-based platform for isolation and molecular characterization of circulating tumor single cells and clusters
Open accessAbstract
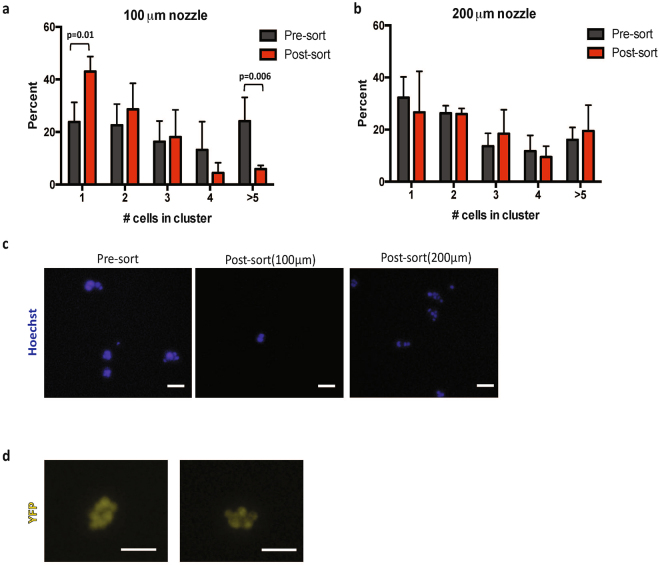
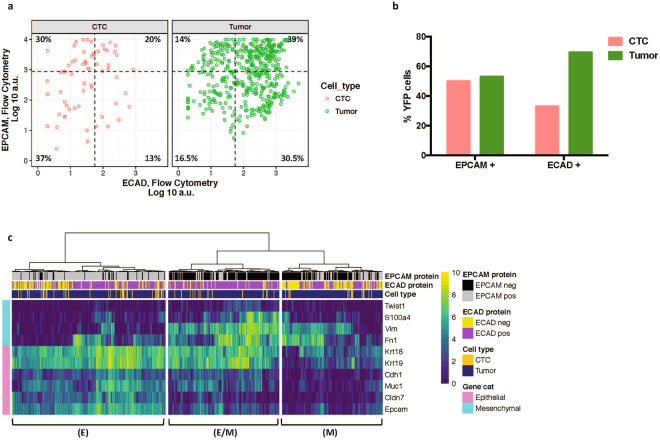
Comprehensive molecular analysis of rare circulating tumor cells (CTCs) and cell clusters is often hampered by low throughput and purity, as well as cell loss. To address this, we developed a fully integrated platform for flow cytometry-based isolation of CTCs and clusters from blood that can be combined with whole transcriptome analysis or targeted RNA transcript quantification. Downstream molecular signature can be linked to cell phenotype through index sorting. This newly developed platform utilizes in-line magnetic particle-based leukocyte depletion, and acoustic cell focusing and washing to achieve >98% reduction of blood cells and non-cellular debris, along with >1.5 log-fold enrichment of spiked tumor cells. We could also detect 1 spiked-in tumor cell in 1 million WBCs in 4/7 replicates. Importantly, the use of a large 200μm nozzle and low sheath pressure (3.5 psi) minimized shear forces, thereby maintaining cell viability and integrity while allowing for simultaneous recovery of single cells and clusters from blood. As proof of principle, we isolated and transcriptionally characterized 63 single CTCs from a genetically engineered pancreatic cancer mouse model (n = 12 mice) and, using index sorting, were able to identify distinct epithelial and mesenchymal sub-populations based on linked single cell protein and gene expression.
Overview
The claims and statistics of this paper haven’t been checked yet.
Run the check — free, no account needed. It reads the open-access text and checks the sources it cites.
Integrity signals
Registry
Cites
Statistics
Figures




Verification
Claims the paper makes
The claims and statistics of this paper haven’t been checked yet.
Run the check — free, no account needed. It reads the open-access text and checks the sources it cites.
Self-check
Percentages, sums and reported differences re-computed from the paper’s own numbers.
The self-check needs the paper’s full text.
Citations
Cites
R: A Language and Environment for Statistical Computing
R Core Team (2025) · doi:10.32614/r.manuals · Cited by 352,181
STAR: ultrafast universal RNA-seq aligner
Dobin, A., Davis, C. A., Schlesinger, F., Drenkow, J., Zaleski, C., Jha, S., Batut, P., Chaisson, M., & Gingeras, T. R. (2013) · Bioinformatics · doi:10.1093/bioinformatics/bts635 · Cited by 51,709
(2008) · Journal of Machine Learning Research · Cited by 33,051
featureCounts: an efficient general purpose program for assigning sequence reads to genomic features
Liao, Y., Smyth, G. K., & Shi, W. (2014) · Bioinformatics · doi:10.1093/bioinformatics/btt656 · Cited by 27,219
The consensus molecular subtypes of colorectal cancer
Guinney, J., Dienstmann, R., Wang, X., de Reyniès, A., Schlicker, A., Soneson, C., Marisa, L., Roepman, P., Nyamundanda, G., Angelino, P., et al. (2015) · Nature Medicine · doi:10.1038/nm.3967 · Cited by 5,170
Circulating Tumor Cells, Disease Progression, and Survival in Metastatic Breast Cancer
Cristofanilli, M., Budd, G. T., Ellis, M. J., Stopeck, A., Matera, J., Miller, M. C., Reuben, J. M., Doyle, G. V., Allard, W. J., Terstappen, L. W. M. M., et al. (2004) · New England Journal of Medicine · doi:10.1056/nejmoa040766 · Cited by 4,593
Cancer Metastasis: Building a Framework
Gupta, G. P., & Massagué, J. (2006) · Cell · doi:10.1016/j.cell.2006.11.001 · Cited by 4,247
Genomic analyses identify molecular subtypes of pancreatic cancer
Bailey, P., Chang, D. K., Nones, K., Johns, A. L., Patch, A.-M., Gingras, M.-C., Miller, D. K., Christ, A. N., Bruxner, T. J. C., Quinn, M. C., et al. (2016) · Nature · doi:10.1038/nature16965 · Cited by 3,621
Chimeric Antigen Receptor–Modified T Cells for Acute Lymphoid Leukemia
Grupp, S. A., Kalos, M., Barrett, D., Aplenc, R., Porter, D. L., Rheingold, S. R., Teachey, D. T., Chew, A., Hauck, B., Wright, J. F., et al. (2013) · New England Journal of Medicine · doi:10.1056/nejmoa1215134 · Cited by 3,509
AR-V7 and Resistance to Enzalutamide and Abiraterone in Prostate Cancer
Antonarakis, E. S., Lu, C., Wang, H., Luber, B., Nakazawa, M., Roeser, J. C., Chen, Y., Mohammad, T. A., Chen, Y., Fedor, H. L., et al. (2014) · New England Journal of Medicine · doi:10.1056/nejmoa1315815 · Cited by 2,710
Cited by
Tumor microenvironment complexity and therapeutic implications at a glance
Baghban, R., Roshangar, L., Jahanban-Esfahlan, R., Seidi, K., Ebrahimi-Kalan, A., Jaymand, M., Kolahian, S., Javaheri, T., & Zare, P. (2020) · Cell Communication and Signaling · doi:10.1186/s12964-020-0530-4 · Cited by 1,784
“Circulating/cell-free DNA (cfDNA), a cell-free nucleic acid, is produced from dead, necrotic and living eukaryotic cells [192].”
BackgroundLiquid biopsy and minimal residual disease - latest advances and implications for cure
Pantel, K., & Alix-Panabières, C. (2019) · Nature Reviews Clinical Oncology · doi:10.1038/s41571-019-0187-3 · Cited by 1,110
Tavakoli, H., Zhou, W., Ma, L., Perez, S., Ibarra, A., Xu, F., Zhan, S., & Li, X. (2019) · TrAC Trends in Analytical Chemistry · doi:10.1016/j.trac.2019.05.010 · Cited by 172
Liquid Biopsies, Novel Approaches and Future Directions
Armakolas, A., Kotsari, M., & Koskinas, J. S. (2023) · Cancers · doi:10.3390/cancers15051579 · Cited by 156
Multiphysics microfluidics for cell manipulation and separation: a review
Cha, H., Fallahi, H., Dai, Y., Yuan, D., An, H., Nguyen, N., & Zhang, J. (2021) · Lab on a Chip · doi:10.1039/d1lc00869b · Cited by 129
Metadata
- Authors
- Bhagwat, N., Dulmage, K., Pletcher, C. H., Wang, L., DeMuth, W., Sen, M., Balli, D., Yee, S. S., Sa, S., Tong, F., Yu, L., Moore, J. S., Stanger, B. Z., Dixon, E. P., & Carpenter, E. L.
- Affiliations
- University of Pennsylvania (US)
- BD Technologie (United States) (US)
- BD Biosciences (United States) (US)
- Corresponding author
- Carpenter, Erica L.
- ORCID
- Venue
- Scientific Reports
- Published
- 2018-03-22
- Volume
- 8
- Issue
- 1
- Pages
- 5035-5035
- ISSN
- 2045-2322 (ISSN-L)
- PMC
- PMC5864750
- OpenAlex
- W2806640008
- Cited by
- 75
- References
- 76
- Citations by year
- 2026: 2 · 2025: 6 · 2024: 5 · 2023: 17 · 2022: 7 · 2021: 7 · 2020: 15 · 2019: 11 · 2018: 5
- FWCI
- 3.80
- Type
- journal article
- Language
- en
- Open access
- gold
- doi.org
- Licence
- cc-by
- creativecommons.org/licenses/by/4.0 (tdm)
- creativecommons.org/licenses/by/4.0 (vor)
- Locations
- Scientific Reports (publishedVersion, cc-by)
- Europe PMC (PubMed Central) (publishedVersion, cc-by)
- PubMed Central (publishedVersion, cc-by)
- PubMed (publishedVersion)
- DOAJ (DOAJ: Directory of Open Access Journals) (submittedVersion)
- Funders
- University of Pennsylvania (P30CA016520)
- Abramson Cancer Center (P30CA016520)
- National Cancer Institute (CA016520, R01CA207643, P30CA016520)
- Topics
- Physical Sciences › Engineering › Biomedical Engineering › Microfluidic and Bio-sensing Technologies
- Life Sciences › Biochemistry, Genetics and Molecular Biology › Cancer Research › Cancer Genomics and Diagnostics
- Health Sciences › Medicine › Oncology › Cancer Cells and Metastasis
- Keywords
- circulating tumor cells, tumor cell clusters, whole transcriptome analysis, single-cell transcriptomics, pancreatic cancer, rare cell enrichment
- MeSH terms
- Liquid Biopsy, Animals, Cell Separation, Disease Models, Animal, Flow Cytometry, Humans, Neoplastic Cells, Circulating, Pancreatic Neoplasms, Gene Expression Profiling, Cell Line, Tumor, Leukocyte Reduction Procedures, Mice, Single-Cell Analysis, Magnets
About these checks
Registry, retraction, Cites and statistics results are computed, not judged, with one exception: a printed reference that no index lists is read once by a model before it counts as a citation error. Claims are extracted by a model and kept only when their quote appears verbatim in the text; each cited source is then checked, with a model’s help, for whether it says what the claim relies on. Those verdicts can be wrong — read the claim’s quote and the cited source before relying on one.
Statistics and arithmetic are recomputed, not judged.
Confidence bands are shown only for fields calibrated on our annotated test set. None is calibrated yet, so no band is shown.
What counts as a claim ›How we measure confidence ›How we check this ›
Are you an author, or do you see a problem with this page? Request a review
How to cite
Cite CoChat for the checks on this page, and the paper for its own findings.
- This page
- CoChat. (2026). Citation check: An integrated flow cytometry-based platform for isolation and molecular characterization of circulating tumor single cells and clusters. https://app.cochat.ai/papers/10.1038/s41598-018-23217-5
- The paper
- Bhagwat, N., Dulmage, K., Pletcher, C. H., Wang, L., DeMuth, W., Sen, M., Balli, D., Yee, S. S., Sa, S., Tong, F., Yu, L., Moore, J. S., Stanger, B. Z., Dixon, E. P., & Carpenter, E. L. (2018). An integrated flow cytometry-based platform for isolation and molecular characterization of circulating tumor single cells and clusters. Scientific Reports. https://doi.org/10.1038/s41598-018-23217-5
Data sources
Bibliographic data: Semantic Scholar, OpenAlex, Crossref.
Contains information from the Semantic Scholar Academic Graph Datasets, made available under the ODC Attribution License (ODC-BY 1.0).
Semantic Scholar’s data is described in: Kinney, R., et al. (2023). The Semantic Scholar Open Data Platform. arXiv:2301.10140.
