Cited by 1223D Printing in Biomedical ResearchLiver physiology and pathologyDrug-Induced Hepatotoxicity and Protection

The DOI matches its Crossref record; 60 of the 60 references it cites were found in a registry or an index.

Metabolic Patterning on a Chip: Towards in vitro Liver Zonation of Primary Rat and Human Hepatocytes

Open access

Abstract

An important number of healthy and diseased tissues shows spatial variations in their metabolic capacities across the tissue. The liver is a prime example of such heterogeneity where the gradual changes in various metabolic activities across the liver sinusoid is termed as “zonation” of the liver. Here, we introduce the Metabolic Patterning on a Chip (MPOC) platform capable of dynamically creating metabolic patterns across the length of a microchamber of liver tissue via actively enforced gradients of various metabolic modulators such as hormones and inducers. Using this platform, we were able to create continuous liver tissues of both rat and human origin with gradually changing metabolic activities. The gradients we have created in nitrogen, carbohydrate and xenobiotic metabolisms recapitulated an in vivo like zonation and zonal toxic response. Beyond its application in recapitulation of liver zonation in vitro as we demonstrate here, the MPOC platform can be used and expanded for a variety of purposes including better understanding of heterogeneity in many different tissues during developmental and adult stages.

Overview

The claims and statistics of this paper haven’t been checked yet.

Run the check — free, no account needed. It reads the open-access text and checks the sources it cites.

A few free checks a day · papers already verified open instantly · results are public

Integrity signals

Registry

Crossref · 10.1038/s41598-018-27179-6

Cites

60 of 60 references verified0 citation errors · 0 not checkable

Statistics

Figures

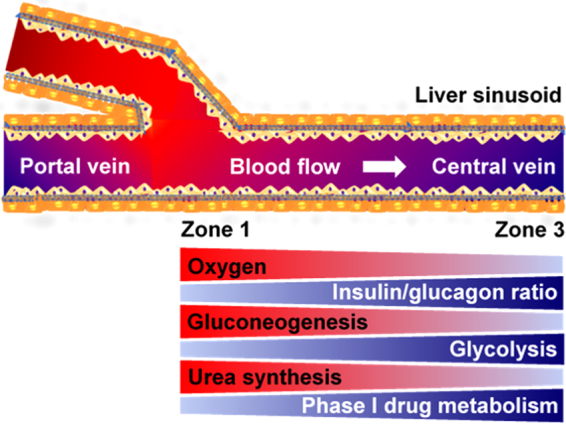
Figure 1 Liver zonation overview. Hepatocytes, which play a predominant role in various metabolisms in the liver, show a remarkable heterogeneity across the liver sinusoid in terms of morphology and metabolism known as liver metabolic zonation. Hepatocytes in Zone 1 where oxygen-rich blood from hepatic artery blends with nutrient-rich blood from portal vein have high activities in oxygen-related metabolism, gluconeogenesis, urea synthesis, and ammonia detoxification. In contrast, hepatocytes in Zone 3 where the concentration of oxygen and hormone ratio (glucagon to insulin ratio) are low around the central vein, have high activities in glycolysis and phase 1 drug metabolism.
Figure 1 Liver zonation overview. Hepatocytes, which play a predominant role in various metabolisms in the liver, show a remarkable heterogeneity across the liver sinusoid in terms of morphology and metabolism known as liver metabolic zonation. Hepatocytes in Zone 1 where oxygen-rich blood from hepatic artery blends with nutrient-rich blood from portal vein have high activities in oxygen-related metabolism, gluconeogenesis, urea synthesis, and ammonia detoxification. In contrast, hepatocytes in Zone 3 where the concentration of oxygen and hormone ratio (glucagon to insulin ratio) are low around the central vein, have high activities in glycolysis and phase 1 drug metabolism.CC BY · PubMed Central
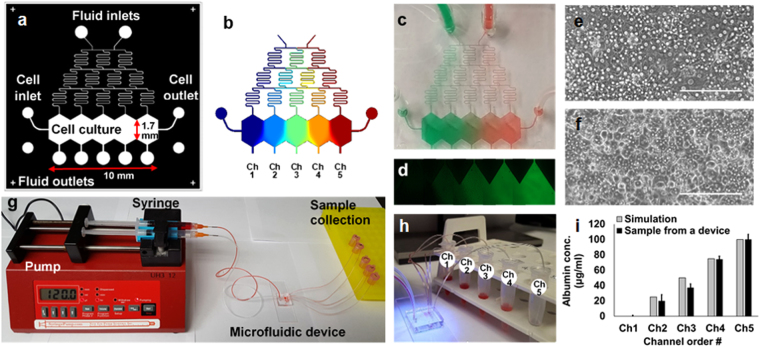
Figure 2 The “Metabolic Patterning on a Chip” (MPOC) platform. (a) Drawing of a microfluidic device with a gradient generator. (b) A gradient of concentration simulated by COMSOL® Multiphysics. A gradient of (c) food dye and (d) fluorescein in the microfluidic device. Cell morphology of primary (e) rat and (f) human hepatocytes in the microfluidic device at day 1. Scale bar: 200 µm. (g) Continuous perfusion system with a syringe pump, a microfluidic device, and sample collection. (h) A sample collection from the device. (i) We collected media samples from each outlet of five channels, which was connected to a 1.5 ml collection tube via a Tygon tubing, after generating a gradient of bovine serum albumin (BSA, one inlet: 0 µg/mL BSA in PBS and the other inlet: 100 µg/mL BSA in PBS) under cell-free condition. BSA concentration levels of samples were measured as approximately 0, 20, 37, 74, and 100 µg/mL, respectively, using Pierce BCA protein assay kit (23227, Thermofisher Scientific) by spectrophotometer (Biorad) (ANOVA n = 3, p < 0.05). These outcomes were similar to those simulated by COMSOL® Multiphysics.
Figure 2 The “Metabolic Patterning on a Chip” (MPOC) platform. (a) Drawing of a microfluidic device with a gradient generator. (b) A gradient of concentration simulated by COMSOL® Multiphysics. A gradient of (c) food dye and (d) fluorescein in the microfluidic device. Cell morphology of primary (e) rat and (f) human hepatocytes in the microfluidic device at day 1. Scale bar: 200 µm. (g) Continuous perfusion system with a syringe pump, a microfluidic device, and sample collection. (h) A sample collection from the device. (i) We collected media samples from each outlet of five channels, which was connected to a 1.5 ml collection tube via a Tygon tubing, after generating a gradient of bovine serum albumin (BSA, one inlet: 0 µg/mL BSA in PBS and the other inlet: 100 µg/mL BSA in PBS) under cell-free condition. BSA concentration levels of samples were measured as approximately 0, 20, 37, 74, and 100 µg/mL, respectively, using Pierce BCA protein assay kit (23227, Thermofisher Scientific) by spectrophotometer (Biorad) (ANOVA n = 3, p < 0.05). These outcomes were similar to those simulated by COMSOL® Multiphysics.CC BY · PubMed Central
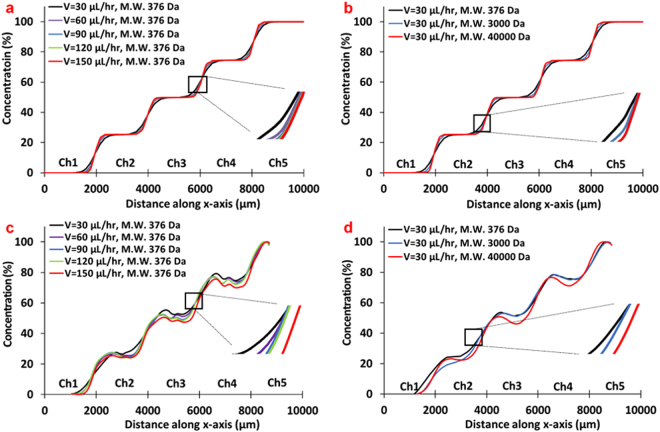
Figure 3 The characterization of gradient generation in the MPOC platform. The effect of (a) flow rate and (b) diffusion coefficients at a flow rate of 30 µL/hr on a gradient profile by COMSOL® Multiphysics. The effect of (c) a flow rate and (d) diffusion coefficients at a flow rate of 30 µL/hr on a gradient profile by an experiment using fluorescently-labeled solution with different molecular weight (n = 3, standard error of the mean (SEM) <±7.0).
Figure 3 The characterization of gradient generation in the MPOC platform. The effect of (a) flow rate and (b) diffusion coefficients at a flow rate of 30 µL/hr on a gradient profile by COMSOL® Multiphysics. The effect of (c) a flow rate and (d) diffusion coefficients at a flow rate of 30 µL/hr on a gradient profile by an experiment using fluorescently-labeled solution with different molecular weight (n = 3, standard error of the mean (SEM) <±7.0).CC BY · PubMed Central
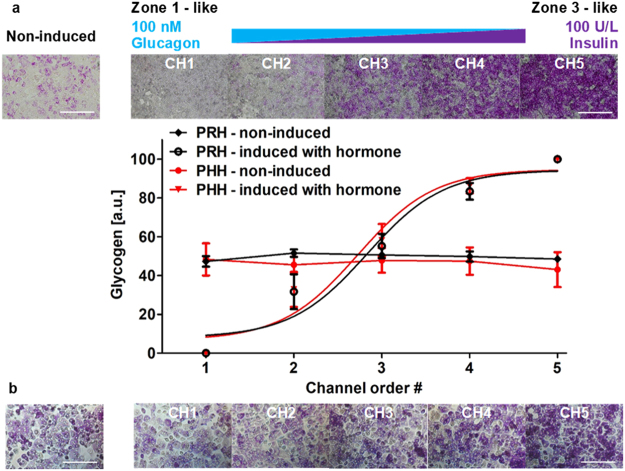
Figure 4 Zonation of primary (a) rat and (b) human hepatocytes in carbohydrate metabolism in the MPOC platform. Hepatocytes induced with a hormonal gradient (one inlet: 100 nM glucagon, 0 U/L insulin and the other inlet: 0 nM glucagon, 100 U/L insulin) at a flow rate of 120 µL/hr produced a zonation of glycogen across the width of the device. Image quantification for PAS staining of glycogen was analyzed by using Image J. (a) All data met p < 0.05 except that non-induced vs ch2, non-induced vs ch3, and ch4 vs ch5 are not significant (ANOVA n = 4, Tukey’s test). (b) All data met p < 0.05 except that non-induced vs ch2, non-induced vs ch3, ch2 vs ch3, and ch4 vs ch5 are not significant (ANOVA n = 4, Tukey’s test). Each experiment was replicated using at least three different devices. Scale bar: 400 µm.
Figure 4 Zonation of primary (a) rat and (b) human hepatocytes in carbohydrate metabolism in the MPOC platform. Hepatocytes induced with a hormonal gradient (one inlet: 100 nM glucagon, 0 U/L insulin and the other inlet: 0 nM glucagon, 100 U/L insulin) at a flow rate of 120 µL/hr produced a zonation of glycogen across the width of the device. Image quantification for PAS staining of glycogen was analyzed by using Image J. (a) All data met p < 0.05 except that non-induced vs ch2, non-induced vs ch3, and ch4 vs ch5 are not significant (ANOVA n = 4, Tukey’s test). (b) All data met p < 0.05 except that non-induced vs ch2, non-induced vs ch3, ch2 vs ch3, and ch4 vs ch5 are not significant (ANOVA n = 4, Tukey’s test). Each experiment was replicated using at least three different devices. Scale bar: 400 µm.CC BY · PubMed Central
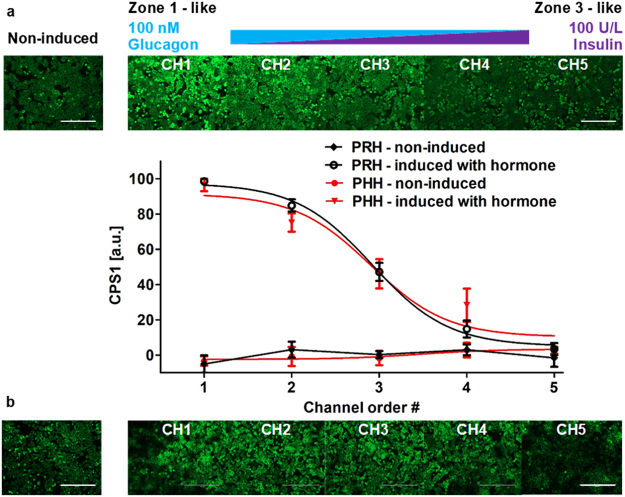
Figure 5 Zonation of primary (a) rat and (b) human hepatocytes in nitrogen metabolism in the MPOC platform. Hepatocytes induced with a hormonal gradient (one inlet: 100 nM glucagon, 0 U/L insulin and the other inlet: 0 nM glucagon, 100 U/L insulin) at a flow rate of 120 µL/hr displayed a descending CPS1 expression level along with the width of the device. Image quantification of CPS1 staining in hepatocytes induced by a gradient of the insulin-to-glucagon ratio indicated a descending profile of CPS1 expression level which demonstrates nitrogen metabolism. (a) All data met p < 0.05 except that non-induced vs ch4, non-induced vs ch5, ch1 vs ch2, and ch4 vs ch5 are not significant (ANOVA n = 4, Tukey’s test). (b) All data met p < 0.05 except that non-induced vs ch5, ch1 vs ch2, and ch3 vs ch4 are not significant (ANOVA n = 6, Tukey’s test). Each experiment was replicated using at least three different cell pools. Scale bar: 400 µm.
Figure 5 Zonation of primary (a) rat and (b) human hepatocytes in nitrogen metabolism in the MPOC platform. Hepatocytes induced with a hormonal gradient (one inlet: 100 nM glucagon, 0 U/L insulin and the other inlet: 0 nM glucagon, 100 U/L insulin) at a flow rate of 120 µL/hr displayed a descending CPS1 expression level along with the width of the device. Image quantification of CPS1 staining in hepatocytes induced by a gradient of the insulin-to-glucagon ratio indicated a descending profile of CPS1 expression level which demonstrates nitrogen metabolism. (a) All data met p < 0.05 except that non-induced vs ch4, non-induced vs ch5, ch1 vs ch2, and ch4 vs ch5 are not significant (ANOVA n = 4, Tukey’s test). (b) All data met p < 0.05 except that non-induced vs ch5, ch1 vs ch2, and ch3 vs ch4 are not significant (ANOVA n = 6, Tukey’s test). Each experiment was replicated using at least three different cell pools. Scale bar: 400 µm.CC BY · PubMed Central
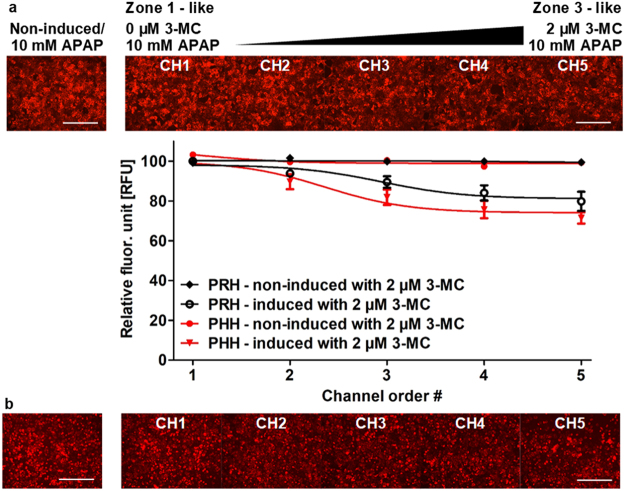
Figure 6 Zonation of primary (a) rat and (b) human hepatocytes in drug-induced liver toxicity in the MPOC platform. After 24 hours induction with a gradient of 3-MC (one inlet: 0 μM 3-MC and the other inlet: 2 μM 3-MC) at a flow rate of 120 µL/hr, cells were uniformly exposed to a dose of 10 mM acetaminophen (APAP) for 4 hours. Cells were stained with TMRM. The non-induced hepatocytes remained viable while the 3-MC induced hepatocytes relatively lost their viability. The gradient of the acetaminophen-related hepatotoxicity was demonstrated by checking cell viability in CYP activity-dependent response to acetaminophen dose. A gradient of cell viability across the width of the device was estimated through quantification of viability using Image J. (a) All data met p < 0.05 except that non-induced vs ch1, non-induced vs ch2, non-induced vs ch3, ch1 vs ch2, ch1 vs ch3, ch2 vs ch3, ch2 vs ch4, ch3 vs ch4, ch3 vs ch5, and ch4 vs ch5 are not significant (ANOVA n = 5, Tukey’s test). (b) All data met p < 0.05 except that non-induced vs ch1, non-induced vs ch2, ch1 vs ch2, ch2 vs ch3, ch3 vs ch4, ch3 vs ch5, and ch4 vs ch5 are not significant (ANOVA n = 4, Tukey’s test). Each experiment was replicated using at least three different cell pools. Scale bar: 400 µm.
Figure 6 Zonation of primary (a) rat and (b) human hepatocytes in drug-induced liver toxicity in the MPOC platform. After 24 hours induction with a gradient of 3-MC (one inlet: 0 μM 3-MC and the other inlet: 2 μM 3-MC) at a flow rate of 120 µL/hr, cells were uniformly exposed to a dose of 10 mM acetaminophen (APAP) for 4 hours. Cells were stained with TMRM. The non-induced hepatocytes remained viable while the 3-MC induced hepatocytes relatively lost their viability. The gradient of the acetaminophen-related hepatotoxicity was demonstrated by checking cell viability in CYP activity-dependent response to acetaminophen dose. A gradient of cell viability across the width of the device was estimated through quantification of viability using Image J. (a) All data met p < 0.05 except that non-induced vs ch1, non-induced vs ch2, non-induced vs ch3, ch1 vs ch2, ch1 vs ch3, ch2 vs ch3, ch2 vs ch4, ch3 vs ch4, ch3 vs ch5, and ch4 vs ch5 are not significant (ANOVA n = 5, Tukey’s test). (b) All data met p < 0.05 except that non-induced vs ch1, non-induced vs ch2, ch1 vs ch2, ch2 vs ch3, ch3 vs ch4, ch3 vs ch5, and ch4 vs ch5 are not significant (ANOVA n = 4, Tukey’s test). Each experiment was replicated using at least three different cell pools. Scale bar: 400 µm.CC BY · PubMed Central
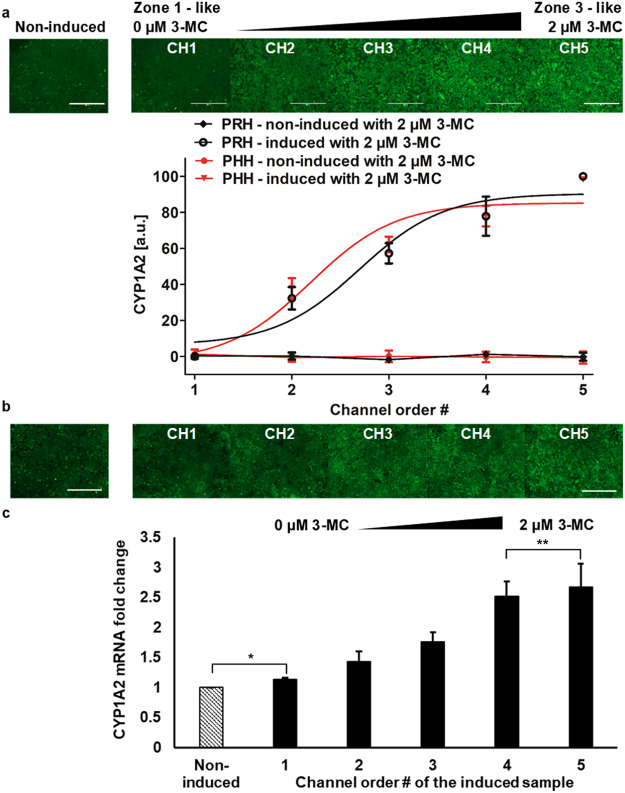
Figure 7 Differential expression of drug metabolic enzymes of primary (a) rat and (b,c) human hepatocytes in the MPOC platform. Hepatocytes cultured in the device were induced with a gradient of 3-MC (one inlet: 0 μM 3-MC and the other inlet: 2 μM 3-MC) at a flow rate of 120 µL/hr for 24 hours. Hepatocytes produced an ascending profile of CYP1A2 expression level along with the width of the device. Image quantification of CYP1A2 staining in hepatocytes was performed by Image J. (a) All data met p < 0.05 except that non-induced vs ch1, ch3 vs ch4, and ch4 vs ch5 are not significant (ANOVA n = 3, Tukey’s test). (b) All data met p < 0.05 except that non-induced vs ch1 and ch3 vs ch4 are not significant (ANOVA n = 7, Tukey’s test). (c) Primary human hepatocytes induced with a gradient of 3-MC produced a zonation of CYP1A2 mRNA fold change along with the width of the device (n = 4, p < 0.05 except for *p = 0.11 and **p = 0.35). Each experiment was replicated using at least three different cell pools. Scale bar: 400 µm.
Figure 7 Differential expression of drug metabolic enzymes of primary (a) rat and (b,c) human hepatocytes in the MPOC platform. Hepatocytes cultured in the device were induced with a gradient of 3-MC (one inlet: 0 μM 3-MC and the other inlet: 2 μM 3-MC) at a flow rate of 120 µL/hr for 24 hours. Hepatocytes produced an ascending profile of CYP1A2 expression level along with the width of the device. Image quantification of CYP1A2 staining in hepatocytes was performed by Image J. (a) All data met p < 0.05 except that non-induced vs ch1, ch3 vs ch4, and ch4 vs ch5 are not significant (ANOVA n = 3, Tukey’s test). (b) All data met p < 0.05 except that non-induced vs ch1 and ch3 vs ch4 are not significant (ANOVA n = 7, Tukey’s test). (c) Primary human hepatocytes induced with a gradient of 3-MC produced a zonation of CYP1A2 mRNA fold change along with the width of the device (n = 4, p < 0.05 except for *p = 0.11 and **p = 0.35). Each experiment was replicated using at least three different cell pools. Scale bar: 400 µm.CC BY · PubMed Central

Verification

Claims the paper makes

The claims and statistics of this paper haven’t been checked yet.

Run the check — free, no account needed. It reads the open-access text and checks the sources it cites.

A few free checks a day · papers already verified open instantly · results are public

Claims other papers make about this one

Each is checked against this paper’s own text: does it say what the citing paper says it does?

Self-check

Percentages, sums and reported differences re-computed from the paper’s own numbers.

The self-check needs the paper’s full text.

Citations

Cites

Show all 60 references

Research works printed but not linked: 1

  1. Vogel, S. Life’s Devices: The Physical World of Animals and Plants. 59508th edition edn, 384 (Princeton University Press, 1988).

Cited by

Sorted by citations

See all 122

Metadata

Authors
Kang, Y. B., Eo, J., Mert, S., Yarmush, M. L., & Usta, O. B.
Affiliations
  • Harvard University (US)
  • Rutgers, The State University of New Jersey (US)
Corresponding author
Usta, O. Berk
Venue
Scientific Reports
Published
2018-06-12
Volume
8
Issue
1
Pages
8951-8951
ISSN
2045-2322 (ISSN-L)
OpenAlex
W2805101331
Cited by
122
References
60
Citations by year
2026: 7 · 2025: 13 · 2024: 6 · 2023: 25 · 2022: 24 · 2021: 10 · 2020: 20 · 2019: 12 · 2018: 4
FWCI
4.60
Type
journal article
Language
en
Open access
Locations
  • Scientific Reports (publishedVersion, cc-by)
  • Europe PMC (PubMed Central) (publishedVersion, other-oa)
  • PubMed Central (publishedVersion, cc-by)
  • PubMed (publishedVersion)
  • Digital Access to Scholarship at Harvard (DASH) (Harvard University) (submittedVersion, cc-by)
  • Digital Commons - George Fox University (George Fox University) (submittedVersion)
  • DOAJ (DOAJ: Directory of Open Access Journals) (submittedVersion)
Funders
  • National Institutes of Health
  • National Institute of Biomedical Imaging and Bioengineering (R01EB023812, R21EB020192, P41EB002503)
Topics
  • Physical Sciences › Engineering › Biomedical Engineering › 3D Printing in Biomedical Research
  • Health Sciences › Medicine › Hepatology › Liver physiology and pathology
  • Life Sciences › Pharmacology, Toxicology and Pharmaceutics › Pharmacology › Drug-Induced Hepatotoxicity and Protection
Keywords
liver zonation, hepatocyte zonation, metabolic gradients, hepatocyte heterogeneity, xenobiotic metabolism, nitrogen metabolism, carbohydrate metabolism, primary human hepatocytes, rat hepatocytes, tissue engineering
MeSH terms
Animals, Female, Humans, Liver, Rats, Inbred Lew, Xenobiotics, Hepatocytes, Carbohydrate Metabolism, Rats, Primary Cell Culture

About these checks

Registry, retraction, Cites and statistics results are computed, not judged, with one exception: a printed reference that no index lists is read once by a model before it counts as a citation error. Claims are extracted by a model and kept only when their quote appears verbatim in the text; each cited source is then checked, with a model’s help, for whether it says what the claim relies on. Those verdicts can be wrong — read the claim’s quote and the cited source before relying on one.

Statistics and arithmetic are recomputed, not judged.

Confidence bands are shown only for fields calibrated on our annotated test set. None is calibrated yet, so no band is shown.

What counts as a claim ›How we measure confidence ›How we check this ›

Are you an author, or do you see a problem with this page? Request a review