

The DOI matches its Crossref record; 4 of the 4 references it cites were found in a registry or an index.
Novel Bead-Based Epitope Assay is a sensitive and reliable tool for profiling epitope-specific antibody repertoire in food allergy
Abstract
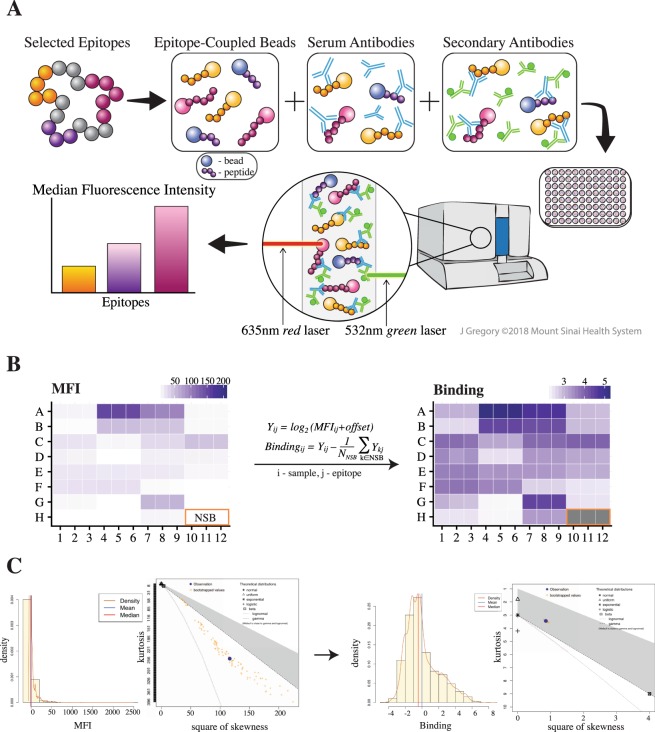
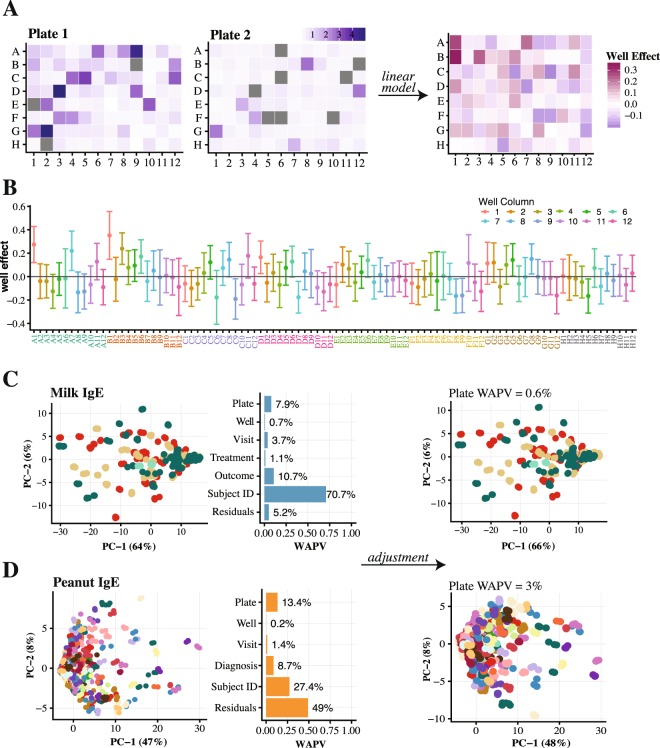
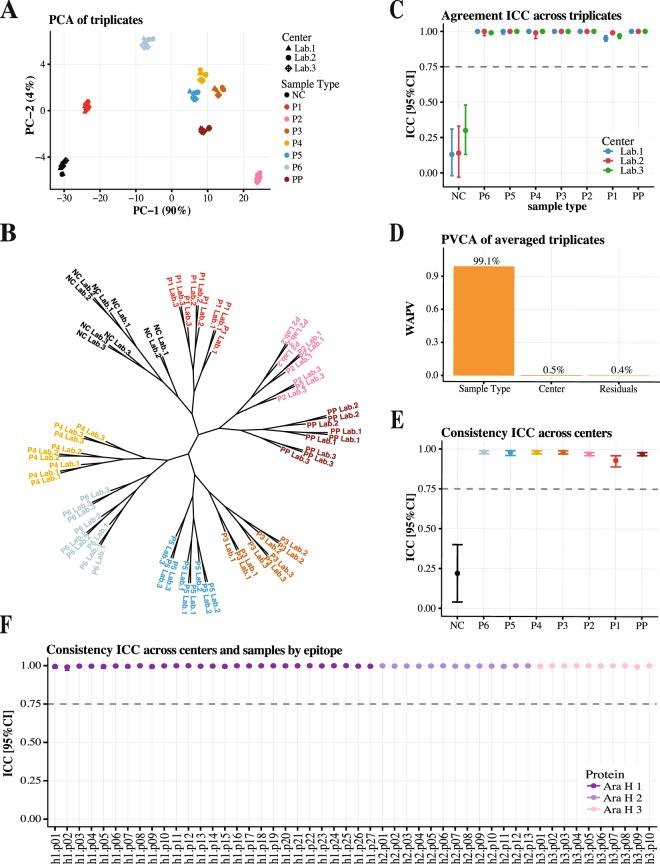
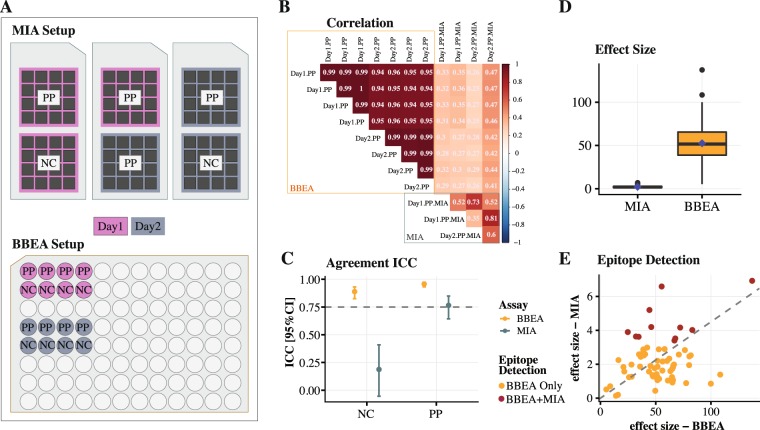
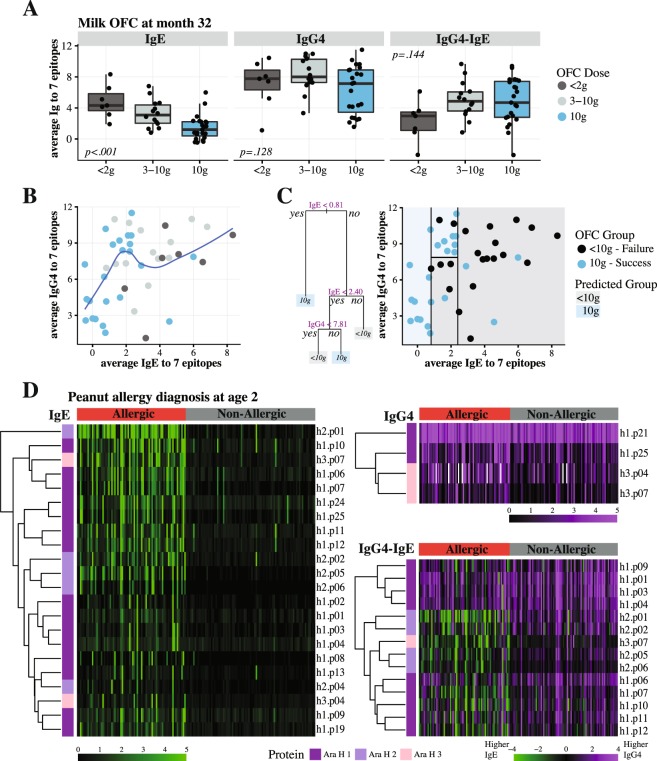
Identification of allergenic IgE epitopes is instrumental for the development of novel diagnostic and prognostic methods in food allergy. In this work, we present the quantification and validation of a Bead-Based Epitope Assay (BBEA) that through multiplexing of epitopes and multiple sample processing enables completion of large experiments in a short period of time, using minimal quantities of patients’ blood. Peptides that are uniquely coupled to beads are incubated with serum or plasma samples, and after a secondary fluorophore-labeled antibody is added, the level of fluorescence is quantified with a Luminex reader. The signal is then normalized and converted to epitope-specific antibody binding values. We show that the effect of technical artifacts, i.e. well position or reading order, is minimal; and batch effects - different individual microplate runs - can be easily estimated and eliminated from the data. Epitope-specific antibody binding quantified with BBEA is highly reliable, reproducible and has greater sensitivity of epitope detection compared to peptide microarrays. IgE directed at allergenic epitopes is a sensitive biomarker of food allergy and can be used to predict allergy severity and phenotypes; and quantification of the relationship between epitope-specific IgE and IgG4 can further improve our understanding of the immune mechanisms behind allergic sensitization.
Overview
The claims and statistics of this paper haven’t been checked yet.
Run the check — free, no account needed. It reads the open-access text and checks the sources it cites.
Integrity signals
Registry
Cites
Statistics
Figures
Verification
Claims the paper makes
The claims and statistics of this paper haven’t been checked yet.
Run the check — free, no account needed. It reads the open-access text and checks the sources it cites.
Claims other papers make about this one
Each is checked against this paper’s own text: does it say what the citing paper says it does?
In the citing paper
“Combining BBEA with cellular assays and clinical history may enhance its utility [208,229].”
From Pollen–Food Allergy Syndrome: Allergens, Clinical Insights, Diagnostic and Therapeutic Challenges (2024) · cites this paper as [229]
Self-check
Percentages, sums and reported differences re-computed from the paper’s own numbers.
The self-check needs the paper’s full text.
Citations
Cites
Cicchetti, D. V. (1994) · Psychological Assessment · doi:10.1037/1040-3590.6.4.284 · Cited by 9,349
Leek, J. T., Johnson, W. E., Parker, H. S., Jaffe, A. E., & Storey, J. D. (2012) · Bioinformatics · doi:10.1093/bioinformatics/bts034 · Cited by 6,231
Tackling the widespread and critical impact of batch effects in high-throughput data
Leek, J. T., Scharpf, R. B., Bravo, H. C., Simcha, D., Langmead, B., Johnson, W. E., Geman, D., Baggerly, K., & Irizarry, R. A. (2010) · Nature Reviews Genetics · doi:10.1038/nrg2825 · Cited by 2,196
Allergenic properties of ovomucoid in man
Cooke, S. K., & Sampson, H. A. (1997) · The Journal of Immunology · doi:10.4049/jimmunol.159.4.2026 · Cited by 250
Self-citation
Research works printed but not linked: 74
- Gupta, R. S. et al. The Public Health Impact of Parent-Reported Childhood Food Allergies in the United States. Pediatrics 142, https://doi.org/10.1542/peds.2018-1235 (2018). · DOI
- Gupta, R. S. et al. Prevalence and Severity of Food Allergies Among US Adults. JAMA Netw Open 2, e185630, https://doi.org/10.1001/jamanetworkopen.2018.5630 (2019). · DOI
- Sampson, H. A. et al. Mechanisms of food allergy. The Journal of allergy and clinical immunology 141, 11–19, https://doi.org/10.1016/j.jaci.2017.11.005 (2018). · DOI
- Goldman, A. S. et al. Milk Allergy. I. Oral Challenge with Milk and Isolated Milk Proteins in Allergic Children. Pediatrics 32, 425–443 (1963). · DOI
- Loveless, M. H. Allergy for corn and its derivatives: experiments with a masked ingestion test for its diagnosis. J Allergy 21, 500–509 (1950). · DOI
- May, C. D. Objective clinical and laboratory studies of immediate hypersensitivity reactions to foods in asthmatic children. The Journal of allergy and clinical immunology 58, 500–515 (1976). · DOI
- Sampson, H. A. et al. Standardizing double-blind, placebo-controlled oral food challenges: American Academy of Allergy, Asthma & Immunology-European Academy of Allergy and Clinical Immunology PRACTALL consensus report. The Journal of allergy and clinical immunology 130, 1260–1274, https://doi.org/10.1016/j.jaci.2012.10.017 (2012). · DOI
- Schloss, O. A Case Of Allergy To Common Foods. Nutrition Reviews 41, 249–252, https://doi.org/10.1111/j.1753-4887.1983.tb07189.x (1983). · DOI
- Cohen, S. G. Food allergens: landmarks along a historic trail. The Journal of allergy and clinical immunology 121, 1521–1524, 1524 e1521, https://doi.org/10.1016/j.jaci.2008.04.027 (2008). · DOI
- Sampson, H. A. Food allergy: Past, present and future. Allergol Int 65, 363–369, 10.1016/j.alit.2016.08.006 (2016). · DOI
- Aas, K. The diagnosis of hypersensitivity to ingested foods. Reliability of skin prick testing and the radioallergosorbent test with different materials. Clin Allergy 8, 39–50 (1978). · DOI
- Bock, S. A., Lee, W. Y., Remigio, L., Holst, A. & May, C. D. Appraisal of skin tests with food extracts for diagnosis of food hypersensitivity. Clin Allergy 8, 559–564 (1978). · DOI
- Kalliel, J. N., Klein, D. E. & Settipane, G. A. Anaphylaxis to peanuts: clinical correlation to skin tests. Allergy Proc 10, 259–260 (1989). · DOI
- McCann, W. A. & Ownby, D. R. The reproducibility of the allergy skin test scoring and interpretation by board-certified/board-eligible allergists. Ann Allergy Asthma Immunol 89, 368–371, https://doi.org/10.1016/S1081-1206(10)62037-6 (2002). · DOI · Paper page
- Gendo, K. & Larson, E. B. Evidence-based diagnostic strategies for evaluating suspected allergic rhinitis. Ann Intern Med 140, 278–289 (2004). · DOI · Paper page
- Soares-Weiser, K. et al. The diagnosis of food allergy: a systematic review and meta-analysis. Allergy 69, 76–86, https://doi.org/10.1111/all.12333 (2014). · DOI
- Sampson, H. A. & Ho, D. G. Relationship between food-specific IgE concentrations and the risk of positive food challenges in children and adolescents. The Journal of allergy and clinical immunology 100, 444–451 (1997). · DOI
- Garcia-Ara, C. et al. Specific IgE levels in the diagnosis of immediate hypersensitivity to cows’ milk protein in the infant. The Journal of allergy and clinical immunology 107, 185–190 (2001). · DOI
- Sampson, H. A. Utility of food-specific IgE concentrations in predicting symptomatic food allergy. The Journal of allergy and clinical immunology 107, 891–896, https://doi.org/10.1067/mai.2001.114708 (2001). · DOI
- Komata, T., Soderstrom, L., Borres, M. P., Tachimoto, H. & Ebisawa, M. The predictive relationship of food-specific serum IgE concentrations to challenge outcomes for egg and milk varies by patient age. The Journal of allergy and clinical immunology 119, 1272–1274, https://doi.org/10.1016/j.jaci.2007.01.038 (2007). · DOI
- Dang, T. D. et al. Increasing the accuracy of peanut allergy diagnosis by using Ara h 2. The Journal of allergy and clinical immunology 129, 1056–1063, https://doi.org/10.1016/j.jaci.2012.01.056 (2012). · DOI
- Nicolaou, N. et al. Allergy or tolerance in children sensitized to peanut: prevalence and differentiation using component-resolved diagnostics. The Journal of allergy and clinical immunology 125, 191–197 e191-113, https://doi.org/10.1016/j.jaci.2009.10.008 (2010). · DOI
- Frank, R. & Overwin, H. SPOT synthesis. Epitope analysis with arrays of synthetic peptides prepared on cellulose membranes. Methods Mol Biol 66, 149–169, https://doi.org/10.1385/0-89603-375-9:149 (1996). · DOI
- Frank, R. The SPOT-synthesis technique. Synthetic peptide arrays on membrane supports–principles and applications. J Immunol Methods 267, 13–26 (2002). · DOI
- Urisu, A. et al. Allergenic activity of heated and ovomucoid-depleted egg white. The Journal of allergy and clinical immunology 100, 171–176 (1997). · DOI
- Shreffler, W. G., Beyer, K., Chu, T. H., Burks, A. W. & Sampson, H. A. Microarray immunoassay: association of clinical history, in vitro IgE function, and heterogeneity of allergenic peanut epitopes. The Journal of allergy and clinical immunology 113, 776–782, https://doi.org/10.1016/j.jaci.2003.12.588 (2004). · DOI
- Flinterman, A. E. et al. Peanut epitopes for IgE and IgG4 in peanut-sensitized children in relation to severity of peanut allergy. The Journal of allergy and clinical immunology 121, 737–743 e710, https://doi.org/10.1016/j.jaci.2007.11.039 (2008). · DOI
- Tsang, J. S. Utilizing population variation, vaccination, and systems biology to study human immunology. Trends Immunol 36, 479–493, https://doi.org/10.1016/j.it.2015.06.005 (2015). · DOI
- Burks, A. W. et al. Mapping and mutational analysis of the IgE-binding epitopes on Ara h 1, a legume vicilin protein and a major allergen in peanut hypersensitivity. Eur J Biochem 245, 334–339 (1997). · DOI
- Stanley, J. S. et al. Identification and mutational analysis of the immunodominant IgE binding epitopes of the major peanut allergen Ara h 2. Arch Biochem Biophys 342, 244–253, https://doi.org/10.1006/abbi.1997.9998 (1997). · DOI
- Rabjohn, P. et al. Molecular cloning and epitope analysis of the peanut allergen Ara h 3. J Clin Invest 103, 535–542, https://doi.org/10.1172/JCI5349 (1999). · DOI
- Beyer, K. et al. IgE-binding peptides coupled to a commercial matrix as a diagnostic instrument for persistent cow’s milk allergy. The Journal of allergy and clinical immunology 116, 704–705, https://doi.org/10.1016/j.jaci.2005.05.007 (2005). · DOI
- Cerecedo, I. et al. Mapping of the IgE and IgG4 sequential epitopes of milk allergens with a peptide microarray-based immunoassay. The Journal of allergy and clinical immunology 122, 589–594, https://doi.org/10.1016/j.jaci.2008.06.040 (2008). · DOI
- Han, N. et al. Identification of amino acids critical for IgE-binding to sequential epitopes of bovine kappa-casein and the similarity of these epitopes to the corresponding human kappa-casein sequence. Allergy 63, 198–204, https://doi.org/10.1111/j.1398-9995.2007.01539.x (2008). · DOI
- Wang, J. et al. Correlation of IgE/IgG4 milk epitopes and affinity of milk-specific IgE antibodies with different phenotypes of clinical milk allergy. The Journal of allergy and clinical immunology 125, 695–702, 702 e691–702 e696, https://doi.org/10.1016/j.jaci.2009.12.017 (2010). · DOI
- Lin, J. et al. A bioinformatics approach to identify patients with symptomatic peanut allergy using peptide microarray immunoassay. The Journal of allergy and clinical immunology 129, 1321–1328 e1325, https://doi.org/10.1016/j.jaci.2012.02.012 (2012). · DOI
- Shreffler, W. G., Lencer, D. A., Bardina, L. & Sampson, H. A. IgE and IgG4 epitope mapping by microarray immunoassay reveals the diversity of immune response to the peanut allergen, Ara h 2. The Journal of allergy and clinical immunology 116, 893–899, https://doi.org/10.1016/j.jaci.2005.06.033 (2005). · DOI
- Bjornstal, O. et al. The impact of decreased bead count to determine concentrations of amyloid beta1-42, total-tau, and phosphorylated-tau181 in human cerebrospinal fluid using xMAP technology. J Pharm Sci 100, 4655–4663, https://doi.org/10.1002/jps.22700 (2011). · DOI
- John Bailer, A. Probabilistic Techniques in Exposure Assessment. A Handbook for Dealing with Variability and Uncertainty in Models and Inputs. A. C. Cullen and H. C. Frey, Plenum Press, New York and London, 1999. ISBN 0-306-45956-6. Statistics in Medicine 20, 2211–2213, https://doi.org/10.1002/sim.958 (2001). · DOI
- Delignette-Muller, M. L. & Dutang, C. fitdistrplus: An R Package for Fitting Distributions. 2015 64, 34, https://doi.org/10.18637/jss.v064.i04 (2015). · DOI
- Oliver, D. G., Sanders, A. H., Hogg, R. D. & Hellman, J. W. Thermal gradients in microtitration plates. Effects on enzyme-linked immunoassay. J Immunol Methods 42, 195–201 (1981). · DOI
- Harrison, R. O. & Hammock, B. D. Location dependent biases in automatic 96-well microplate readers. J Assoc Off Anal Chem 71, 981–987 (1988).
- Patel, M. I., Tuckerman, R. & Dong, Q. A Pitfall of the 3-(4,5-dimethylthiazol-2-yl)-5(3-carboxymethonyphenol)-2-(4-sulfophenyl)-2H-tetra zolium (MTS) assay due to evaporation in wells on the edge of a 96 well plate. Biotechnol Lett 27, 805–808, https://doi.org/10.1007/s10529-005-5803-x (2005). · DOI
- Liang, Y., Woodle, S. A., Shibeko, A. M., Lee, T. K. & Ovanesov, M. V. Correction of microplate location effects improves performance of the thrombin generation test. Thromb J 11, 12, https://doi.org/10.1186/1477-9560-11-12 (2013). · DOI
- Lambert, C. G. & Black, L. J. Learning from our GWAS mistakes: from experimental design to scientific method. Biostatistics 13, 195–203, https://doi.org/10.1093/biostatistics/kxr055 (2012). · DOI
- Browne, R. W. et al. Performance of multiplex cytokine assays in serum and saliva among community-dwelling postmenopausal women. PLoS One 8, e59498, https://doi.org/10.1371/journal.pone.0059498 (2013). · DOI
- Li, J., Bushel, P. R., Chu, T. M. & Wolfinger, R. D. In Batch Effects and Noise in Microarray Experiments: Sources and Solutions Ch. 12, 141–154 (John Wiley & Sons, Ltd, 2009). · DOI
- Suprun, M. & Suarez-Farinas, M. PlateDesigner: a web-based application for the design of microplate experiments. Bioinformatics, https://doi.org/10.1093/bioinformatics/bty853 (2018). · DOI
- Lin, J. & Sampson, H. A. IgE Epitope Mapping Using Peptide Microarray Immunoassay. Methods Mol Biol 1592, 177–187, https://doi.org/10.1007/978-1-4939-6925-8_14 (2017). · DOI
- Baker, M. G. & Sampson, H. A. Phenotypes and endotypes of food allergy: A path to better understanding the pathogenesis and prognosis of food allergy. Ann Allergy Asthma Immunol 120, 245–253, https://doi.org/10.1016/j.anai.2018.01.027 (2018). · DOI
- Wood, R. A. et al. A randomized, double-blind, placebo-controlled study of omalizumab combined with oral immunotherapy for the treatment of cow’s milk allergy. The Journal of allergy and clinical immunology 137, 1103–1110.e1111, https://doi.org/10.1016/j.jaci.2015.10.005 (2016). · DOI
- Suarez-Farinas, M. et al. Predicting development of sustained unresponsiveness to milk oral immunotherapy using epitope-specific antibody binding profiles. The Journal of allergy and clinical immunology, https://doi.org/10.1016/j.jaci.2018.10.028 (2018). · DOI
- Sicherer, S. H. et al. Immunologic features of infants with milk or egg allergy enrolled in an observational study (Consortium of Food Allergy Research) of food allergy. The Journal of allergy and clinical immunology 125, 1077–1083 e1078, https://doi.org/10.1016/j.jaci.2010.02.038 (2010). · DOI
- Sicherer, S. H. et al. Clinical Factors Associated with Peanut Allergy in a High Risk Infant Cohort. Allergy, https://doi.org/10.1111/all.13920 (2019). · DOI
- Johnson, W. E., Li, C. & Rabinovic, A. Adjusting batch effects in microarray expression data using empirical Bayes methods. Biostatistics 8, 118–127, https://doi.org/10.1093/biostatistics/kxj037 (2007). · DOI · Paper page
- Clarke, D. C., Morris, M. K. & Lauffenburger, D. A. Normalization and statistical analysis of multiplexed bead-based immunoassay data using mixed-effects modeling. Mol Cell Proteomics 12, 245–262, https://doi.org/10.1074/mcp.M112.018655 (2013). · DOI
- Sackesen, C. et al. A new Luminex-based peptide assay to identify reactivity to baked, fermented, and whole milk. Allergy, https://doi.org/10.1111/all.13581 (2018). · DOI
- van Neerven, R. J. et al. Blocking antibodies induced by specific allergy vaccination prevent the activation of CD4+ T cells by inhibiting serum-IgE-facilitated allergen presentation. J Immunol 163, 2944–2952 (1999). · DOI
- Nouri-Aria, K. T. et al. Grass pollen immunotherapy induces mucosal and peripheral IL-10 responses and blocking IgG activity. J Immunol 172, 3252–3259 (2004). · DOI
- Ahrens, B. et al. The role of hen’s egg-specific IgE, IgG and IgG4 in the diagnostic procedure of hen’s egg allergy. Allergy 65, 1554–1557, https://doi.org/10.1111/j.1398-9995.2010.02429.x (2010). · DOI
- Uermosi, C. et al. Mechanisms of allergen-specific desensitization. The Journal of allergy and clinical immunology 126, 375–383, https://doi.org/10.1016/j.jaci.2010.05.040 (2010). · DOI
- Matsuoka, T., Shamji, M. H. & Durham, S. R. Allergen immunotherapy and tolerance. Allergol Int 62, 403–413, https://doi.org/10.2332/allergolint.13-RAI-0650 (2013). · DOI
- Burton, O. T. et al. Oral immunotherapy induces IgG antibodies that act through FcgammaRIIb to suppress IgE-mediated hypersensitivity. The Journal of allergy and clinical immunology 134, 1310–1317 e1316, https://doi.org/10.1016/j.jaci.2014.05.042 (2014). · DOI
- Hofmaier, S., Comberiati, P. & Matricardi, P. M. Immunoglobulin G in IgE-mediated allergy and allergen-specific immunotherapy. Eur Ann Allergy Clin Immunol 46, 6–11 (2014).
- Chen, H. D., Chen, C. L. & Huang, S. W. Characterization of latex allergens and correlation of serum IgE/IgG antibody ratio with clinical symptoms. Allergy Asthma Proc 17, 143–148 (1996). · DOI
- Noh, G., Ahn, H. S., Cho, N. Y., Lee, S. & Oh, J. W. The clinical significance of food specific IgE/IgG4 in food specific atopic dermatitis. Pediatr Allergy Immunol 18, 63–70, https://doi.org/10.1111/j.1399-3038.2006.00478.x (2007). · DOI
- Tomicic, S. et al. High levels of IgG4 antibodies to foods during infancy are associated with tolerance to corresponding foods later in life. Pediatr Allergy Immunol 20, 35–41, https://doi.org/10.1111/j.1399-3038.2008.00738.x (2009). · DOI
- Savilahti, E. M. et al. Early recovery from cow’s milk allergy is associated with decreasing IgE and increasing IgG4 binding to cow’s milk epitopes. The Journal of allergy and clinical immunology 125, 1315–1321 e1319, https://doi.org/10.1016/j.jaci.2010.03.025 (2010). · DOI
- Leonard, S. A. et al. Dietary baked egg accelerates resolution of egg allergy in children. The Journal of allergy and clinical immunology 130, 473–480 e471, https://doi.org/10.1016/j.jaci.2012.06.006 (2012). · DOI
- Vazquez-Ortiz, M. et al. Ovalbumin-specific IgE/IgG4 ratio might improve the prediction of cooked and uncooked egg tolerance development in egg-allergic children. Clin Exp Allergy 44, 579–588, https://doi.org/10.1111/cea.12273 (2014). · DOI
- Lau, S. et al. Longitudinal study on the relationship between cat allergen and endotoxin exposure, sensitization, cat-specific IgG and development of asthma in childhood–report of the German Multicentre Allergy Study (MAS 90). Allergy 60, 766–773, https://doi.org/10.1111/j.1398-9995.2005.00781.x (2005). · DOI
- Custovic, A. et al. Allergen-specific IgG antibody levels modify the relationship between allergen-specific IgE and wheezing in childhood. The Journal of allergy and clinical immunology 127, 1480–1485, https://doi.org/10.1016/j.jaci.2011.03.014 (2011). · DOI
- Savilahti, E. M. et al. Use of IgE and IgG4 epitope binding to predict the outcome of oral immunotherapy in cow’s milk allergy. Pediatr Allergy Immunol 25, 227–235, https://doi.org/10.1111/pai.12186 (2014). · DOI
- Ritchie, M. E. et al. limma powers differential expression analyses for RNA-sequencing and microarray studies. Nucleic Acids Res 43, e47, https://doi.org/10.1093/nar/gkv007 (2015). · DOI · Paper page
Cited by
Sorted by citations
Pollen–Food Allergy Syndrome: Allergens, Clinical Insights, Diagnostic and Therapeutic Challenges
Haidar, L., Bănărescu, C. F., Uța, C., Moldovan, S. I., Zimbru, E.-L., Zimbru, R.-I., Ciurariu, E., Georgescu, M., & Panaitescu, C. (2024) · Applied Sciences · doi:10.3390/app15010066 · Cited by 21
Metadata
- Authors
- Suprun, M., Getts, R., Raghunathan, R., Grishina, G., Witmer, M., Gimenez, G., Sampson, H. A., & Suárez-Fariñas, M.
- Venue
- Scientific Reports
- Published
- 2019-12-05
- Volume
- 9
- Issue
- 1
- ISSN
- 2045-2322
- PMC
- PMC6895130
- Cited by
- 64
- References
- 4
- Language
- en
- Update notices
- correction (2020-02-13)
- Funders
- Division of Intramural Research, National Institute of Allergy and Infectious Diseases (AI-66738)
- David H. and Julia Koch Research Program in Food Allergy Therapeutics; AllerGenis LLC
About these checks
Registry, retraction, Cites and statistics results are computed, not judged, with one exception: a printed reference that no index lists is read once by a model before it counts as a citation error. Claims are extracted by a model and kept only when their quote appears verbatim in the text; each cited source is then checked, with a model’s help, for whether it says what the claim relies on. Those verdicts can be wrong — read the claim’s quote and the cited source before relying on one.
Statistics and arithmetic are recomputed, not judged.
Confidence bands are shown only for fields calibrated on our annotated test set. None is calibrated yet, so no band is shown.
What counts as a claim ›How we measure confidence ›How we check this ›
Are you an author, or do you see a problem with this page? Request a review
