

The DOI matches its Crossref record; the references it cites are not checked yet.
Nitrifying biofilms deprived of organic carbon show higher functional resilience to increases in carbon supply
Open accessAbstract
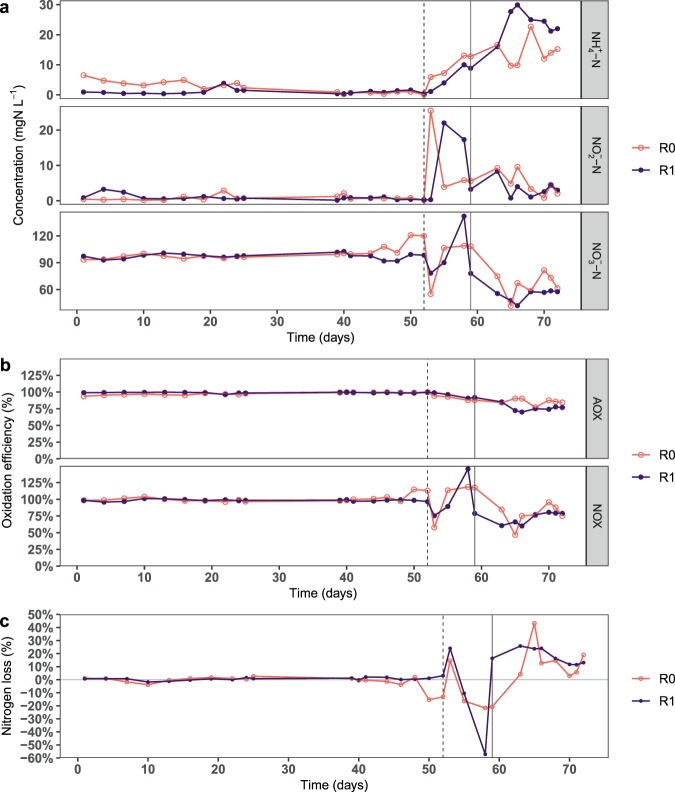
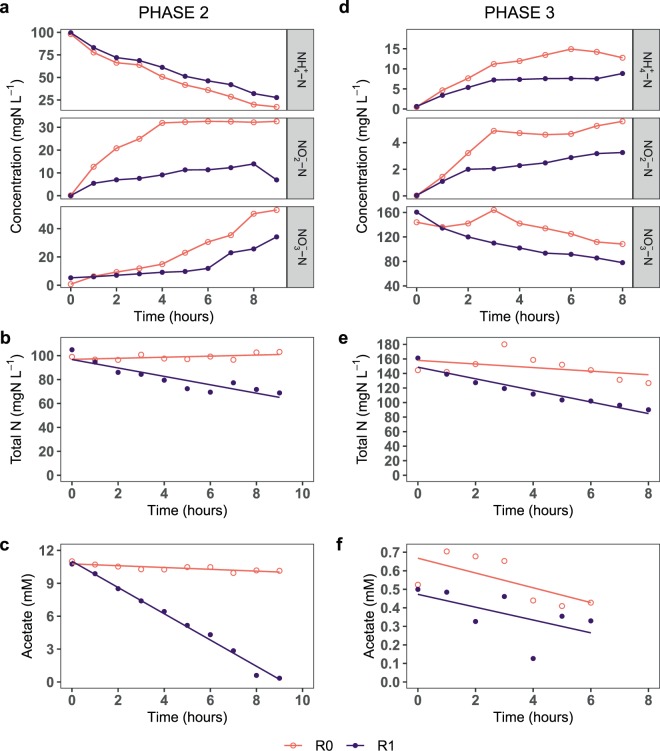
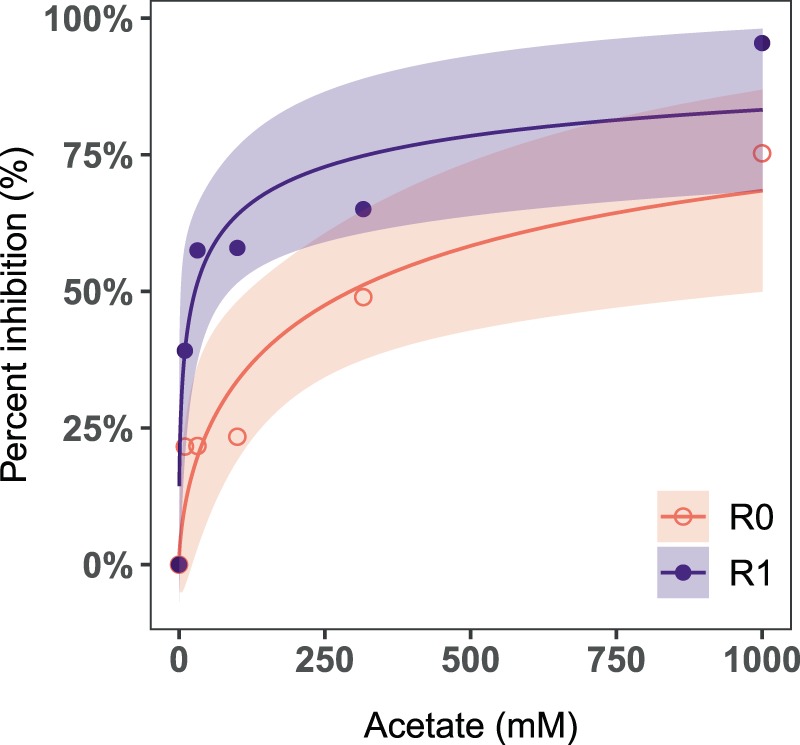
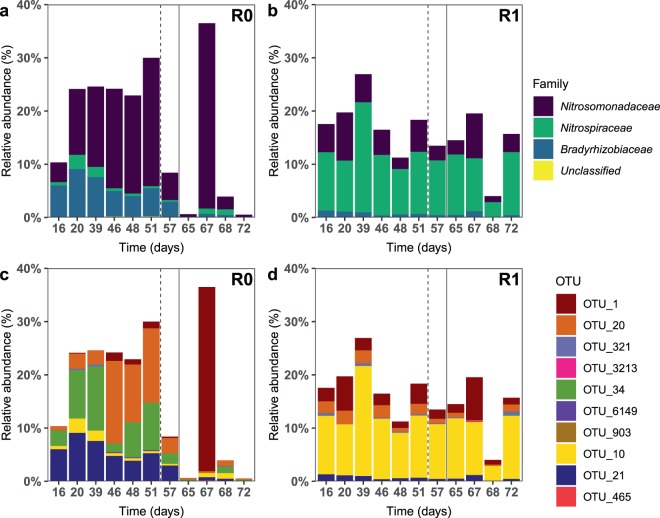
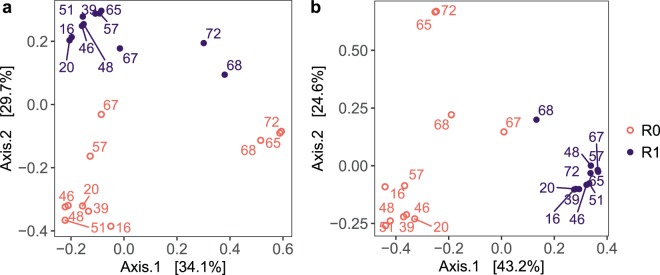
In nitrifying biofilms, the organic carbon to ammonia nitrogen (C/N) supply ratio can influence resource competition between heterotrophic and nitrifying bacteria for oxygen and space. We investigated the impact of acute and chronic changes in carbon supply on inter-guild competition in two moving bed biofilm reactors (MBBR), operated with (R1) and without (R0) external organic carbon supply. The microbial and nitrifying community composition of the reactors differed significantly. Interestingly, acute increases in the dissolved organic carbon inhibited nitrification in R1 ten times more than in R0. A sustained increase in the carbon supply decreased nitrification efficiency and increased denitrification activity to a greater extent in R1, and also increased the proportion of potential denitrifiers in both bioreactors. The findings suggest that autotrophic biofilms subjected to increases in carbon supply show higher nitrification and lower denitrification activity than carbon-fed biofilms. This has significant implications for the design of nitrifying bioreactors. Specifically, efficient removal of organic matter before the nitrification unit can improve the robustness of the bioreactor to varying influent quality. Thus, maintaining a low C/N ratio is important in nitrifying biofilters when acute carbon stress is expected or when anoxic activity (e.g. denitrification or H 2 S production) is undesirable, such as in recirculating aquaculture systems (RAS).
Overview
The claims and statistics of this paper haven’t been checked yet.
Run the check — free, no account needed. It reads the open-access text and checks the sources it cites.
Integrity signals
Registry
Cites
Statistics
Figures
Verification
Claims the paper makes
The claims and statistics of this paper haven’t been checked yet.
Run the check — free, no account needed. It reads the open-access text and checks the sources it cites.
Self-check
Percentages, sums and reported differences re-computed from the paper’s own numbers.
The self-check needs the paper’s full text.
Citations
The citation lists haven’t been fetched yet
References 65 · Cited by 59
Research works printed but not linked: 57
- Daims, H. et al. Complete nitrification by Nitrospira bacteria. Nature 528, 504–509 (2015). · DOI
- Flemming, H. C. et al. Biofilms: An emergent form of bacterial life. Nat. Rev. Microbiol. 14, 563–575 (2016). · DOI · Paper page
- Rittmann, B. E. & McCarty, P. L. Environmental biotechnology: Principles and Applications. (Tata McGraw Hill Education, 2001).
- Bassin, J. P., Kleerebezem, R., Rosado, A. S., Van Loosdrecht, M. C. M. & Dezotti, M. Effect of different operational conditions on biofilm development, nitrification, and nitrifying microbial population in moving-bed biofilm reactors. Environ. Sci. Technol. 46, 1546–1555 (2012). · DOI
- Tsuneda, S., Park, S., Hayashi, H., Jung, J. & Hirata, A. Enhancement of nitrifying biofilm formation using selected EPS produced by heterotrophic bacteria. Water Sci. Technol. 43, 197–204 (2001). · DOI
- Nogueira, R., Melo, L. F., Purkhold, U., Wuertz, S. & Wagner, M. Nitrifying and heterotrophic population dynamics in biofilm reactors: effects of hydraulic retention time and the presence of organic carbon. Water Res. 36, 469–481 (2002). · DOI
- Michaud, L. et al. C/N ratio-induced structural shift of bacterial communities inside lab-scale aquaculture biofilters. Aquac. Eng. 58, 77–87 (2014). · DOI
- Ras, M., Lefebvre, D., Derlon, N., Paul, E. & Girbal-Neuhauser, E. Extracellular polymeric substances diversity of biofilms grown under contrasted environmental conditions. Water Res. 45, 1529–1538 (2011). · DOI
- Zhang, T. C. & Bishop, P. L. Evaluation of substrate and pH effects in a nitrifying biofilm. Water Environ. Res. 68, 1107–1115 (1996). · DOI
- Zhang, T. C., Fu, Y.-C. & Bishop, P. L. Competition for substrate and space in biofilms. Water Environ. Res. 67, 992–1003 (1995). · DOI
- Piculell, M., Welander, P., Jönsson, K. & Welander, T. Evaluating the effect of biofilm thickness on nitrification in moving bed biofilm reactors. Environ. Technol. 37, 732–743 (2016). · DOI
- Wijeyekoon, S., Mino, T., Satoh, H. & Matsuo, T. Effects of substrate loading rate on biofilm structure. Water Res. 38, 2479–2488 (2004). · DOI · Paper page
- Bassin, J. P. et al. Tracking the dynamics of heterotrophs and nitrifiers in moving-bed biofilm reactors operated at different COD/N ratios. Bioresour. Technol. 192, 131–141 (2015). · DOI
- Suarez, C. et al. Thickness determines microbial community structure and function in nitrifying biofilms via deterministic assembly. Sci. Rep. 9, 1–10 (2019). · DOI · Paper page
- Satoh, H., Okabe, S., Nobuo, N. & Watanabe, Y. Significance of substrate C/N Ratio on structure and activity of nitrifying biofilms determined by in situ hybridization and the use of microelectrodes. Water Sci. Technol. 41, 317–321 (2000). · DOI
- Hu, J. et al. Effect of organic carbon on nitrification efficiency and community composition of nitrifying biofilms. J. Environ. Sci. 21, 387–394 (2009). · DOI
- Boyd, C. E. In Fish Diseases: Prevention and Control Strategies 147–166, https://doi.org/10.1016/B978-0-12-804564-0.00006-5 (Elsevier, 2017). · DOI
- Guerdat, T. C., Losordo, T. M., Classen, J. J., Osborne, J. A. & DeLong, D. Evaluating the effects of organic carbon on biological filtration performance in a large scale recirculating aquaculture system. Aquac. Eng. 44, 10–18 (2011). · DOI
- Okabe, S., Naitoh, H., Satoh, H. & Watanabe, Y. Structure and function of nitrifying biofilms as determined by molecular techniques and the use of microelectrodes. Water Sci. Technol. 46, 233–241 (2002). · DOI
- Gonzalez-Silva, B. M., Jonassen, K. R., Bakke, I., Østgaard, K. & Vadstein, O. Nitrification at different salinities: Biofilm community composition and physiological plasticity. Water Res. 95, 48–58 (2016). · DOI
- Navada, S. et al. Influence of rate of salinity increase on nitrifying biofilms. J. Clean. Prod. 238 (2019). · DOI
- Ritz, C., Baty, F., Streibig, J. C. & Gerhard, D. Dose-response analysis using R. PLoS One 10, 1–13 (2015). · DOI
- Edgar, R. C. UPARSE: Highly accurate OTU sequences from microbial amplicon reads. Nat. Methods 10, 996–998 (2013). · DOI
- Edgar, R. SINTAX: a simple non-Bayesian taxonomy classifier for 16S and ITS sequences. bioRxiv 74161, https://doi.org/10.1101/074161 (2016). · DOI
- Hill, M. O. Diversity and Evenness: A Unifying Notation and Its Consequences. Ecology 54, 427–432 (1973). · DOI
- Anderson, M. J. A new method for non-parametric multivariate analysis of variance. Austral Ecol. 26, 32–46 (2001).
- Clarke, K. R. Non-parametric multivariate analyses of changes in community structure. Aust. J. Ecol. 18, 117–143 (1993). · DOI
- McMurdie, P. J. & Holmes, S. Phyloseq: An R Package for Reproducible Interactive Analysis and Graphics of Microbiome Census Data. PLoS One 8 (2013). · DOI
- Oksanen, J. et al. vegan: Community Ecology Package. R package version 2, 5–4 (2019).
- Cole, J. R. et al. Ribosomal Database Project: Data and tools for high throughput rRNA analysis. Nucleic Acids Res. 42, 633–642 (2014). · DOI
- Pruesse, E., Peplies, J. & Glöckner, F. O. SINA: Accurate high-throughput multiple sequence alignment of ribosomal RNA genes. Bioinformatics 28, 1823–1829 (2012). · DOI
- Zhu, S. & Chen, S. Effects of organic carbon on nitrification rate in fixed film biofilters. Aquac. Eng. 25, 1–11 (2001). · DOI
- Michaud, L., Blancheton, J. P., Bruni, V. & Piedrahita, R. Effect of particulate organic carbon on heterotrophic bacterial populations and nitrification efficiency in biological fillters. Aquac. Eng. 34, 224–233 (2006). · DOI
- Okabe, S., Hirata, K. & Watanabe, Y. Dynamic changes in spatial microbial distribution in mixed-population biofilms: Experimental results and model simulation. Water Sci. Technol. 32, 67–74 (1995). · DOI
- Ohashi, A. et al. Influence of substrate C/N ratio on the structure of multi-species biofilms consisting of nitrifiers and heterotrophs. Water Science and Technology 32, 75–84 (1995). · DOI
- Okabe, S., Hiratia, K., Ozawa, Y. & Watanabe, Y. Spatial Microbial Distributions of Nitrifiers and Heterotrophs in mixed-population biofilms. Biotechnol. Bioeng. 50, 24–35 (1996). · DOI
- Torresi, E. et al. Biofilm thickness influences biodiversity in nitrifying MBBRs - Implications on micropollutant removal. Environ. Sci. Technol. 50, 9279–9288 (2016). · DOI
- Okabe, S., Satoh, H. & Watanabe, Y. In situ analysis of nitrifying biofilms as determined by in situ hybridization and the use of microelectrodes. Appl. Environ. Microbiol. 65, 3182–91 (1999). · DOI
- Okabe, S., Oozawa, Y., Hirata, K. & Watanabe, Y. Relationship between population dynamics of nitrifiers in biofilms and reactor performance at various C:N ratios. Water Res. 30, 1563–1572 (1996). · DOI
- Schramm, A., De Beer, D., Gieseke, A. & Amann, R. Microenvironments and distribution of nitrifying bacteria in a membrane-bound biofilm. Environ. Microbiol. 2, 680–686 (2000). · DOI
- Ren, Y. X., Yang, L. & Liang, X. The characteristics of a novel heterotrophic nitrifying and aerobic denitrifying bacterium, Acinetobacter junii YB. Bioresour. Technol. 171, 1–9 (2014). · DOI
- Chen, J. & Strous, M. Denitrification and aerobic respiration, hybrid electron transport chains and co-evolution. Biochim. Biophys. Acta 1827, 136–144 (2013). · DOI
- Piculell, M. et al. The inhibitory effects of reject water on nitrifying populations grown at different biofilm thickness. Water Res. 104, 292–302 (2016). · DOI
- Matsumoto, S. et al. Experimental and simulation analysis of community structure of nitrifying bacteria in a membrane-aerated biofilm. Water Sci. Technol. 55, 283–290 (2007). · DOI
- Park, H. D. & Noguera, D. R. Characterization of two ammonia-oxidizing bacteria isolated from reactors operated with low dissolved oxygen concentrations. J. Appl. Microbiol. 102, 1401–1417 (2007). · DOI
- Bellucci, M., Ofiţeru, I. D., Graham, D. W., Head, I. M. & Curtis, T. P. Low-dissolved-oxygen nitrifying systems exploit ammonia-oxidizing bacteria with unusually high yields. Appl. Environ. Microbiol. 77, 7787–7796 (2011). · DOI
- Koops, H. P. & Pommerening-Röser, A. Distribution and ecophysiology of the nitrifying bacteria emphasizing cultured species. FEMS Microbiol. Ecol. 37, 1–9 (2001). · DOI
- Bollmann, A., Bär-Gilissen, M.-J. & Laanbroek, H. J. Growth at low ammonium concentrations and starvation response as potential factors involved in niche differentiation among ammonia-oxidizing bacteria. Appl. Environ. Microbiol. 68, 4751–4757 (2002). · DOI
- Gieseke, A., Purkhold, U., Wagner, M., Amann, R. & Schramm, A. Community Structure and Activity Dynamics of Nitrifying Bacteria in a Phosphate-Removing Biofilm. Appl. Environ. Microbiol. 67, 1351–1362 (2001). · DOI
- Keshvardoust, P. et al. Biofilm formation inhibition and dispersal of multi-species communities containing ammonia-oxidising bacteria. npj Biofilms Microbiomes 5, 25–28 (2019). · DOI
- Schramm, A. et al. Microscale Distribution of Populations and Activities of Nitrosospira and Nitrospira spp. along a macroscale gradient in a nitrifying bioreactor: Quantification by in situ hybridization and the use of microsensors. Appl. Environ. Microbiol. 65, 3690–3696 (1999). · DOI
- Nowka, B., Daims, H. & Spieck, E. Comparison of oxidation kinetics of nitrite-oxidizing bacteria: Nitrite availability as a key factor in niche differentiation. Appl. Environ. Microbiol. 81, 745–753 (2015). · DOI
- The Prokaryotes: A Handbook on the Biology of Bacteria (Vol 5)., https://doi.org/10.1007/0-387-30741-9 (Springer, 2006). · DOI
- Vannecke, T. P. W. & Volcke, E. I. P. Modelling microbial competition in nitrifying biofilm reactors. Biotechnol. Bioeng. 112, 2550–2561 (2015). · DOI
- Satoh, H., Yamakawa, T., Kindaichi, T., Ito, T. & Okabe, S. Community structures and activities of nitrifying and denitrifying bacteria in industrial wastewater-treating biofilms. Biotechnol. Bioeng. 94, 762–772 (2006). · DOI
- Daims, H., Lücker, S. & Wagner, M. A New Perspective on Microbes Formerly Known as Nitrite-Oxidizing Bacteria. Trends Microbiol. 24, 699–712 (2016). · DOI
- Lawson, C. E. & Lücker, S. Complete ammonia oxidation: an important control on nitrification in engineered ecosystems? Curr. Opin. Biotechnol. 50, 158–165 (2018). · DOI
Metadata
- Authors
- Navada, S., Knutsen, M. F., Bakke, I., & Vadstein, O.
- Affiliations
- Norwegian University of Science and Technology (NO)
- Corresponding author
- Navada, Sharada
- Venue
- Scientific Reports
- Published
- 2020-04-28
- Volume
- 10
- Issue
- 1
- Pages
- 7121-7121
- ISSN
- 2045-2322 (ISSN-L)
- PMC
- PMC7189377
- OpenAlex
- W3020027093
- Cited by
- 59
- References
- 65
- Citations by year
- 2026: 20 · 2025: 11 · 2024: 7 · 2023: 6 · 2022: 9 · 2021: 5 · 2020: 1
- FWCI
- 1.30
- Type
- journal article
- Language
- en
- Open access
- gold
- doi.org
- Locations
- Scientific Reports (publishedVersion, cc-by)
- PubMed Central (publishedVersion, cc-by)
- PubMed (publishedVersion)
- NORA - Norwegian Open Research Archives (submittedVersion, cc-by)
- NORA - Norwegian Open Research Archives (submittedVersion, other-oa)
- Funders
- Norges Forskningsråd (247558, 270888)
- Topics
- Physical Sciences › Environmental Science › Pollution › Wastewater Treatment and Nitrogen Removal
- Life Sciences › Agricultural and Biological Sciences › Aquatic Science › Innovations in Aquaponics and Hydroponics Systems
- Physical Sciences › Environmental Science › Health, Toxicology and Mutagenesis › Water Treatment and Disinfection
- Keywords
- nitrifying biofilm, organic carbon supply, C/N ratio, nitrification, denitrification, moving bed biofilm reactor, dissolved organic carbon, recirculating aquaculture system, heterotrophic bacteria, microbial community composition
- MeSH terms
- Bacteria, Carbon, Organic Chemicals, Aquaculture, Biofilms, Bioreactors, Nitrification
About these checks
Registry, retraction, Cites and statistics results are computed, not judged, with one exception: a printed reference that no index lists is read once by a model before it counts as a citation error. Claims are extracted by a model and kept only when their quote appears verbatim in the text; each cited source is then checked, with a model’s help, for whether it says what the claim relies on. Those verdicts can be wrong — read the claim’s quote and the cited source before relying on one.
Statistics and arithmetic are recomputed, not judged.
Confidence bands are shown only for fields calibrated on our annotated test set. None is calibrated yet, so no band is shown.
What counts as a claim ›How we measure confidence ›How we check this ›
Are you an author, or do you see a problem with this page? Request a review
How to cite
Cite CoChat for the checks on this page, and the paper for its own findings.
- This page
- CoChat. (2026). Citation check: Nitrifying biofilms deprived of organic carbon show higher functional resilience to increases in carbon supply. https://app.cochat.ai/papers/10.1038/s41598-020-64027-y
- The paper
- Navada, S., Knutsen, M. F., Bakke, I., & Vadstein, O. (2020). Nitrifying biofilms deprived of organic carbon show higher functional resilience to increases in carbon supply. Scientific Reports. https://doi.org/10.1038/s41598-020-64027-y
