

The DOI matches its Crossref record; 97 of the 97 references it cites were found in a registry or an index.
Persistence of plastic debris and its colonization by bacterial communities after two decades on the abyssal seafloor
Open accessAbstract
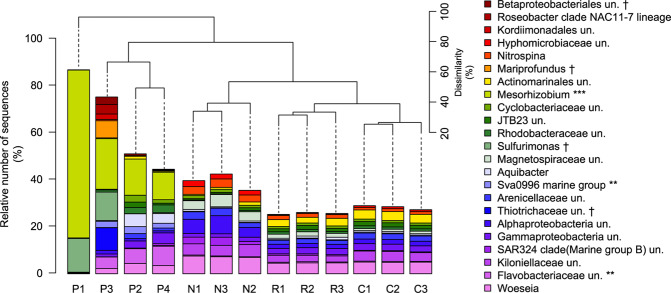
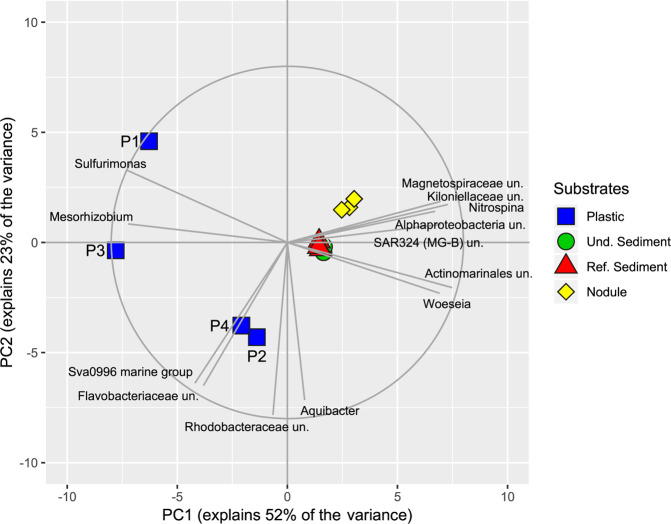
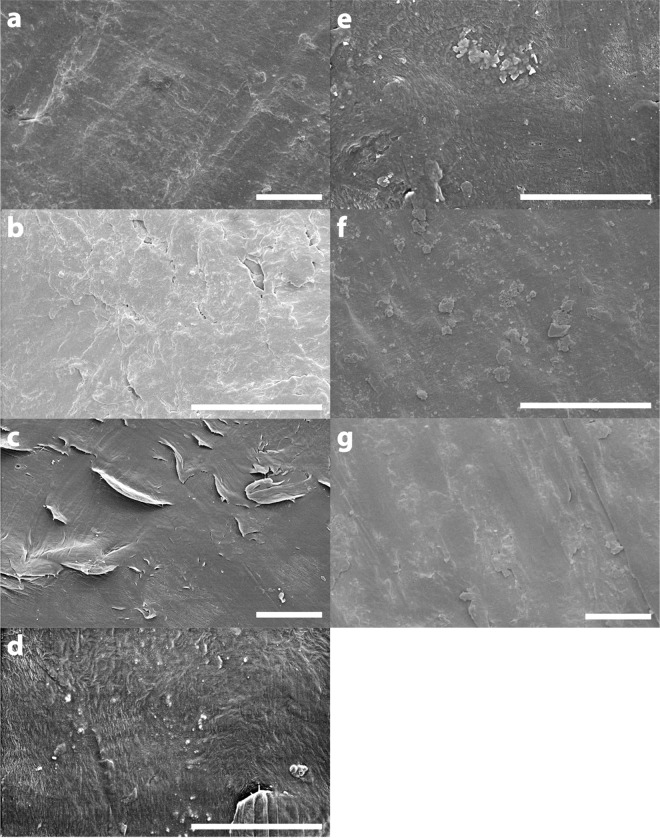
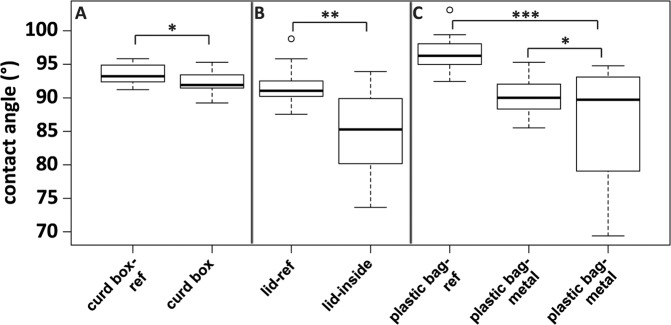
The fate of plastic debris entering the oceans is largely unconstrained. Currently, intensified research is devoted to the abiotic and microbial degradation of plastic floating near the ocean surface for an extended period of time. In contrast, the impacts of environmental conditions in the deep sea on polymer properties and rigidity are virtually unknown. Here, we present unique results of plastic items identified to have been introduced into deep-sea sediments at a water depth of 4150 m in the eastern equatorial Pacific Ocean more than two decades ago. The results, including optical, spectroscopic, physical and microbial analyses, clearly demonstrate that the bulk polymer materials show no apparent sign of physical or chemical degradation. Solely the polymer surface layers showed reduced hydrophobicity, presumably caused by microbial colonization. The bacterial community present on the plastic items differed significantly (p < 0.1%) from those of the adjacent natural environment by a dominant presence of groups requiring steep redox gradients (Mesorhizobium, Sulfurimonas) and a remarkable decrease in diversity. The establishment of chemical gradients across the polymer surfaces presumably caused these conditions. Our findings suggest that plastic is stable over extended times under deep-sea conditions and that prolonged deposition of polymer items at the seafloor may induce local oxygen depletion at the sediment-water interface.
Overview
The claims and statistics of this paper haven’t been checked yet.
Run the check — free, no account needed. It reads the open-access text and checks the sources it cites.
Integrity signals
Registry
Cites
Statistics
Figures
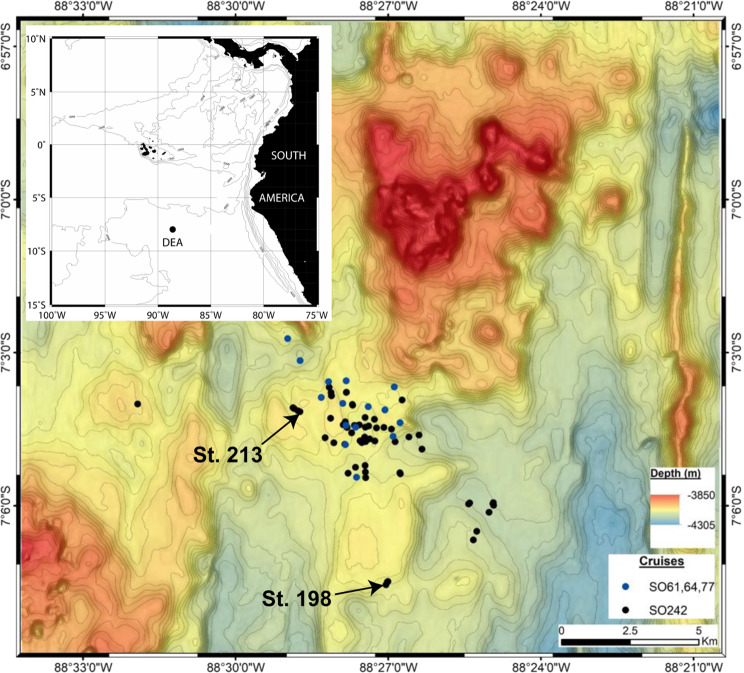
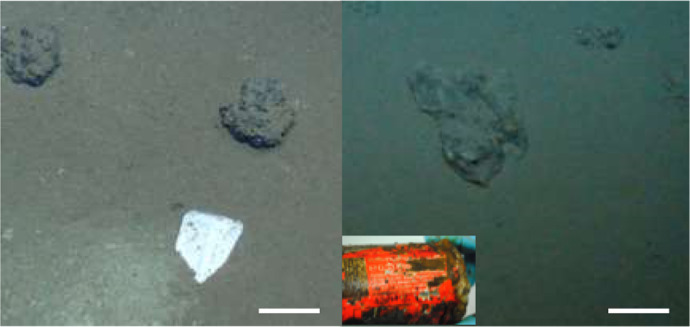
Verification
Claims the paper makes
The claims and statistics of this paper haven’t been checked yet.
Run the check — free, no account needed. It reads the open-access text and checks the sources it cites.
Claims other papers make about this one
Each is checked against this paper’s own text: does it say what the citing paper says it does?
In the citing paper
“Plastic material was found in the ocean that has apparently stayed intact in the marine environment for decades.125”
From The fate of plastic in the ocean environment – a minireview (2021) · cites this paper as [125]
In the citing paper
“Intact plastic material was oen found in environments that are conducive for organic matter preservation, e.g.cold 125 or anoxic habitats 126 (and to a lesser degree in warm and oxic environments).”
From The fate of plastic in the ocean environment – a minireview (2021) · cites this paper as [125]
Self-check
Percentages, sums and reported differences re-computed from the paper’s own numbers.
The self-check needs the paper’s full text.
Citations
Cites
1 retracted
Lewis, E. L. V., Duckett, R. A., Ward, I. M., Fairclough, J. P. A., & Ryan, A. J. (2003) · Polymer · doi:10.1016/s0032-3861(02)00933-3 · Cited by 26
RetractedR: A Language and Environment for Statistical Computing
R Core Team (2000) · doi:10.32614/r.manuals · Cited by 355,893
Trimmomatic: a flexible trimmer for Illumina sequence data
Bolger, A. M., Lohse, M., & Usadel, B. (2014) · Bioinformatics · doi:10.1093/bioinformatics/btu170 · Cited by 65,548
Cutadapt removes adapter sequences from high-throughput sequencing reads
Martin, M. (2011) · EMBnet.journal · doi:10.14806/ej.17.1.200 · Cited by 33,889
ggplot2: Elegant Graphics for Data Analysis
Wickham, H. (2009) · doi:10.1007/978-0-387-98141-3 · Cited by 14,447
The Proceedings of the National Academy of Sciences
Richards, J. W. (1915) · Science · doi:10.1126/science.42.1074.161 · Cited by 13,941
A new method for non-parametric multivariate analysis of variance
Anderson, M. J. (2001) · Austral Ecology · doi:10.1111/j.1442-9993.2001.01070.pp.x · Cited by 13,828
Plastic waste inputs from land into the ocean
Jambeck, J. R., Geyer, R., Wilcox, C., Siegler, T. R., Perryman, M., Andrady, A., Narayan, R., & Law, K. L. (2015) · Science · doi:10.1126/science.1260352 · Cited by 13,163
International Journal of Molecular Sciences
Soni, N., Ross, A., Nookaew, I., Scheers, N., Gabrielsson, B., & Sandberg, A.-S. (2024) · International Journal of Molecular Sciences · doi:10.3390/ijms · Cited by 10,136
Klindworth, A., Pruesse, E., Schweer, T., Peplies, J., Quast, C., Horn, M., & Glöckner, F. O. (2013) · Nucleic Acids Research · doi:10.1093/nar/gks808 · Cited by 8,850
Research works printed but not linked: 3
- Grassie, N. & Scott, G. Polymer degradation & stabilization. (Cambridge University Press, 1998).
- Wypych, G. Handbook of polymers. (Elsevier, 2016).
- Elhariry, H. M. Biofilm formation by endospore-forming bacilli on plastic surface under some food-related and environmental stress conditions. Global J Biotechnol Biochem 3, 69–78 (2008).
Cited by
Sorted by citations
Plastic biodegradation: frontline microbes and their enzymes
Amobonye, A., Bhagwat, P., Singh, S., & Pillai, S. (2021) · Science of The Total Environment · doi:10.1016/j.scitotenv.2020.143536 · Cited by 738
The fate of plastic in the ocean environment – a minireview
Wayman, C., & Niemann, H. (2021) · Environmental Science: Processes & Impacts · doi:10.1039/d0em00446d · Cited by 325
Alimi, O. S., Claveau-Mallet, D., Kurusu, R. S., Lapointe, M., Bayen, S., & Tufenkji, N. (2021) · Journal of Hazardous Materials · doi:10.1016/j.jhazmat.2021.126955 · Cited by 334
Toxic Chemicals and Persistent Organic Pollutants Associated with Micro-and Nanoplastics Pollution
Okoye, C. O., Addey, C. I., Oderinde, O., Okoro, J. O., Uwamungu, J. Y., Chukwudozie, K. I., Okeke, E. S., Ejeromedoghene, O., & Odii, E. C. (2022) · Chemical Engineering Journal Advances · doi:10.1016/j.ceja.2022.100310 · Cited by 275
Horton, A. A., & Barnes, D. K. A. (2020) · The Science of The Total Environment · doi:10.1016/j.scitotenv.2020.140349 · Cited by 240
Microplastics destabilize lipid membranes by mechanical stretching
Fleury, J., & Baulin, V. A. (2021) · Proceedings of the National Academy of Sciences · doi:10.1073/pnas.2104610118 · Cited by 200
Arpia, A. A., Chen, W., Ubando, A. T., Naqvi, S. R., & Culaba, A. B. (2021) · Journal of Hazardous Materials · doi:10.1016/j.jhazmat.2021.126381 · Cited by 161
The potential role of marine fungi in plastic degradation – a review
Zeghal, E., Vaksmaa, A., Vielfaure, H., Boekhout, T., & Niemann, H. (2021) · Frontiers in Marine Science · doi:10.3389/fmars.2021.738877 · Cited by 155
Wang, P.-Y., Zhao, Z., Xiong, X., Wang, N., Zhou, R., Zhang, Z., Ding, F., Hao, M., Wang, S., Ma, Y., et al. (2023) · Water Research · doi:10.1016/j.watres.2023.120581 · Cited by 137
Pozzebon, E. A., & Seifert, L. (2023) · Environmental Health · doi:10.1186/s12940-023-01008-4 · Cited by 139
Sanz‐Lázaro, C., Casado-Coy, N., & Sanahuja, A. B. (2020) · The Science of The Total Environment · doi:10.1016/j.scitotenv.2020.143978 · Cited by 110
Payanthoth, N. S., Mut, N. N. N., Samanta, P., Li, G., & Jung, J. (2024) · Applied Biological Chemistry · doi:10.1186/s13765-024-00959-7 · Cited by 114
Li, S., Yang, Y., Yang, S.-S., Zheng, H., Zheng, Y., Jun, M., Nagarajan, D., Varjani, S., & Chang, J. (2023) · Chemosphere · doi:10.1016/j.chemosphere.2023.138776 · Cited by 99
Tuvo, B., Scarpaci, M., Bracaloni, S., Esposito, E., Costa, A. L., Ioppolo, M., & Casini, B. (2023) · International Journal of Environmental Research and Public Health · doi:10.3390/ijerph20105868 · Cited by 103
Moyal, J., Dave, P. H., Wu, M., Karimpour, S., Brar, S. K., Zhong, H., & Kwong, R. W. M. (2023) · Reviews of Environmental Contamination and Toxicology · doi:10.1007/s44169-023-00035-z · Cited by 102
Huang, S., Guo, T., Feng, Z., Li, B., Cai, Y., Ouyang, D., Gustave, W., Ying, C., & Zhang, H. (2023) · Journal of Hazardous Materials · doi:10.1016/j.jhazmat.2023.131391 · Cited by 88
Agostini, L., Moreira, J. C. F., Bendia, A. G., Kmit, M. C. P., Waters, L. G., Santana, M., Sumida, P. Y. G., Turra, A., & Pellizari, V. H. (2021) · The Science of The Total Environment · doi:10.1016/j.scitotenv.2021.148335 · Cited by 85
Alimi, O. S., Claveau-Mallet, D., Lapointe, M., Biu, T., Liu, L., Hernandez, L. M., Bayen, S., & Tufenkji, N. (2023) · Journal of Hazardous Materials · doi:10.1016/j.jhazmat.2023.131855 · Cited by 86
Stakeholder alliances are essential to reduce the scourge of plastic pollution
Lampitt, R. S., Fletcher, S., Cole, M., Kloker, A., Krause, S., O’Hara, F., Ryde, P., Saha, M., Voronkova, A., & Whyle, A. (2023) · Nature Communications · doi:10.1038/s41467-023-38613-3 · Cited by 87
Self-citationOberbeckmann, S., Bartosik, D., Huang, S., Werner, J., Hirschfeld, C., Wibberg, D., Heiden, S. E., Bunk, B., Overmann, J., Becher, D., et al. (2021) · Environmental Microbiology · doi:10.1111/1462-2920.15531 · Cited by 79
Polyethylene degradation and assimilation by the marine yeast Rhodotorula mucilaginosa
Vaksmaa, A., Polerecky, L., Dombrowski, N., Kienhuis, M. V. M., Posthuma, I., Gerritse, J., Boekhout, T., & Niemann, H. (2023) · ISME Communications · doi:10.1038/s43705-023-00267-z · Cited by 73
Estimating global marine surface microplastic abundance: systematic literature review
Bohdan, K. (2022) · The Science of The Total Environment · doi:10.1016/j.scitotenv.2022.155064 · Cited by 70
Borthakur, A., Leonard, J., Koutnik, V. S., Ravi, S., & Mohanty, S. K. (2021) · Current Opinion in Environmental Science & Health · doi:10.1016/j.coesh.2021.100309 · Cited by 68
Detection and degradation of microplastics in the environment: a review
Yousafzai, S., Farid, M., Zubair, M., Naeem, N., Zafar, W., Asam, Z. U. Z., Farid, S., & Ali, S. (2025) · Environmental Science Advances · doi:10.1039/d5va00064e · Cited by 76
Understanding challenges associated with plastic and bacterial approach toward plastic degradation
Sharma, H., & Neelam, D. K. (2022) · Journal of Basic Microbiology · doi:10.1002/jobm.202200428 · Cited by 66
Tan, J. Z., Ortega, M., Miller, S. A., Hullfish, C. W., Kim, H., Kim, S., Hu, W., Hu, J. Z., Lercher, J. A., Koel, B. E., et al. (2024) · ACS Catalysis · doi:10.1021/acscatal.4c01213 · Cited by 58
Role of Microplastics in Global Warming and Climate Change: A Review
Parvez, M. S., Ullah, H., Faruk, O., Simon, E., & Czédli, H. M. (2024) · Water Air & Soil Pollution · doi:10.1007/s11270-024-07003-w · Cited by 65
Gilman, E. L., Humberstone, J., Wilson, J. R., Chassot, E., Jackson, A., & Suuronen, P. (2022) · Marine Policy · doi:10.1016/j.marpol.2022.105097 · Cited by 46
Coons, A., Busch, K., Lenz, M., Hentschel, U., & Borchert, E. (2021) · PeerJ · doi:10.7717/peerj.12135 · Cited by 40
Li, W., Chen, X., Cai, Z., Li, M., Liu, Z., Gong, H., & Yan, M. (2022) · Environmental Pollution · doi:10.1016/j.envpol.2022.119385 · Cited by 39
Lv, S., Wang, Q., Li, Y., Gu, L., Hu, R., Chen, Z., & Shao, Z. (2024) · The Science of The Total Environment · doi:10.1016/j.scitotenv.2024.174857 · Cited by 38
Wettability after Artificial and Natural Weathering of Polyethylene Terephthalate
Benke, A., Sonnenberg, J., Oelschlägel, K., Schneider, M., Lux, M., & Potthoff, A. (2022) · Environments · doi:10.3390/environments9110134 · Cited by 41
Kane, I., & Fildani, A. (2021) · Geology · doi:10.1130/focus052021.1 · Cited by 37
Microbial Degradation of Marine Plastics: Current State and Future Prospects
Vaksmaa, A., Hernando-Morales, V., Zeghal, E., & Niemann, H. (2021) · Biotechnology for Sustainable Environment · doi:10.1007/978-981-16-1955-7_5 · Cited by 50
Zhang, C., Mu, Y., Li, T., Jin, F., Jin, C., Oh, H., Lee, H., & Jin, L. (2023) · Frontiers in Microbiology · doi:10.3389/fmicb.2023.1181967 · Cited by 42
Vaksmaa, A., Egger, M., Lüke, C., Martins, P. D., Rosselli, R., Asbun, A. A., & Niemann, H. (2022) · Marine Pollution Bulletin · doi:10.1016/j.marpolbul.2022.113949 · Cited by 36
Rahman, I., Mujahid, A., Palombo, E. A., & Müller, M. (2021) · Marine Pollution Bulletin · doi:10.1016/j.marpolbul.2021.112226 · Cited by 33
Beck, A. J., Kaandorp, M., Hamm, T., Bogner, B., Kossel, E., Lenz, M., Haeckel, M., & Achterberg, E. P. (2023) · Analytical and Bioanalytical Chemistry · doi:10.1007/s00216-023-04634-6 · Cited by 34
Self-citationExploring Deep Learning for Underwater Plastic Debris Detection and Monitoring
Khriss, A., Elmiad, A. K., Badaoui, M., Barkaoui, A.-E., & Zarhloule, Y. (2024) · Journal of Ecological Engineering · doi:10.12911/22998993/187970 · Cited by 32
Cloux, S., Allen-Perkins, S., de Pablo, H., Garaboa-Paz, D., Montero, P., & Pérez-Muñuzuri, V. (2021) · The Science of The Total Environment · doi:10.1016/j.scitotenv.2022.153338 · Cited by 32
Delacuvellerie, A., Ballerini, T., Frère, L., Matallana‐Surget, S., Dumontet, B., & Wattiez, R. (2022) · Marine Pollution Bulletin · doi:10.1016/j.marpolbul.2022.113660 · Cited by 33
Kelly, M. R., Whitworth, P., Jamieson, A. J., & Burgess, J. G. (2022) · Environmental Pollution · doi:10.1016/j.envpol.2022.119314 · Cited by 36
The dynamics of plastic pellets on sandy beaches: A new methodological approach
Ferreira, A. T. D. S., Siegle, E., Ribeiro, M. C. H., Santos, M. S. T., & Grohmann, C. H. (2020) · Marine Environmental Research · doi:10.1016/j.marenvres.2020.105219 · Cited by 30
Ru-Catalyzed Polyethylene Hydrogenolysis under Quasi-Supercritical Conditions
Kim, S., Yang, B., Gutiérrez, O. Y., Zhang, W., Lizandara‐Pueyo, C., Ingale, P., Jevtovikj, I., Grauke, R., Szanyi, J., Wang, H., et al. (2025) · JACS Au · doi:10.1021/jacsau.5c00006 · Cited by 31
Chigwada, A. D., Ogola, H. J. O., & Tekere, M. (2023) · Microbiological Research · doi:10.1016/j.micres.2023.127425 · Cited by 26
Chaudhary, P., Singh, R., Shabin, M., Sharma, A., Bhatt, S., Sinha, V., & Sinha, B. (2022) · Environmental Pollution · doi:10.1016/j.envpol.2022.119897 · Cited by 24
Moore, E., & Colbert, D. M. (2024) · Sustainability · doi:10.3390/su16167175 · Cited by 26
Biodegradable fishing gears: A potential solution to ghost fishing and marine plastic pollution
Wataniyakun, W., Gall, M. L., Rakwe, M. E., Karl, C. W., & Larsen, R. B. (2025) · Marine Pollution Bulletin · doi:10.1016/j.marpolbul.2025.117607 · Cited by 23
Degradation of Microplastics in the Environment
Corcoran, P. L. (2020) · Springer eBooks · doi:10.1007/978-3-030-10618-8_10-1 · Cited by 30
Giannattasio, A., Iuliano, V., Oliva, G., Giaquinto, D., Capacchione, C., Cuomo, M. T., Hasan, S. W., Choo, K., Korshin, G. V., Barceló, ., et al. (2024) · Environment International · doi:10.1016/j.envint.2024.108839 · Cited by 23
Rizzo, M., Corbau, C., Lane, B., Malkin, S. Y., Bezzi, V., Vaccaro, C., & Nardin, W. (2021) · Marine Pollution Bulletin · doi:10.1016/j.marpolbul.2021.112510 · Cited by 22
Retrieval operations of derelict fishing gears give insight on the impact on marine life
Vodopia, D., Verones, F., Askham, C., & Larsen, R. B. (2024) · Marine Pollution Bulletin · doi:10.1016/j.marpolbul.2024.116268 · Cited by 22
Status and Enhancement Techniques of Plastic Waste Degradation in the Environment: A Review
Niu, Y., Pan, F., Shen, K., Yang, X., Niu, S., Xu, X., Zhou, H., Fu, Q., & Li, X. (2024) · Sustainability · doi:10.3390/su16219395 · Cited by 27
Stevenson, E. M., Rushby-Jones, O., Buckling, A. G. J., Cole, M., Lindeque, P. K., & Murray, A. K. (2024) · Microbiology · doi:10.1099/mic.0.001506 · Cited by 17
Buron-Moles, G., Vandenbossche, V., Gorret, N., Santonja‐Blasco, L., González-Aranda, T., Cameleyre, X., & Guillouet, S. (2025) · Polymer Degradation and Stability · doi:10.1016/j.polymdegradstab.2025.111292 · Cited by 17
Deng, H., Fu, Y., Su, L., Chen, D., Deng, X., Hu, B. H., Chen, Y., & Deng, Y. (2025) · Journal of Hazardous Materials · doi:10.1016/j.jhazmat.2025.137537 · Cited by 22
How long for plastics to decompose in the deep sea?
Zhang, X., & Peng, X. (2022) · Geochemical Perspectives Letters · doi:10.7185/geochemlet.2222 · Cited by 16
Polymer material biodegradation in the deep sea. A review
Chamley, A., Baley, C., Matabos, M., Vannier, P., Sarradin, P. M., Freyermouth, F., & Davies, P. (2024) · The Science of The Total Environment · doi:10.1016/j.scitotenv.2024.177637 · Cited by 17
Foraminifera and plastic pollution: Knowledge gaps and research opportunities
Bouchet, V. M. P., Seuront, L., Tsujimoto, A., Richirt, J., Frontalini, F., Tsuchiya, M., Matsuba, M., & Nomaki, H. (2023) · Environmental Pollution · doi:10.1016/j.envpol.2023.121365 · Cited by 15
Mallek, M., & Barceló, . (2025) · Advances in Sample Preparation · doi:10.1016/j.sampre.2025.100178 · Cited by 16
Time: A Key Driver of Uncertainty When Assessing the Risk of Environmental Plastics to Human Health
Halden, R. U., Rolsky, C. B., & Khan, F. R. (2021) · Environmental Science & Technology · doi:10.1021/acs.est.1c02580 · Cited by 15
Hemicellulose Application for the Production of Bioplastics and Biomaterials
Macedo, J. V. C., Martins, J. R., Abe, M. M., Branciforti, M. C., & Brienzo, M. (2022) · Clean Energy Production Technologies · doi:10.1007/978-981-16-3682-0_8 · Cited by 13
New Opportunities and Untapped Scientific Potential in the Abyssal Ocean
Marlow, J. J., Anderson, R. E., Reysenbach, A., Seewald, J. S., Shank, T. M., Teske, A., Wanless, V. D., & Soule, S. A. (2022) · Frontiers in Marine Science · doi:10.3389/fmars.2021.798943 · Cited by 12
Cloux, S., Pérez, P., de Pablo, H., & Pérez-Muñuzuri, V. (2024) · Marine Pollution Bulletin · doi:10.1016/j.marpolbul.2024.117110 · Cited by 11
Biotic and Abiotic Factors Affecting Microplastic Degradation and Deposition
Dudek, K. L., Polidoro, B., & Neuer, S. (2024) · Marine Environmental Research · doi:10.1016/j.marenvres.2025.107432 · Cited by 13
Effects of Different Types of Microplastics on Cold Seep Microbial Diversity and Function
Wu, X., Feng, J., Chen, X., Lin, Y.-L., Huang, Y., Zhong, S. Y., Li, C., Zhu, M.-Z., & Zhang, S. (2025) · Environmental Science & Technology · doi:10.1021/acs.est.4c08102 · Cited by 11
Density and distribution patterns of seafloor macrolitter in the eastern Red Sea
Martynova, A., Rodrigue, M., Pieribone, V. A., Qurban, M., & Duarte, C. M. (2024) · The Science of The Total Environment · doi:10.1016/j.scitotenv.2024.176042 · Cited by 10
Separation and degradation techniques for microplastics in soil environments
Xu, Y., Zhang, P., Zhang, R., Qu, C., Yuan, Y., Hui, K., Sun, J., & Tan, W. (2025) · Journal of Water Process Engineering · doi:10.1016/j.jwpe.2025.107302 · Cited by 10
Guidelines toward ecologically-informed bioprospecting for microbial plastic degradation
Cai, F. M., Jiang, S., Daly, P., Bakhshi, M., Cartwright, K., & Druzhinina, I. S. (2025) · Biotechnology Advances · doi:10.1016/j.biotechadv.2025.108590 · Cited by 9
Ronda, A. C., Adaro, M. E., Villar-Muñoz, L., Tomba, J. P., & Baldrighi, E. (2025) · Marine Pollution Bulletin · doi:10.1016/j.marpolbul.2025.117945 · Cited by 8
Tziourrou, P., Vakros, J., & Karapanagioti, H. K. (2023) · Environmental Science and Pollution Research · doi:10.1007/s11356-023-27163-2 · Cited by 8
Diagnostic toolbox for plastisphere studies: A review
Shruti, V. C., Kutralam-Muniasamy, G., & Pérez‐Guevara, F. (2024) · TrAC Trends in Analytical Chemistry · doi:10.1016/j.trac.2024.117996 · Cited by 7
Fu, F., Wang, S., Zhang, X., Xia, Y., Deng, H., Zhao, Y., Zhang, Y., & Ge, C. (2025) · Journal of environmental chemical engineering · doi:10.1016/j.jece.2025.115551 · Cited by 7
Carvalho, L., Lopes, I., Magalhães, S., Cardoso, P., & Venâncio, C. (2025) · Journal of Cleaner Production · doi:10.1016/j.jclepro.2025.146892 · Cited by 6
Neto, J. A. B., Gaylarde, C. C., & da Fonseca, E. M. (2020) · Springer eBooks · doi:10.1007/978-3-030-10618-8_17-1 · Cited by 6
Zepp, R. G., Acrey, B., Davis, M. J. B., Andrady, A. L., Locklin, J., Arnold, R. M., Okungbowa, O., & Commodore, A. (2023) · Journal of Polymers and the Environment · doi:10.1007/s10924-023-02864-4 · Cited by 6
Burkett, A. M., Rathburn, A. E., Acevedo, A. G., Acevedo, C. G., & Ezpeleta, J. (2023) · Marine Ecology Progress Series · doi:10.3354/meps14432 · Cited by 6
Complex microplastics significantly influence the assembly process of lake bacterial communities
Li, M.-J., Xu, X., Wang, J., Deng, L., Wu, Z., Yang, D., Qian, X., & Fan, Y. (2024) · Journal of Hazardous Materials · doi:10.1016/j.jhazmat.2024.135867 · Cited by 6
Tang, X., Liu, Y., Yang, W., Wu, Y., Yong, T., Liu, W., Lv, F., Hussain, K., Wang, Y., Gao, X., et al. (2025) · Ecotoxicology and Environmental Safety · doi:10.1016/j.ecoenv.2025.118499 · Cited by 5
Schmidt, N., Foscari, A., Herzke, D., Garel, M., Tamburini, C., Seiwert, B., Reemtsma, T., & Sempéré, R. (2025) · Environmental Science & Technology · doi:10.1021/acs.est.5c10705 · Cited by 5
Toxicological Impacts and Microbial-Mediated Degradation Processes of Microplastics
Hansda, A., Chand, S. K., Pradhan, B., Chand, S., Shukla, A. K., & Rout, P. R. (2024) · Journal of Hazardous Toxic and Radioactive Waste · doi:10.1061/jhtrbp.hzeng-1400 · Cited by 5
Current Research on Microbe-Plastic Interactions in the Marine EnvironmentPreprint
Latva, M., Zadjelovic, V., & Wright, R. (2021) · Preprints.org · doi:10.20944/preprints202107.0273.v1 · Cited by 4
Microbial bioremediation of polythene and plastics: a green sustainable approach
Tari, V. S., & Kannan, K. (2022) · Elsevier eBooks · doi:10.1016/b978-0-323-90452-0.00003-7 · Cited by 4
Agarwalla, A., Ahmed, W. K., Al-Marzouqi, A. H., Rizvi, T. A., Zaneldin, E. K., & Khan, M. A. (2024) · Buildings · doi:10.3390/buildings14061717 · Cited by 3
Advances in Microbial Bioremediation of Microplastics in Mangrove Sediments: a Comprehensive Review
Javed, M. S., Adil, M., Zhang, J., Gul, I., Rauf, M., Ahmad, S., Bushra, M., Lu, S., Lu, H., Gormani, A. H., et al. (2025) · Water Air & Soil Pollution · doi:10.1007/s11270-025-08571-1 · Cited by 3
Effects of Biofouling on the Sinking Behavior of Microplastics in Aquatic Environments
Halsband, C. (2022) · Springer eBooks · doi:10.1007/978-3-030-39041-9_12 · Cited by 4
Goudriaan, M., Zeghal, E., Witte, H. J., Vaksmaa, A., & Niemann, H. (2024) · Environmental Advances · doi:10.1016/j.envadv.2024.100518 · Cited by 3
Shadap, M., & Ayyasamy, S. (2026) · Springer series on polymer and composite materials · doi:10.1007/978-3-032-16034-8_27 · Cited by 2
Barwant, M. M., Ali, U. M., & Tolani, T. R. (2026) · Frontiers in Earth Science · doi:10.3389/feart.2026.1752600 · Cited by 2
Li, N., Zhong, B., Wu, W., Mei, X., Liu, R., Liu, X., Li, X., Abdul, R., Yi, S., Zhou, L., et al. (2026) · Journal of Environmental Sciences · doi:10.1016/j.jes.2026.05.048 · Cited by 2
Effects of Biofouling on the Sinking Behavior of Microplastics in Aquatic Environments
Halsband, C. (2021) · Springer eBooks · doi:10.1007/978-3-030-10618-8_12-1 · Cited by 2
Neto, J. A. B., Gaylarde, C. C., & da Fonseca, E. M. (2022) · Springer eBooks · doi:10.1007/978-3-030-39041-9_17 · Cited by 2
Cuvelier, D., Ramalho, S. P., Purser, A., & Haeckel, M. (2022) · Marine Pollution Bulletin · doi:10.1016/j.marpolbul.2022.114162 · Cited by 2
Self-citationNewrick, B. A., Laca, A., & Laca, A. (2024) · Ingeniería del agua · doi:10.4995/ia.2024.21599 · Cited by 3
Corcoran, P. L. (2024) · Elsevier eBooks · doi:10.1016/b978-0-443-14082-2.00028-4 · Cited by 3
Goudriaan, M., Ndhlovu, R., Brouwer, M., Vreugdenhil, S., van der Meer, M. V. D., & Niemann, H. (2025) · Marine Pollution Bulletin · doi:10.1016/j.marpolbul.2025.117787 · Cited by 3
Bhalerao, A., Düker, U., Weber, M., Eich, A., Lott, C., Lecinski, J., Endres, H., & Nogueira, R. (2025) · Heliyon · doi:10.1016/j.heliyon.2025.e43530 · Cited by 2
Beck, A. J. (2021) · Helmholtz Centre for Ocean Research Kiel (GEOMAR) · doi:10.3289/cr_so279 · Cited by 2
MacNeil, C., Baker, M., Copley, J., Tyler, P. A., Hilário, A., & Ramírez-Llodra, E. (2025) · Marine Biology · doi:10.1007/s00227-025-04648-x · Cited by 1
(Bio-)Degradation of Plastic in the Environment
Lott, C., Kabasci, S., Merrettig‐Bruns, U., & Weber, M. (2025) · Springer handbooks · doi:10.1007/978-3-031-66209-6_39 · Cited by 1
Metadata
- Authors
- Krause, S., Molari, M., Gorb, E. V., Gorb, S. N., Kossel, E., & Haeckel, M.
- Affiliations
- GEOMAR Helmholtz Centre for Ocean Research Kiel (DE)
- Max Planck Society (DE)
- Christian-Albrechts-Universität zu Kiel (DE)
- Corresponding author
- Krause, S.
- Venue
- Scientific Reports
- Published
- 2020-06-11
- Volume
- 10
- Issue
- 1
- Pages
- 9484-9484
- ISSN
- 2045-2322 (ISSN-L)
- PMC
- PMC7289819
- OpenAlex
- W3035237867
- Cited by
- 125
- References
- 97
- Citations by year
- 2026: 15 · 2025: 23 · 2024: 22 · 2023: 17 · 2022: 18 · 2021: 24 · 2020: 6
- FWCI
- 4.01
- Type
- journal article
- Language
- en
- Open access
- gold
- doi.org
- Locations
- Scientific Reports (publishedVersion, cc-by)
- PubMed Central (publishedVersion, cc-by)
- PubMed (publishedVersion)
- Helmholtz Centre for Ocean Research Kiel (GEOMAR) (submittedVersion)
- Helmholtz-Zentrum für Polar-und Meeresforschung (Alfred-Wegener-Institut) (submittedVersion)
- MPG.PuRe (Max Planck Society) (submittedVersion, other-oa)
- Funders
- Bundesministerium für Bildung und Forschung (03F0707A)
- Topics
- Physical Sciences › Environmental Science › Pollution › Microplastics and Plastic Pollution
- Physical Sciences › Earth and Planetary Sciences › Oceanography › Marine Biology and Ecology Research
- Physical Sciences › Environmental Science › Ecology › Microbial Community Ecology and Physiology
- Keywords
- plastic debris, deep-sea sediments, abyssal seafloor, microbial colonization of plastic, bacterial communities, polymer degradation, hydrophobicity, redox gradients, Sulfurimonas, Mesorhizobium, sediment-water interface, oxygen depletion
- MeSH terms
- Bacteria, Oceans and Seas, Pacific Ocean, Plastics, Seawater, Water Pollutants, Chemical, Geologic Sediments
About these checks
Registry, retraction, Cites and statistics results are computed, not judged, with one exception: a printed reference that no index lists is read once by a model before it counts as a citation error. Claims are extracted by a model and kept only when their quote appears verbatim in the text; each cited source is then checked, with a model’s help, for whether it says what the claim relies on. Those verdicts can be wrong — read the claim’s quote and the cited source before relying on one.
Statistics and arithmetic are recomputed, not judged.
Confidence bands are shown only for fields calibrated on our annotated test set. None is calibrated yet, so no band is shown.
What counts as a claim ›How we measure confidence ›How we check this ›
Are you an author, or do you see a problem with this page? Request a review
