

The DOI matches its Crossref record; 49 of the 50 references it cites were found in a registry or an index.
Early detection of type 2 diabetes mellitus using machine learning-based prediction models
Open accessAbstract
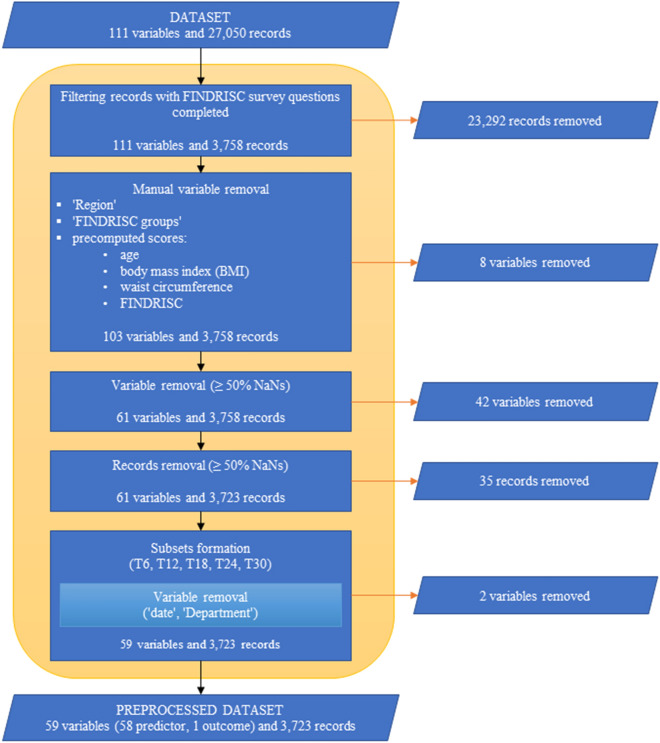
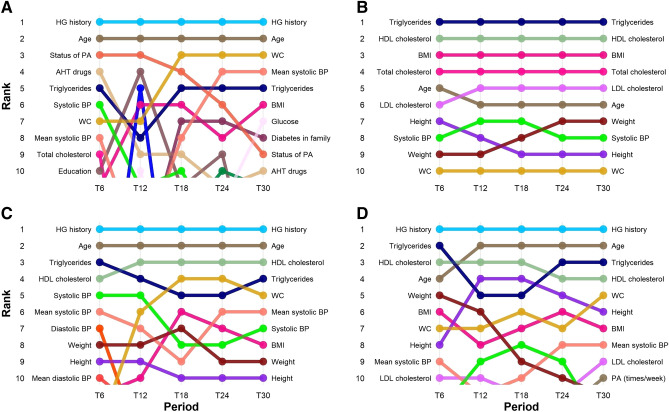
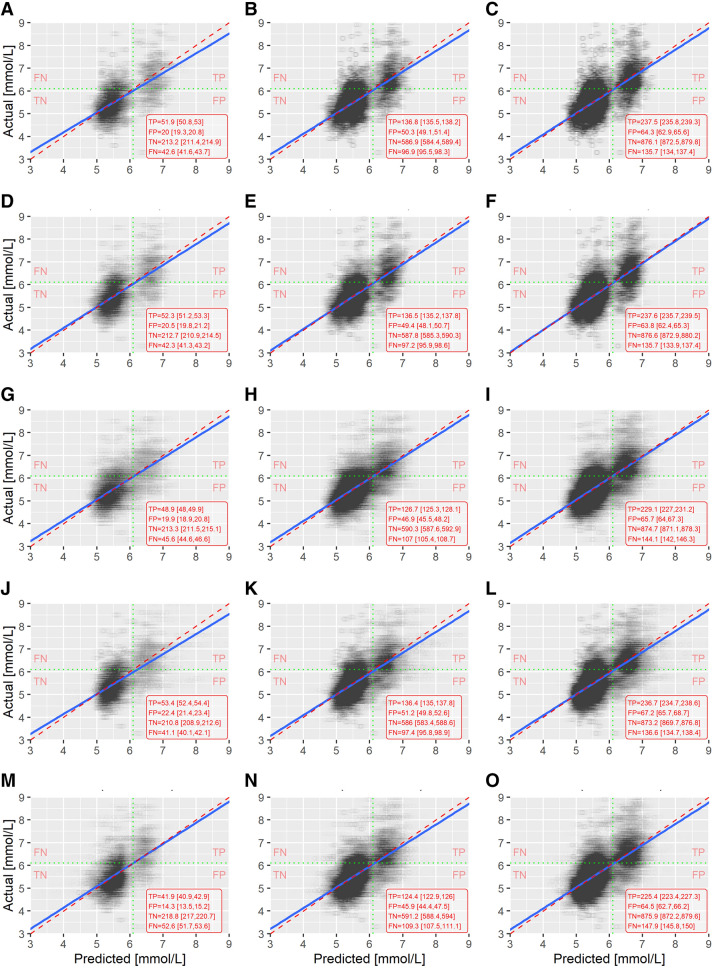
Most screening tests for T2DM in use today were developed using multivariate regression methods that are often further simplified to allow transformation into a scoring formula. The increasing volume of electronically collected data opened the opportunity to develop more complex, accurate prediction models that can be continuously updated using machine learning approaches. This study compares machine learning-based prediction models (i.e. Glmnet, RF, XGBoost, LightGBM) to commonly used regression models for prediction of undiagnosed T2DM. The performance in prediction of fasting plasma glucose level was measured using 100 bootstrap iterations in different subsets of data simulating new incoming data in 6-month batches. With 6 months of data available, simple regression model performed with the lowest average RMSE of 0.838, followed by RF (0.842), LightGBM (0.846), Glmnet (0.859) and XGBoost (0.881). When more data were added, Glmnet improved with the highest rate (+ 3.4%). The highest level of variable selection stability over time was observed with LightGBM models. Our results show no clinically relevant improvement when more sophisticated prediction models were used. Since higher stability of selected variables over time contributes to simpler interpretation of the models, interpretability and model calibration should also be considered in development of clinical prediction models.
Overview
The claims and statistics of this paper haven’t been checked yet.
Run the check — free, no account needed. It reads the open-access text and checks the sources it cites.
Integrity signals
Registry
Cites
Statistics
Figures
Verification
Claims the paper makes
The claims and statistics of this paper haven’t been checked yet.
Run the check — free, no account needed. It reads the open-access text and checks the sources it cites.
Claims other papers make about this one
Each is checked against this paper’s own text: does it say what the citing paper says it does?
The source backs part of the claim, not all of it — or backs it for a different population, condition or comparison.
In the citing paper
“Various studies have shown that AI algorithms can predict the onset of T2D and its complications with remarkable accuracy (13-15).”
From Generative artificial intelligence in predictive analysis of diabetes and its complications: a narrative review (2025) · cites this paper as [14]
Experimental — accuracy not yet measured
Self-check
Percentages, sums and reported differences re-computed from the paper’s own numbers.
The self-check needs the paper’s full text.
Citations
Cites
Breiman, L. (2001) · Machine Learning · doi:10.1023/a:1010933404324 · Cited by 133,538
XGBoost: A Scalable Tree Boosting System
Chen, T., & Guestrin, C. (2016) · Proceedings of the 22nd ACM SIGKDD International Conference on Knowledge Discovery and Data Mining · doi:10.1145/2939672.2939785 · Cited by 54,569
DeLong, E. R., DeLong, D. M., & Clarke-Pearson, D. L. (1988) · Biometrics · doi:10.2307/2531595 · Cited by 22,649
Regularization Paths for Generalized Linear Models via Coordinate Descent
Friedman, J., Hastie, T., & Tibshirani, R. (2010) · Journal of Statistical Software · doi:10.18637/jss.v033.i01 · Cited by 19,927
Classification and Regression by randomForest
Liaw, A. I., & Wiener, M. C. (2007) · Cited by 18,594
mice: Multivariate Imputation by Chained Equations in R
Buuren, S. V., & Groothuis-Oudshoorn, K. (2011) · Journal of Statistical Software · doi:10.18637/jss.v045.i03 · Cited by 13,870
International Diabetes Federation 2017
Carracher, A. M., Marathe, P. H., & Close, K. L. (2018) · Journal of Diabetes · doi:10.1111/1753-0407.12644 · Cited by 13,379
Partial least squares structural equation modeling (PLS-SEM): An emerging tool in business research
F. Hair Jr, J., Sarstedt, M., Hopkins, L., & G. Kuppelwieser, V. (2014) · European Business Review · doi:10.1108/ebr-10-2013-0128 · Cited by 11,728
LightGBM: A Highly Efficient Gradient Boosting Decision Tree
(2017) · HAL · Cited by 10,512
A note on a general definition of the coefficient of determination
NAGELKERKE, N. J. D. (1991) · Biometrika · doi:10.1093/biomet/78.3.691 · Cited by 5,927
Research works printed but not linked: 2
- Ziegel, E. R. & Harville, D. A. Matrix Algebra From a Statisticians Perspective (Springer, New York, 1997).
- Breiman, L. Random forests. Mach. Learn. 45, 5–32. https://doi.org/10.1023/A:1010933404324 (2001). · DOI · Paper page
Cited by
Sorted by citations
Hossain, M. J., Al‐Mamun, M., & Islam, M. R. (2024) · Health Science Reports · doi:10.1002/hsr2.2004 · Cited by 953
Causal machine learning for predicting treatment outcomes
Feuerriegel, S., Frauen, D., Melnychuk, V., Schweisthal, J., Heß, K., Curth, A., Bauer, S., Kilbertus, N., Kohane, I. S., & van der Schaar, M. (2024) · Nature Medicine · doi:10.1038/s41591-024-02902-1 · Cited by 353
Artificial Intelligence in Current Diabetes Management and Prediction
Nomura, A., Noguchi, M., Kometani, M., Furukawa, K., & Yoneda, T. (2021) · Current Diabetes Reports · doi:10.1007/s11892-021-01423-2 · Cited by 183
Machine learning based diabetes prediction and development of smart web application
Ahmed, N., Ahammed, R., Islam, M. M., Uddin, M. A., Akhter, A., Talukder, M. A., & Paul, B. K. (2021) · International Journal of Cognitive Computing in Engineering · doi:10.1016/j.ijcce.2021.12.001 · Cited by 180
Asif, S., Yi, W., Ur-Rehman, S., ul-ain, Q., Amjad, K., Yueyang, Y., Si, J., & Awais, M. (2024) · Archives of Computational Methods in Engineering · doi:10.1007/s11831-024-10148-w · Cited by 203
Metadata
- Authors
- Kopitar, L., Kocbek, P., Cilar, L., Sheikh, A., & Stiglic, G.
- Affiliations
- University of Primorska (SI)
- University of Maribor (SI)
- Brigham and Women's Hospital (US)
- Corresponding author
- Kopitar, Leon
- Venue
- Scientific Reports
- Published
- 2020-07-20
- Volume
- 10
- Issue
- 1
- Pages
- 11981-11981
- ISSN
- 2045-2322 (ISSN-L)
- PMC
- PMC7371679
- OpenAlex
- W3043363778
- Cited by
- 369
- References
- 50
- Citations by year
- 2026: 37 · 2025: 71 · 2024: 77 · 2023: 80 · 2022: 69 · 2021: 32 · 2020: 3
- FWCI
- 40.61
- Type
- journal article
- Language
- en
- Open access
- gold
- doi.org
- Locations
- Scientific Reports (publishedVersion, cc-by)
- PubMed Central (publishedVersion, cc-by)
- PubMed (publishedVersion)
- Edinburgh Research Explorer (University of Edinburgh) (submittedVersion, other-oa)
- Funders
- European Commission (2014‐2020, P2-0057)
- Javna Agencija za Raziskovalno Dejavnost RS (N2-0101, P2-0057)
- Univerza v Mariboru
- European Social Fund (20142020)
- Topics
- Health Sciences › Health Professions › Health Information Management › Artificial Intelligence in Healthcare
- Physical Sciences › Computer Science › Artificial Intelligence › Machine Learning in Healthcare
- Health Sciences › Medicine › Endocrinology, Diabetes and Metabolism › Diabetes Management and Research
- Keywords
- type 2 diabetes, early detection, diabetes screening, prediction model, machine learning, fasting blood glucose, regression models, model interpretability, model calibration, LightGBM, XGBoost, random forest, glmnet
- MeSH terms
- Machine Learning, Blood Glucose, Calibration, Diabetes Mellitus, Type 2, Fasting, Female, Humans, Male, Middle Aged, Models, Biological, Area Under Curve, Early Diagnosis
About these checks
Registry, retraction, Cites and statistics results are computed, not judged, with one exception: a printed reference that no index lists is read once by a model before it counts as a citation error. Claims are extracted by a model and kept only when their quote appears verbatim in the text; each cited source is then checked, with a model’s help, for whether it says what the claim relies on. Those verdicts can be wrong — read the claim’s quote and the cited source before relying on one.
Statistics and arithmetic are recomputed, not judged.
Confidence bands are shown only for fields calibrated on our annotated test set. None is calibrated yet, so no band is shown.
What counts as a claim ›How we measure confidence ›How we check this ›
Are you an author, or do you see a problem with this page? Request a review
