

The DOI matches its Crossref record; 38 of the 38 references it cites were found in a registry or an index.
Radiomics feature reproducibility under inter-rater variability in segmentations of CT images
Open accessAbstract
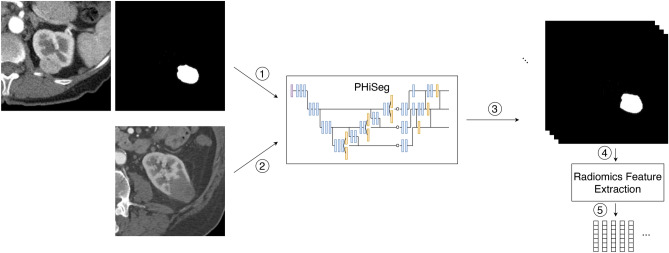
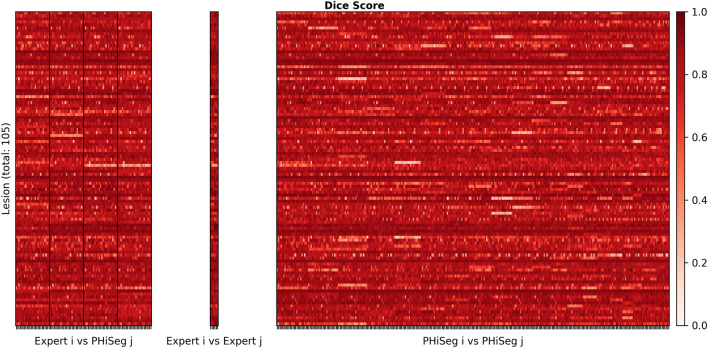
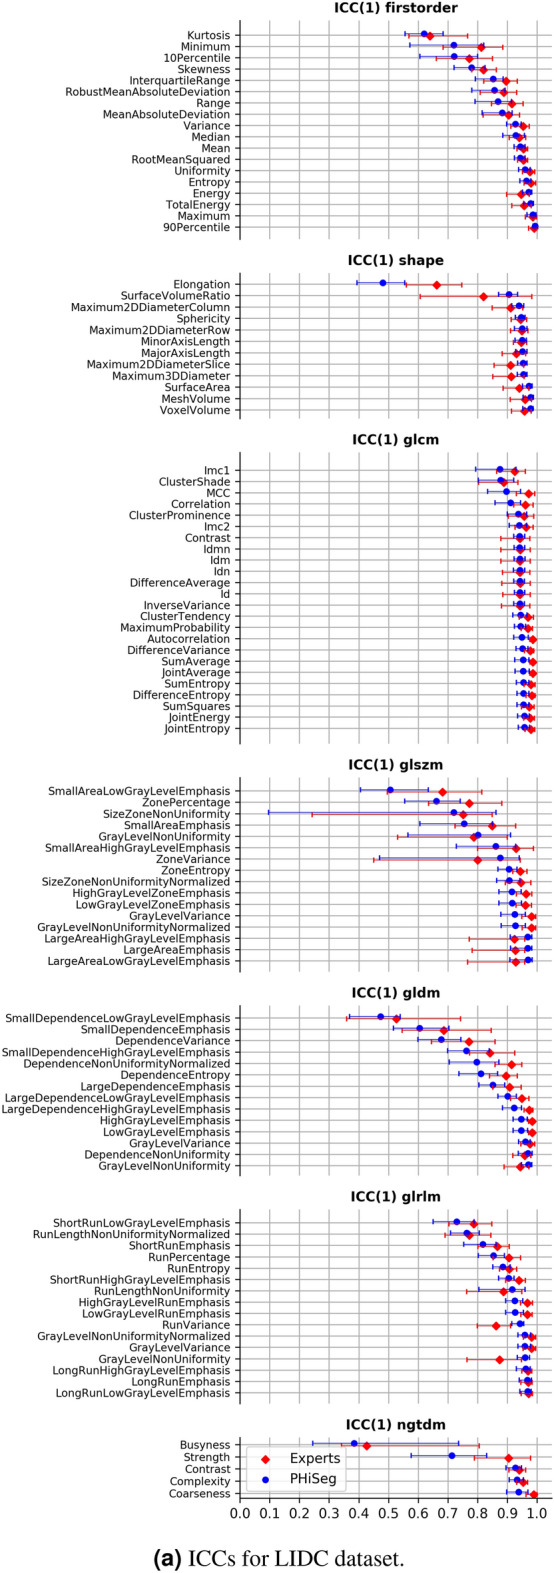
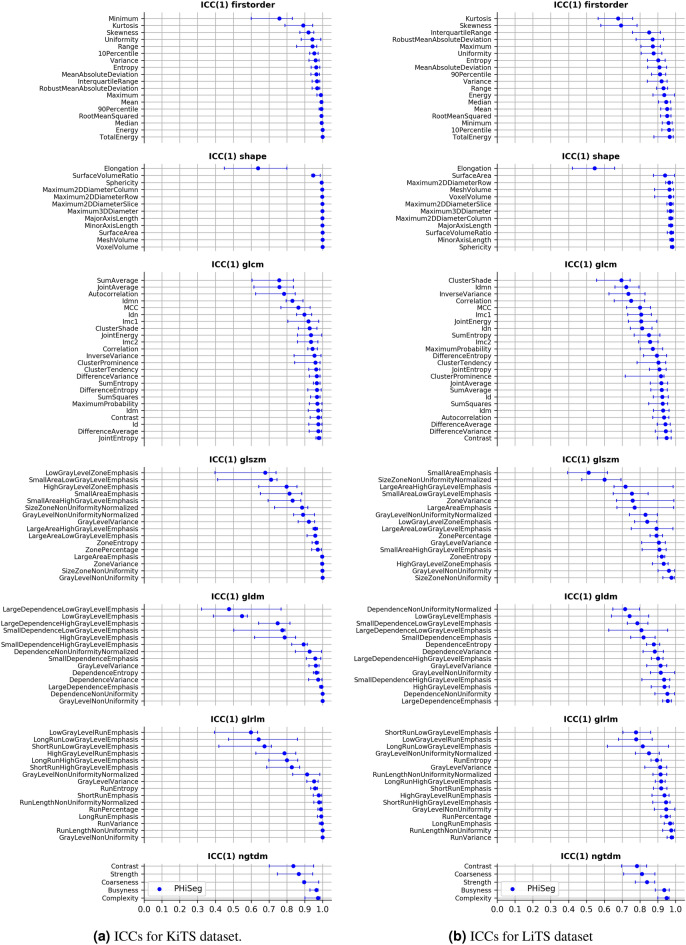
Identifying image features that are robust with respect to segmentation variability is a tough challenge in radiomics. So far, this problem has mainly been tackled in test–retest analyses. In this work we analyse radiomics feature reproducibility in two phases: first with manual segmentations provided by four expert readers and second with probabilistic automated segmentations using a recently developed neural network (PHiseg). We test feature reproducibility on three publicly available datasets of lung, kidney and liver lesions. We find consistent results both over manual and automated segmentations in all three datasets and show that there are subsets of radiomic features which are robust against segmentation variability and other radiomic features which are prone to poor reproducibility under differing segmentations. By providing a detailed analysis of robustness of the most common radiomics features across several datasets, we envision that more reliable and reproducible radiomic models can be built in the future based on this work.
Overview
The claims and statistics of this paper haven’t been checked yet.
Run the check — free, no account needed. It reads the open-access text and checks the sources it cites.
Integrity signals
Registry
Cites
Statistics
Figures
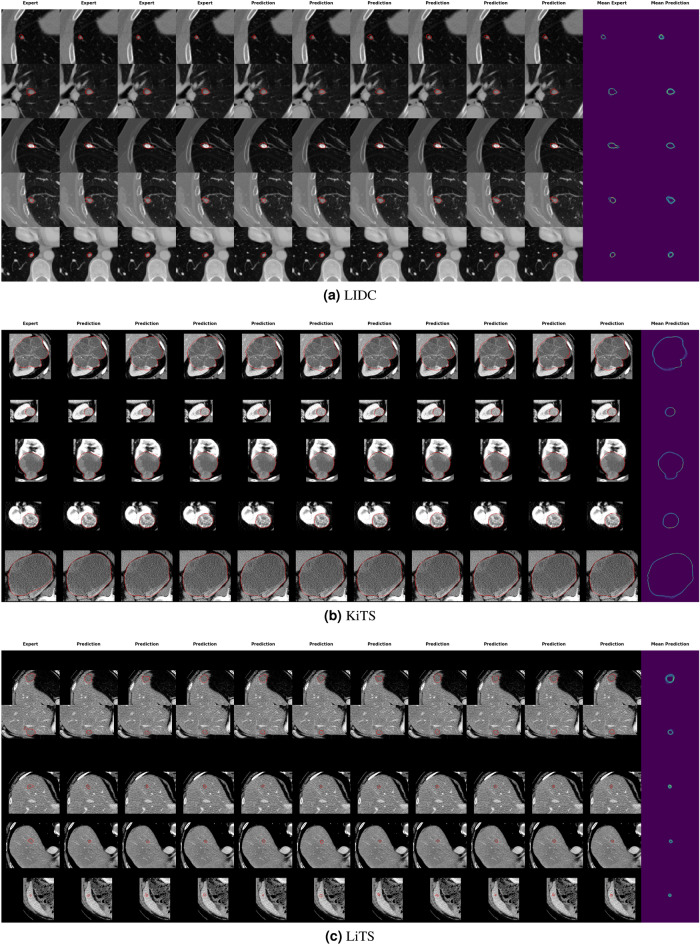
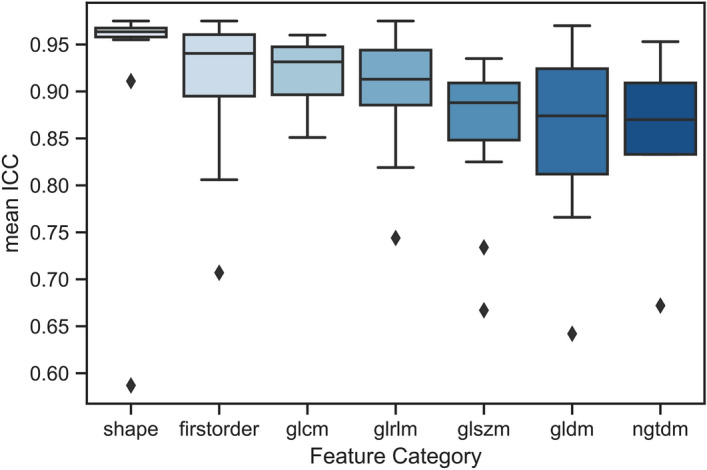
Verification
Claims the paper makes
The claims and statistics of this paper haven’t been checked yet.
Run the check — free, no account needed. It reads the open-access text and checks the sources it cites.
Claims other papers make about this one
Each is checked against this paper’s own text: does it say what the citing paper says it does?
In the citing paper
“Moreover, these statistical features are affected by several confounders, such as inter-reader variability in segmentations26 and acquisition settings of the scanners27, limiting their applicability in diverse settings.”
From Foundation Model for Cancer Imaging Biomarkers (2024) · cites this paper as [26]
Self-check
Percentages, sums and reported differences re-computed from the paper’s own numbers.
The self-check needs the paper’s full text.
Citations
Cites
U-Net: Convolutional Networks for Biomedical Image Segmentation
Ronneberger, O., Fischer, P., & Brox, T. (2015) · Lecture notes in computer science · doi:10.1007/978-3-319-24574-4_28 · Cited by 99,404
A guideline of selecting and reporting intraclass correlation coefficients for reliability research
Koo, T. K., & Li, M. Y. (2016) · Journal of Chiropractic Medicine · doi:10.1016/j.jcm.2016.02.012 · Cited by 31,709
Intraclass correlations: Uses in assessing rater reliability.
Shrout, P. E., & Fleiss, J. L. (1979) · Psychological Bulletin · doi:10.1037/0033-2909.86.2.420 · Cited by 24,532
Advances in neural information processing systems 7
Cios, K. J., & Shields, M. E. (1997) · Neurocomputing · doi:10.1016/s0925-2312(97)90018-7 · Cited by 22,093
Cicchetti, D. V. (1994) · Psychological Assessment · doi:10.1037/1040-3590.6.4.284 · Cited by 9,349 · cited 1×
“Possible choices are the often-used interpretation of defining excellent agreement as ICC > 0.75 36 or the interpretation proposed by Koo and Li 37 , stating that ICC > 0.9 corresponds to excellent agreement.”
MethodInfluentialComputational Radiomics System to Decode the Radiographic Phenotype
(2017) · doi:10.1158/0008-5472.can-17-0339 · Cited by 6,593
Decoding tumour phenotype by noninvasive imaging using a quantitative radiomics approach
Aerts, H. J. W. L., Velazquez, E. R., Leijenaar, R. T. H., Parmar, C., Grossmann, P., Carvalho, S., Bussink, J., Monshouwer, R., Haibe-Kains, B., Rietveld, D., et al. (2014) · Nature Communications · doi:10.1038/ncomms5006 · Cited by 5,132
The Cancer Imaging Archive (TCIA): Maintaining and Operating a Public Information Repository
Clark, K., Vendt, B., Smith, K., Freymann, J., Kirby, J., Koppel, P., Moore, S., Phillips, S., Maffitt, D., Pringle, M., et al. (2013) · Journal of Digital Imaging · doi:10.1007/s10278-013-9622-7 · Cited by 4,599
Zwanenburg, A., Vallières, M., Abdalah, M. A., Aerts, H. J. W. L., Andrearczyk, V., Apte, A., Ashrafinia, S., Bakas, S., Beukinga, R. J., Boellaard, R., et al. (2020) · Radiology · doi:10.1148/radiol.2020191145 · Cited by 4,177
Armato, S. G., McLennan, G., Bidaut, L., McNitt‐Gray, M. F., Meyer, C. R., Reeves, A. P., Zhao, B., Aberle, D. R., Henschke, C. I., Hoffman, E. A., et al. (2011) · Medical Physics · doi:10.1118/1.3528204 · Cited by 2,887
The Liver Tumor Segmentation Benchmark (LiTS)
Bilic, P., Christ, P., Li, H. B., Vorontsov, E., Ben-Cohen, A., Kaissis, G., Szeskin, A., Jacobs, C., Mamani, G. E. H., Chartrand, G., et al. (2023) · Medical Image Analysis · doi:10.1016/j.media.2022.102680 · Cited by 1,412
Self-citationRepeatability and Reproducibility of Radiomic Features: A Systematic Review
Traverso, A., Wee, L., Dekker, A. L. A. J., & Gillies, R. J. (2018) · International Journal of Radiation Oncology*Biology*Physics · doi:10.1016/j.ijrobp.2018.05.053 · Cited by 966
Intraclass correlation – A discussion and demonstration of basic features
Liljequist, D., Elfving, B., & Roaldsen, K. S. (2019) · PLoS ONE · doi:10.1371/journal.pone.0219854 · Cited by 910
Berenguer, R., Pastor-Juan, M. D. R., Canales‐Vázquez, J., Castro‐García, M., Villas, M. V., Legorburo, F. M., & Sabater, S. (2018) · Radiology · doi:10.1148/radiol.2018172361 · Cited by 622
Robust Radiomics Feature Quantification Using Semiautomatic Volumetric Segmentation
Parmar, C., Velazquez, E. R., Leijenaar, R. T. H., Jermoumi, M., Carvalho, S., Mak, R. H., Mitra, S., Shankar, B. U., Kikinis, R., Haibe‐Kains, B., et al. (2014) · PLoS ONE · doi:10.1371/journal.pone.0102107 · Cited by 611
Kickingereder, P., Burth, S., Wick, A., GOETZ, M. A., Eidel, O., Schlemmer, H.-P., Maier-Hein, K. H., Wick, W., Bendszus, M., Radbruch, A., et al. (2016) · Radiology · doi:10.1148/radiol.2016160845 · Cited by 449
A probabilistic u-net for segmentation of ambiguous images
Kohl, S. A. A., Romera-Paredes, B., Meyer, C., De Fauw, J., Ledsam, J. R., Maier-Hein, K. H., Eslami, S. M. A., Rezende, D. J., & Ronneberger, O. (2018) · arXiv · doi:10.48550/arxiv.1806.05034 · Cited by 439
Heller, N. E., Sathianathen, N. J., Kalapara, A. A., Walczak, E. G., Moore, K., Kaluzniak, H., Rosenberg, J. E., Blake, P., Rengel, Z., Oestreich, M., et al. (2019) · arXiv (Cornell University) · doi:10.48550/arxiv.1904.00445 · Cited by 438
Reproducibility and Prognosis of Quantitative Features Extracted from CT Images
Balagurunathan, Y., Gu, Y., Wang, H., Kumar, V., Grove, O., Hawkins, S. K., Kim, J., Goldgof, D. B., Hall, L., Gatenby, R. A., et al. (2014) · Translational Oncology · doi:10.1593/tlo.13844 · Cited by 305
Choe, J., Lee, S. M., Do, K., Lee, G., Lee, J., Lee, S. M., & Seo, J. B. (2019) · Radiology · doi:10.1148/radiol.2019181960 · Cited by 300
Inter-observer variability of manual contour delineation of structures in CT
Joskowicz, L., Cohen, D., Caplan, N., & Sosna, J. (2018) · European Radiology · doi:10.1007/s00330-018-5695-5 · Cited by 296
Peerlings, J., Woodruff, H. C., Winfield, J. M., Ibrahim, A., BEERS, B. E. V., Heerschap, A., Jackson, A., Wildberger, J. E., Mottaghy, F. M., deSouza, N. M., et al. (2019) · Scientific Reports · doi:10.1038/s41598-019-41344-5 · Cited by 267
Assessing robustness of radiomic features by image perturbation
Zwanenburg, A., Leger, S., Agolli, L., Pilz, K., Troost, E. G. C., Richter, C., & Löck, S. (2019) · Scientific Reports · doi:10.1038/s41598-018-36938-4 · Cited by 258
Meyer, M., Ronald, J., Vernuccio, F., Nelson, R. C., Ramirez-Giraldo, J. C., Solomon, J., Patel, B. N., Samei, E., & Marin, D. (2019) · Radiology · doi:10.1148/radiol.2019190928 · Cited by 258
Influence of inter-observer delineation variability on radiomics stability in different tumor sites
Pavic, M., Bogowicz, M., Würms, X., Glatz, S., Finazzi, T., Riesterer, O., Roesch, J., Rudofsky, L., Friess, M., Veit‐Haibach, P., et al. (2018) · Acta Oncologica · doi:10.1080/0284186x.2018.1445283 · Cited by 202
Armato, S. G., III, McLennan, G., Bidaut, L., McNitt-Gray, M. F., Meyer, C. R., Reeves, A. P., Zhao, B., Aberle, D. R., Henschke, C. I., Hoffman, E. A., et al. (2015) · The Cancer Imaging Archive · doi:10.7937/k9/tcia.2015.lo9ql9sx · Cited by 150
Kim, H., Park, C. M., Lee, M., Park, S. J., Song, Y., Lee, J. H., Hwang, E. J., & Goo, J. M. (2016) · PLoS ONE · doi:10.1371/journal.pone.0164924 · Cited by 143
Kalpathy–Cramer, J., Mamomov, A., Zhao, B., Lü, L., Cherezov, D., Napel, S. A., Echegaray, S., Rubin, D. L., McNitt‐Gray, M. F., Lo, P., et al. (2016) · Tomography · doi:10.18383/j.tom.2016.00235 · Cited by 127
Supervised uncertainty quantification for segmentation with multiple annotations
Hu, S., Worrall, D., Knegt, S., Veeling, B., Huisman, H., & Welling, M. (2019) · Lecture Notes in Computer Science · doi:10.1007/978-3-030-32245-8_16 · Cited by 105
Kuhl, C. K., Alparslan, Y., Schmoee, J., Sequeira, B., Keulers, A., Brümmendorf, T. H., & Keil, S. (2018) · Radiology · doi:10.1148/radiol.2018180648 · Cited by 88
Self-citationYamashita, R., Perrin, T., Chakraborty, J., Chou, J. F., Horvat, N., Koszalka, M. A., Midya, A., Gonen, M., Allen, P., Jarnagin, W. R., et al. (2020) · European Radiology · doi:10.1007/s00330-019-06381-8 · Cited by 76
Tunali, I., Hall, L., Napel, S., Cherezov, D., Guvenis, A., Gillies, R., & Schabath, M. (2019) · Medical Physics (Lancaster) · doi:10.1002/mp.13808 · Cited by 72
Qiu, Q., Duan, J., Duan, Z., Meng, X., Ma, C., Zhu, J., Lu, J., Liu, T., & Yin, Y. (2019) · Quantitative Imaging in Medicine and Surgery · doi:10.21037/qims.2019.03.02 · Cited by 67
A Hierarchical Probabilistic U-Net for Modeling Multi-Scale AmbiguitiesPreprint
Köhl, S., Romera‐Paredes, B., Maier-Hein, K. H., Rezende, D. J., Eslami, S. M. A., Kohli, P., Zisserman, A., & Ronneberger, O. (2019) · arXiv (Cornell University) · doi:10.48550/arxiv.1905.13077 · Cited by 58
Reliability of tumor segmentation in glioblastoma: Impact on the robustness of MRI‐radiomic features
Tixier, F., Um, H., Young, R. J., & Veeraraghavan, H. (2019) · Medical Physics · doi:10.1002/mp.13624 · Cited by 51
PHiSeg: Capturing Uncertainty in Medical Image Segmentation
Baumgartner, C. F., Tezcan, K. C., Chaitanya, K., Hötker, A. M., Muehlematter, U. J., Schawkat, K., Becker, A. S., Donati, O., & Konukoglu, E. (2019) · Lecture Notes in Computer Science · doi:10.1007/978-3-030-32245-8_14 · Cited by 34
Can Artificial Intelligence Fix the Reproducibility Problem of Radiomics?
Park, C. M. (2019) · Radiology · doi:10.1148/radiol.2019191154 · Cited by 21
Radiomic Feature Stability Analysis Based on Probabilistic Segmentations
Haarburger, C., Schock, J., Truhn, D., Weitz, P., Müller‐Franzes, G. A., Weninger, L., & Merhof, D. (2020) · IEEE International Symposium on Biomedical Imaging (ISBI) · doi:10.1109/isbi45749.2020.9098674 · Cited by 9
Self-citation
Cited by
Sorted by citations
A review in radiomics: Making personalized medicine a reality via routine imaging
Guiot, J., Vaidyanathan, A., Deprez, L., Zerka, F., Danthine, D., Frix, A.-N., Lambin, P., Bottari, F., Tsoutzidis, N., Miraglio, B., et al. (2021) · Medicinal Research Reviews · doi:10.1002/med.21846 · Cited by 356
Radiomics and artificial intelligence for precision medicine in lung cancer treatment
Chen, M., Copley, S. J., Viola, P., Lu, H., & Aboagye, E. O. (2023) · Seminars in Cancer Biology · doi:10.1016/j.semcancer.2023.05.004 · Cited by 213
Zhang, Y., Zhang, X., Cheng, Y., Li, B., Teng, X.-Z., Zhang, J., Lam, S., Zhou, T., Ma, Z., Sheng, J., et al. (2023) · Military Medical Research · doi:10.1186/s40779-023-00458-8 · Cited by 218
Foundation Model for Cancer Imaging Biomarkers
Pai, S., Bontempi, D., Hadzic, I., Prudente, V., Sokač, M., Chaunzwa, T. L., Bernatz, S., Hosny, A., Mak, R. H., Birkbak, N. J., et al. (2024) · Nature Machine Intelligence · doi:10.1038/s42256-024-00807-9 · Cited by 199
Radiomics feature reliability assessed by intraclass correlation coefficient: a systematic review
Xue, C., Yuan, J., Lo, G. G., Chang, A. T. Y., Poon, D. M. C., Wong, O. L., Zhou, Y., & Chu, C. W. (2021) · Quantitative Imaging in Medicine and Surgery · doi:10.21037/qims-21-86 · Cited by 194
Metadata
- Authors
- Haarburger, C., Müller-Franzes, G., Weninger, L., Kuhl, C., Truhn, D., & Merhof, D.
- Affiliations
- RWTH Aachen University (DE)
- Universitätsklinikum Aachen (DE)
- Fraunhofer Institute for Digital Medicine (DE)
- Corresponding author
- Haarburger, Christoph
- Venue
- Scientific Reports
- Published
- 2020-07-29
- Volume
- 10
- Issue
- 1
- Pages
- 12688-12688
- ISSN
- 2045-2322 (ISSN-L)
- PMC
- PMC7391354
- OpenAlex
- W3046015102
- Cited by
- 139
- References
- 38
- Citations by year
- 2026: 24 · 2025: 20 · 2024: 17 · 2023: 28 · 2022: 26 · 2021: 22 · 2020: 2
- FWCI
- 9.49
- Type
- journal article
- Language
- en
- Update notices
- correction (2021-11-16)
- Open access
- gold
- doi.org
- Locations
- Scientific Reports (publishedVersion, cc-by)
- PubMed Central (publishedVersion, cc-by)
- PubMed (publishedVersion)
- Publikationsdatenbank der Fraunhofer-Gesellschaft (Fraunhofer-Gesellschaft) (submittedVersion, other-oa)
- Fraunhofer-Publica (Fraunhofer-Gesellschaft) (submittedVersion)
- RWTH Publications (RWTH Aachen) (submittedVersion, other-oa)
- Funders
- RWTH Aachen University
- Interreg
- Topics
- Health Sciences › Medicine › Radiology, Nuclear Medicine and Imaging › Radiomics and Machine Learning in Medical Imaging
- Physical Sciences › Computer Science › Computer Vision and Pattern Recognition › Medical Image Segmentation Techniques
- Physical Sciences › Computer Science › Computer Vision and Pattern Recognition › Image Retrieval and Classification Techniques
- Keywords
- radiomics, feature reproducibility, interobserver variability, segmentation variability, CT images, manual segmentation, automatic segmentation, lung lesions, renal lesions, liver lesions, feature robustness
- MeSH terms
- Automation, Humans, Neoplasms, Radiographic Image Interpretation, Computer-Assisted, Tomography, X-Ray Computed, Observer Variation, Databases, Factual, Neural Networks, Computer
About these checks
Registry, retraction, Cites and statistics results are computed, not judged, with one exception: a printed reference that no index lists is read once by a model before it counts as a citation error. Claims are extracted by a model and kept only when their quote appears verbatim in the text; each cited source is then checked, with a model’s help, for whether it says what the claim relies on. Those verdicts can be wrong — read the claim’s quote and the cited source before relying on one.
Statistics and arithmetic are recomputed, not judged.
Confidence bands are shown only for fields calibrated on our annotated test set. None is calibrated yet, so no band is shown.
What counts as a claim ›How we measure confidence ›How we check this ›
Are you an author, or do you see a problem with this page? Request a review
