

The DOI matches its Crossref record; 54 of the 57 references it cites were found in a registry or an index.
Multimodal deep learning models for early detection of Alzheimer’s disease stage
Open accessAbstract
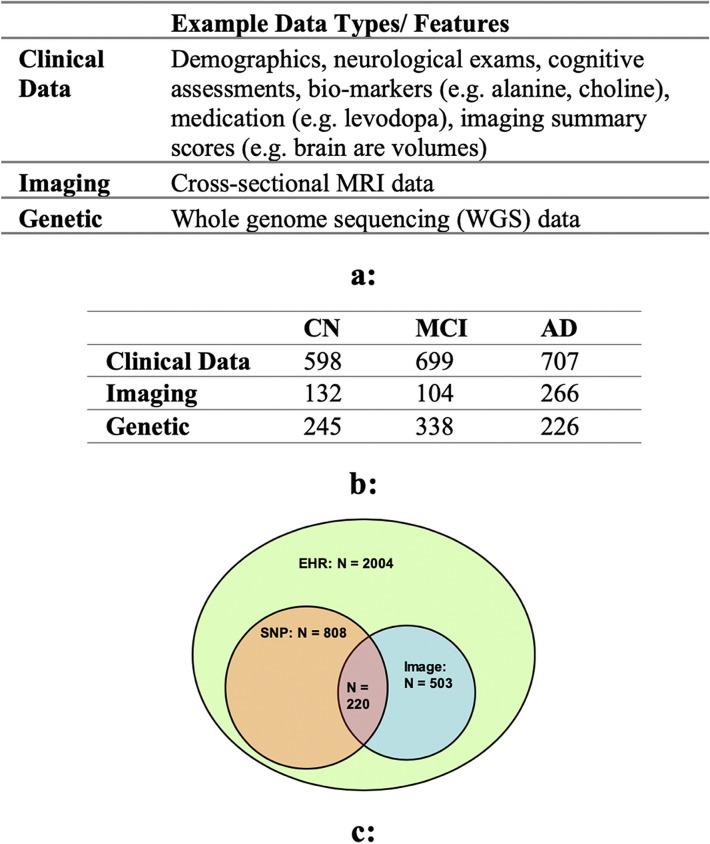
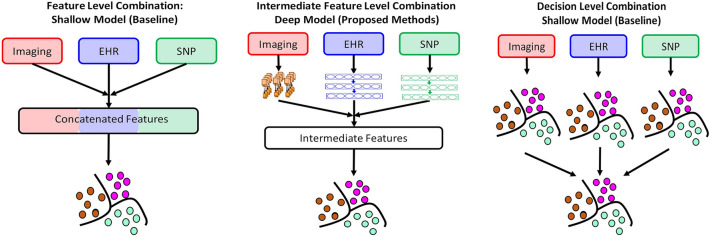
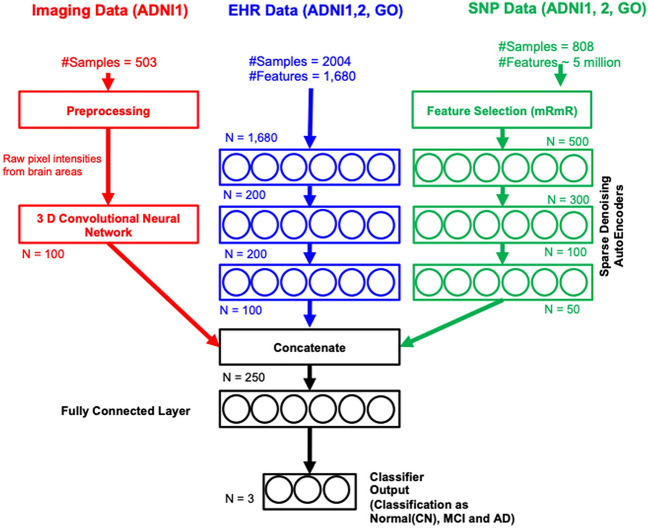
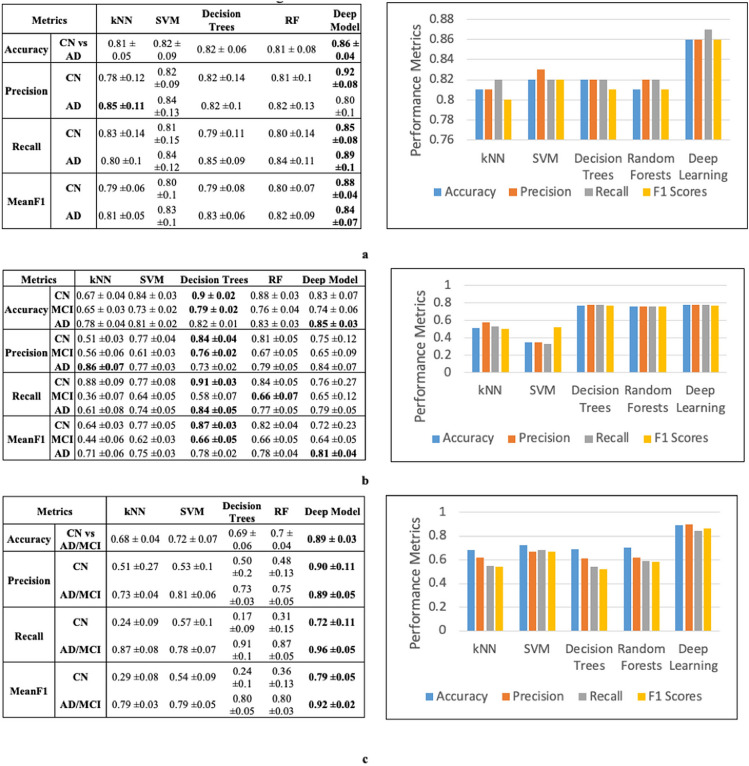
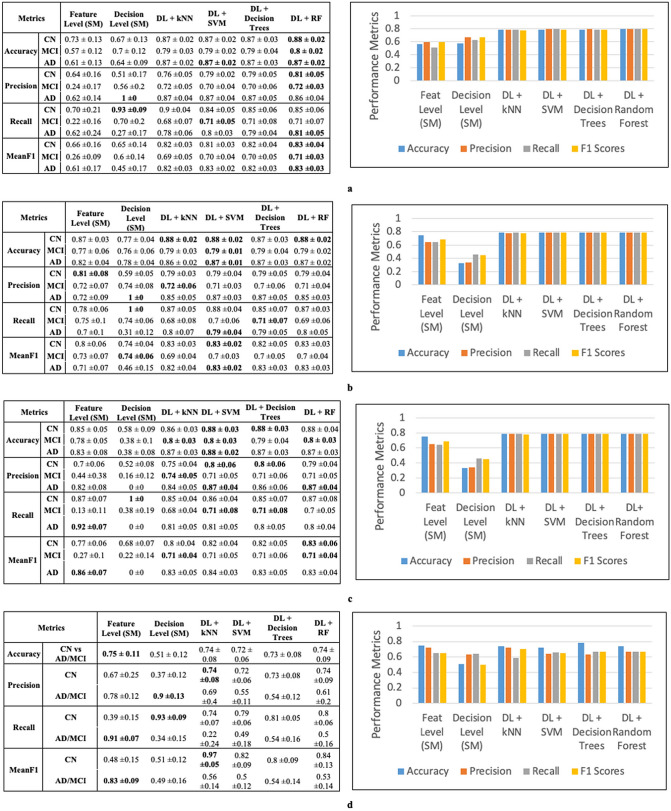
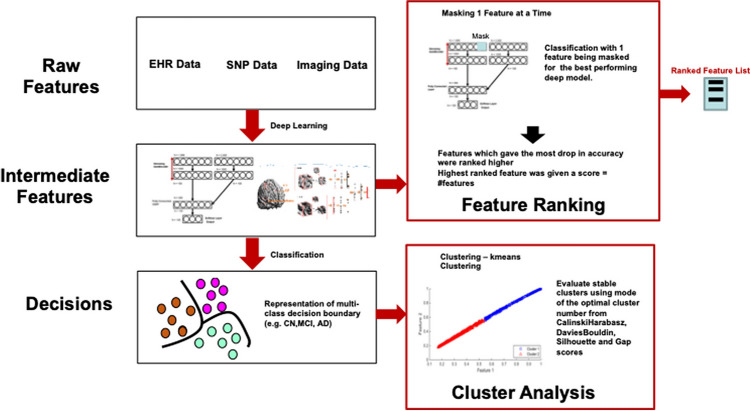
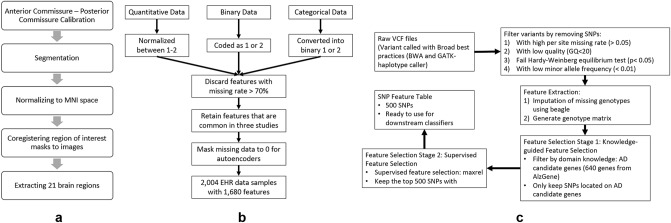
Most current Alzheimer's disease (AD) and mild cognitive disorders (MCI) studies use single data modality to make predictions such as AD stages. The fusion of multiple data modalities can provide a holistic view of AD staging analysis. Thus, we use deep learning (DL) to integrally analyze imaging (magnetic resonance imaging (MRI)), genetic (single nucleotide polymorphisms (SNPs)), and clinical test data to classify patients into AD, MCI, and controls (CN). We use stacked denoising auto-encoders to extract features from clinical and genetic data, and use 3D-convolutional neural networks (CNNs) for imaging data. We also develop a novel data interpretation method to identify top-performing features learned by the deep-models with clustering and perturbation analysis. Using Alzheimer's disease neuroimaging initiative (ADNI) dataset, we demonstrate that deep models outperform shallow models, including support vector machines, decision trees, random forests, and k-nearest neighbors. In addition, we demonstrate that integrating multi-modality data outperforms single modality models in terms of accuracy, precision, recall, and meanF1 scores. Our models have identified hippocampus, amygdala brain areas, and the Rey Auditory Verbal Learning Test (RAVLT) as top distinguished features, which are consistent with the known AD literature.
Overview
The claims and statistics of this paper haven’t been checked yet.
Run the check — free, no account needed. It reads the open-access text and checks the sources it cites.
Integrity signals
Registry
Cites
Statistics
Figures
Verification
Claims the paper makes
The claims and statistics of this paper haven’t been checked yet.
Run the check — free, no account needed. It reads the open-access text and checks the sources it cites.
Claims other papers make about this one
Each is checked against this paper’s own text: does it say what the citing paper says it does?
The cited source says what the claim attributes to it.
In the citing paper
“For instance, MRI and clinical data can be fused for AD prediction [72] or MRI, clinical and genomic modalities can be fused for AD stage detection [69]. Also, latent representations of multiple imaging modalities and clinical data can be fused for risk assessment of liver transplantation for hepatocellular cancer [71].”
From Multimodal deep learning for biomedical data fusion: a review (2022) · cites this paper as [69]
Self-check
Percentages, sums and reported differences re-computed from the paper’s own numbers.
The self-check needs the paper’s full text.
Citations
Cites
Batch Normalization: Accelerating Deep Network Training by Reducing Internal Covariate ShiftPreprint
Ioffe, S. (2024) · arXiv (Cornell University) · doi:10.57702/o9raffed · Cited by 15,273
Dermatologist-level classification of skin cancer with deep neural networks
Esteva, A., Kuprel, B., Novoa, R. A., Ko, J., Swetter, S. M., Blau, H. M., & Thrun, S. (2017) · Nature · doi:10.1038/nature21056 · Cited by 14,362
Peng, H., Long, F., & Ding, C. (2005) · IEEE Transactions on Pattern Analysis and Machine Intelligence · doi:10.1109/tpami.2005.159 · Cited by 10,818
Gulshan, V., Peng, L., Coram, M., Stumpe, M. C., Wu, D., Narayanaswamy, A., Venugopalan, S., Widner, K., Madams, T., Cuadros, J., et al. (2016) · JAMA · doi:10.1001/jama.2016.17216 · Cited by 7,697
Proceedings of the 25th international conference on Machine learning - ICML '08
(2008) · doi:10.1145/1390156 · Cited by 6,865
Shin, H.-C., Roth, H. R., Gao, M., Lu, L., Xu, Z., Nogues, I., Yao, J., Mollura, D., & Summers, R. M. (2016) · IEEE Transactions on Medical Imaging · doi:10.1109/tmi.2016.2528162 · Cited by 5,759
2016 Alzheimer's disease facts and figures
Alzheimer's Association (2016) · Alzheimer's & Dementia · doi:10.1016/j.jalz.2016.03.001 · Cited by 5,069
A new SPM toolbox for combining probabilistic cytoarchitectonic maps and functional imaging data
Eickhoff, S. B., Stephan, K. E., Mohlberg, H., Grefkes, C., Fink, G. R., Amunts, K., & Zilles, K. (2005) · NeuroImage · doi:10.1016/j.neuroimage.2004.12.034 · Cited by 4,033
2013 Alzheimer's disease facts and figures
Thies, W. H., & Bleiler, L. (2013) · Alzheimer s & Dementia · doi:10.1016/j.jalz.2013.02.003 · Cited by 3,372
Advancing research diagnostic criteria for Alzheimer's disease: the IWG-2 criteria
Dubois, B., Feldman, H. H., Jacova, C., Hampel, H., Molinuevo, J. L., Blennow, K., DeKosky, S. T., Gauthier, S., Selkoe, D., Bateman, R., et al. (2014) · The Lancet Neurology · doi:10.1016/s1474-4422(14)70090-0 · Cited by 3,321
Research works printed but not linked: 5
- Schulam, P., Wigley, F. & Saria, S. In AAAI, 2956–2964 (2015).
- Suk, H.-I. & Shen, D. In International Conference on Medical Image Computing and Computer-Assisted Intervention, 583–590 (Springer, New York, 2013).
- Mhaskar, H., Liao, Q. & Poggio, T. Learning functions: when is deep better than shallow. arXiv preprint arXiv:1603.00988 (2016). · arXiv
- Che, Z., Purushotham, S., Khemani, R. & Liu, Y. Distilling knowledge from deep networks with applications to healthcare domain. arXiv preprint arXiv:1512.03542 (2015). · arXiv
- Kingma, D. & Ba, J. Adam: A method for stochastic optimization. arXiv preprint arXiv:1412.6980 (2014). · arXiv
Cited by
Sorted by citations
Items 701–731 of 731
Metaheuristically Optimized ViT–DBN Diagnostic Model for Early Alzheimer's Disease Detection
Soumya, M., Thanka, M. R., Edwin, E. B., & Ebenezer, V. (2026) · International Conference on Data Science for Cyber-Physical Systems Resilience using Advanced Applications (ICDCA) · doi:10.1109/icdca69396.2026.11620308
Cell Ensembles and Memory: The Role of Subpopulation Coding in Neural Circuit FunctionPreprint
Ehsan, M. (2026) · SSRN Electronic Journal · doi:10.2139/ssrn.7272424
Interpretable Alzheimer’s Disease Diagnosis via Multimodal Fusion of Regional Brain Experts
Zhuang, F., Yang, S., Aliyeva, D., Wen, Z., Duong-Tran, D., Davatzikos, C. A., Chen, T., Wang, S., & Shen, L. (2026) · IEEE International Conference on Healthcare Informatics (ICHI) · doi:10.1109/ichi69079.2026.00049
Classification of dementia diseases: novel AD-CNN model
Naqvi, S. A., & Amin, J. (2026) · Evolving Systems · doi:10.1007/s12530-026-09864-4
Zerrouki, H., & Azzaz-Rahmani, S. (2026) · Research Square · doi:10.21203/rs.3.rs-10462750/v1
Opportunities and future directions of neurological disorders diagnosis research
Saini, A., Dadhich, A., Maheshwari, S., Sharma, V. K., & Sharma, R. (2026) · Elsevier eBooks · doi:10.1016/b978-0-44-330291-6.00020-2
Liu, X. (2026) · International Conference on Bioinformatics and Intelligent Computing (BIC) · doi:10.1145/3809986.3810069
Zhao, K., Dai, S., Zhang, Y., Liu, G., Gu, P., Lin, C., Thompson, P. M., Leow, A., Huang, H., He, L., et al. (2026) · Frontiers in Radiology · doi:10.3389/fradi.2026.1912277 · Cited by 4
Ye, L., Zhang, Y., Ba, L., & Yan, D. (2026) · Frontiers in Human Neuroscience · doi:10.3389/fnhum.2026.1873697
Menezes, J., Barbosa, M. I. A., & Rodrigues, P. M. (2026) · Sensors · doi:10.3390/s26175489
Modeling Strategies for Neurodegenerative Diseases: In Vitro, In Vivo and In Silico Frameworks
Martorella, F., Cigolini, C., Pupo, G., Alberio, T., & Lualdi, M. (2026) · Biomedicines · doi:10.3390/biomedicines14102227
Ghasabi, M., Aghdasi, H. S., & Feizi‐Derakhshi, M. (2026) · Ageing Research Reviews · doi:10.1016/j.arr.2026.103372
Bhavana, K., Rao, G. M., Sinha, A., Sindhu, V., & Khalid, S. (2026) · Advances in Public Health · doi:10.1155/adph/5105227
Wilson, E., Jong, F. D., & Peters, L. (2023) · Journal of Medical Sciences and Interdisciplinary Research · doi:10.51847/hrocadzuxj
Ashimgaliyev, M., Zhumadillayeva, А., Mussabek, M., Saparkhojayev, N. P., Qin, P., & Zhamangarin, D. (2026) · Machine Learning and Knowledge Extraction · doi:10.3390/make8090285
Deep Learning for Early Detection of Alzheimer's Disease From MRI Scans
Saraswat, B. K., Jayant, C., Mishra, M. K., Borkar, P. S., Singh, S., & Rakesh, N. (2026) · International Conference on Green Technologies and Sustainable Solutions (GTSS) · doi:10.1109/gtss68743.2026.11679834
Shakeel, S., & Yadav, S. P. (2026) · International Conference on Green Technologies and Sustainable Solutions (GTSS) · doi:10.1109/gtss68743.2026.11679535
Kumar, P., Chauhan, R. S., Mehra, G., & Kumar, A. (2026) · International Conference on Green Technologies and Sustainable Solutions (GTSS) · doi:10.1109/gtss68743.2026.11679712
Jiao, C.-N., Gao, Y.-L., Li, F., Gao, X., Zheng, C.-H., Wang, Y.-L., & Liu, J.-X. (2026) · Engineering Applications of Artificial Intelligence · doi:10.1016/j.engappai.2026.116150
MiGAD: Gut Microbiota-Informed Genetic Surrogates for Multimodal Alzheimer’s Disease Diagnosis
Liang, Z., Zhao, S., Li, F., Lian, Z., Zhou, W., Yan, W., Lam, C. K., Tan, T., & Shen, D. G. (2026) · Lecture notes in computer science · doi:10.1007/978-3-032-38098-2_42
Harikrishnan, K., & Thasni, T. (2026) · International Conference on Smart Communication and Sustainable Technologies (ICSCST) · doi:10.1109/icscst70031.2026.11709650
Shateri, A., & Rezaei, S. (2026) · Romanian Journal of Neurology · doi:10.37897/rjn.2026.3.7
Deepika., D., Karpagam, K., Thenmozhi, P., & Cecyli, P. (2026) · International Conference on Natural Language Processing and Computer Vision (ICNPCV) · doi:10.1109/icnpcv69434.2026.11708982
Buttaro, V., Pellicani, A., Pio, G., D’Elia, D., Pizzulli, C., & Ceci, M. (2026) · Data Mining and Knowledge Discovery · doi:10.1007/s10618-026-01275-y
Liu, J., Zhu, B., Yu, M., & Du, S. (2026) · Neurology International · doi:10.3390/neurolint18100191
Omarov, B. (2026) · Frontiers in Human Neuroscience · doi:10.3389/fnhum.2026.1963855
PaliGemX: An Interpretable Multimodal Transformer for Early Alzheimer’s DetectionPreprint
Suganya, S., & Prasath, A. R. (2026) · Research Square · doi:10.21203/rs.3.rs-11122884/v1
Wang, W., Shi, Y., Cheng, J., & Liu, Y. (2026) · Neural Networks · doi:10.1016/j.neunet.2026.109760
Hybrid Statistical–Machine Learning Model for Multimodal Alzheimer’s Disease Detection
Vinitha, A., & Sumathi, B. (2026) · International Conference on Next-Gen Intelligent Computing and Applications (ICONICA) · doi:10.1109/iconica70605.2026.11736623
Rodolfo, C.-C., Vinícius, S.-R., Biondo, F., Alexandra, Y., Neil, O., James, C., & Carlos, S.-G. (2026) · Neurobiology of Aging · doi:10.1016/j.neurobiolaging.2026.10.006
Hybrid Deep Learning Framework for Mild Cognitive Impairment Stage Classification for Brain Health
Vinodhini, S., & Vimal, V. R. (2026) · International Conference on Intelligent Cyber Physical Systems and Internet of Things (ICoICI) · doi:10.1109/icoici69824.2026.11723601
Metadata
- Authors
- Venugopalan, J., Tong, L., Hassanzadeh, H. R., & Wang, M. D.
- Affiliations
- Georgia Institute of Technology (US)
- Corresponding author
- Wang, May D.
- Venue
- Scientific Reports
- Published
- 2021-02-05
- Volume
- 11
- Issue
- 1
- Pages
- 3254-3254
- ISSN
- 2045-2322 (ISSN-L)
- PMC
- PMC7864942
- OpenAlex
- W3127597934
- Cited by
- 732
- References
- 57
- Citations by year
- 2026: 113 · 2025: 181 · 2024: 162 · 2023: 141 · 2022: 108 · 2021: 27
- FWCI
- 78.57
- Type
- journal article
- Language
- en
- Open access
- gold
- doi.org
- Locations
- Scientific Reports (publishedVersion, cc-by)
- Europe PMC (PubMed Central) (publishedVersion, other-oa)
- PubMed Central (publishedVersion, cc-by)
- PubMed (publishedVersion)
- DOAJ (DOAJ: Directory of Open Access Journals) (submittedVersion, cc-by-sa)
- Funders
- U.S. Department of Health & Human Services | NIH | National Center for Advancing Translational Sciences (UL1TR000454)
- Microsoft Research
- Hewlett Packard | HP Labs
- U.S. Department of Health & Human Services | NIH | Center for Information Technology (UL1TR000454)
- Topics
- Health Sciences › Medicine › Psychiatry and Mental health › Dementia and Cognitive Impairment Research
- Life Sciences › Neuroscience › Cellular and Molecular Neuroscience › Alzheimer's disease research and treatments
- Health Sciences › Health Professions › Health Information Management › Artificial Intelligence in Healthcare
- Keywords
- Alzheimer's disease, mild cognitive impairment, disease staging, multimodal fusion, magnetic resonance imaging, single nucleotide polymorphisms, genetic data, stacked denoising autoencoder, 3D convolutional neural networks, feature interpretation, hippocampus, amygdala, Rey Auditory Verbal Learning Test, ADNI
- MeSH terms
- Deep Learning, Alzheimer Disease, Diagnosis, Computer-Assisted, Humans, Early Diagnosis, Data Mining
About these checks
Registry, retraction, Cites and statistics results are computed, not judged, with one exception: a printed reference that no index lists is read once by a model before it counts as a citation error. Claims are extracted by a model and kept only when their quote appears verbatim in the text; each cited source is then checked, with a model’s help, for whether it says what the claim relies on. Those verdicts can be wrong — read the claim’s quote and the cited source before relying on one.
Statistics and arithmetic are recomputed, not judged.
Confidence bands are shown only for fields calibrated on our annotated test set. None is calibrated yet, so no band is shown.
What counts as a claim ›How we measure confidence ›How we check this ›
Are you an author, or do you see a problem with this page? Request a review
