

The DOI matches its Crossref record; 48 of the 48 references it cites were found in a registry or an index.
Increased intestinal permeability and gut dysbiosis in the R6/2 mouse model of Huntington’s disease
Open accessAbstract
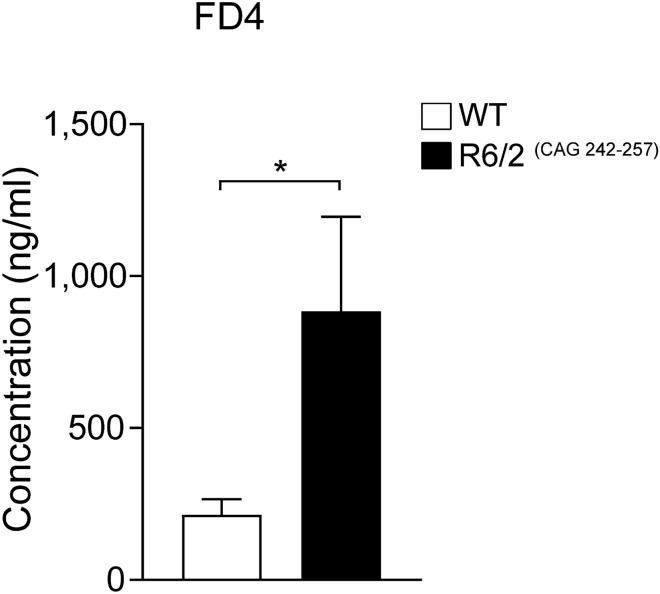
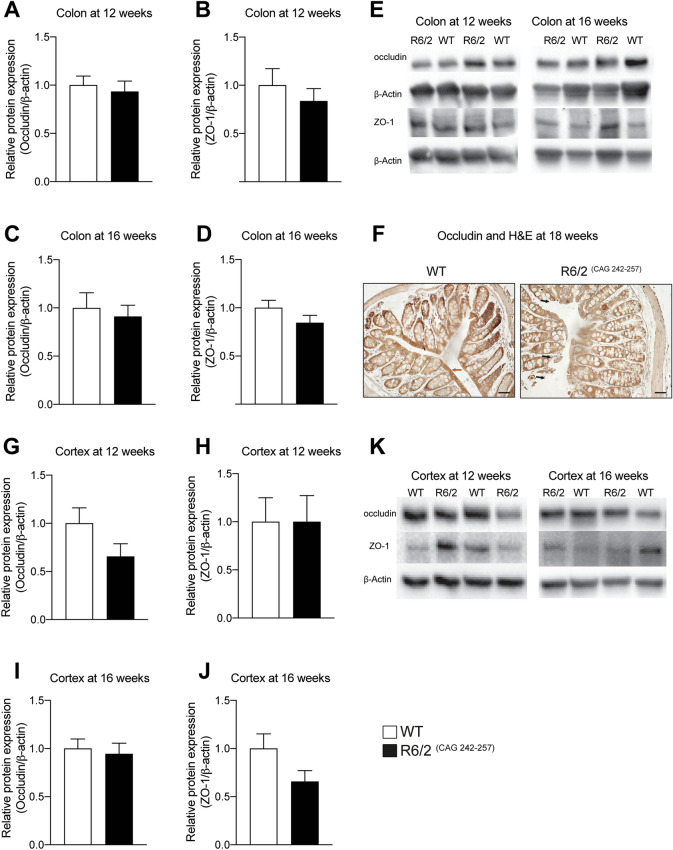
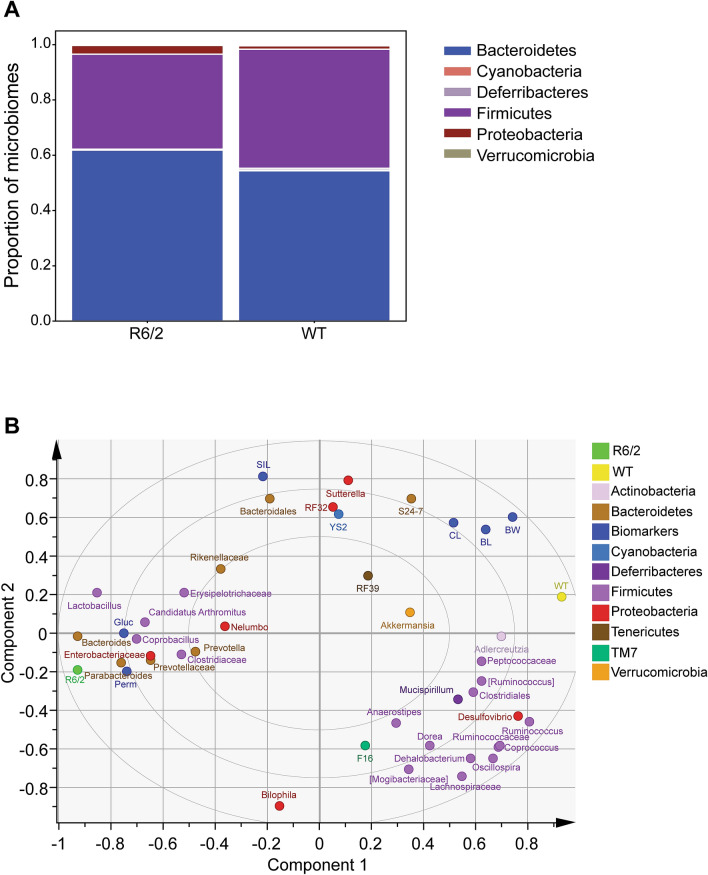
Huntington’s disease (HD) is a progressive, multifaceted neurodegenerative disease associated with weight loss and gut problems. Under healthy conditions, tight junction (TJ) proteins maintain the intestinal barrier integrity preventing bacterial translocation from the intestinal lumen to the systemic circulation. Reduction of TJs expression in Parkinson’s disease patients has been linked with increased intestinal permeability—leaky gut syndrome. The intestine contains microbiota, most dominant phyla being Bacteroidetes and Firmicutes ; in pathogenic or disease conditions the balance between these bacteria might be disrupted. The present study investigated whether there is evidence for an increased intestinal permeability and dysbiosis in the R6/2 mouse model of HD. Our data demonstrate that decreased body weight and body length in R6/2 mice is accompanied by a significant decrease in colon length and increased gut permeability compared to wild type littermates, without any significant changes in the protein levels of the tight junction proteins (occludin, zonula occludens). Moreover, we found an altered gut microbiota in R6/2 mice with increased relative abundance of Bacteroidetes and decreased of Firmicutes . Our results indicate an increased intestinal permeability and dysbiosis in R6/2 mice and further studies investigating the clinical relevance of these findings are warranted.
Overview
The claims and statistics of this paper haven’t been checked yet.
Run the check — free, no account needed. It reads the open-access text and checks the sources it cites.
Integrity signals
Registry
Cites
Statistics
Figures
Verification
Claims the paper makes
The claims and statistics of this paper haven’t been checked yet.
Run the check — free, no account needed. It reads the open-access text and checks the sources it cites.
Claims other papers make about this one
Each is checked against this paper’s own text: does it say what the citing paper says it does?
In the citing paper
“However, the study did not observe an increase in Bacteroidetes and a reduction in Firmicutes, as reported in both R6/1 and R6/2 mice.235,236”
From Microbiota–gut–brain axis and its therapeutic applications in neurodegenerative diseases (2024) · cites this paper as [236]
In the citing paper
“It was found that R6/2 mice exhibited increased intestinal permeability and reduced colon length at 16 weeks of age (early-mid disease stage), as compared to age-matched WT mice.236”
From Microbiota–gut–brain axis and its therapeutic applications in neurodegenerative diseases (2024) · cites this paper as [236]
In the citing paper
“Moreover, a higher relative abundance of Bacteroidetes and a lower relative abundance of Firmicutes were reported in both R6/1 and R6/2 mice, as compared to WT mice.235,236”
From Microbiota–gut–brain axis and its therapeutic applications in neurodegenerative diseases (2024) · cites this paper as [236]
Self-check
Percentages, sums and reported differences re-computed from the paper’s own numbers.
The self-check needs the paper’s full text.
Citations
Cites
QIIME allows analysis of high-throughput community sequencing data
Caporaso, J. G., Kuczynski, J., Stombaugh, J., Bittinger, K., Bushman, F. D., Costello, E. K., Fierer, N., Peña, A. G., Goodrich, J. K., Gordon, J. I., et al. (2010) · Nature Methods · doi:10.1038/nmeth.f.303 · Cited by 34,887
Metagenomic biomarker discovery and explanation
Segata, N., Izard, J., Waldron, L., Gevers, D., Miropolsky, L., Garrett, W. S., & Huttenhower, C. (2011) · Genome Biology · doi:10.1186/gb-2011-12-6-r60 · Cited by 16,192
Human gut microbes associated with obesity
Ley, R. E., Turnbaugh, P. J., Klein, S., & Gordon, J. I. (2006) · Nature · doi:10.1038/4441022a · Cited by 8,785
MACDONALD, M. (1993) · Cell · doi:10.1016/0092-8674(93)90585-e · Cited by 8,366
Kozich, J. J., Westcott, S. L., Baxter, N. T., Highlander, S. K., & Schloss, P. D. (2013) · Applied and Environmental Microbiology · doi:10.1128/aem.01043-13 · Cited by 7,246
Cryan, J. F., O'Riordan, K. J., Cowan, C. S. M., Sandhu, K. V., Bastiaanssen, T. F. S., Boehme, M., Codagnone, M. G., Cussotto, S., Fulling, C., Golubeva, A. V., et al. (2019) · Physiological Reviews · doi:10.1152/physrev.00018.2018 · Cited by 5,286
Quality control and preprocessing of metagenomic datasets
Schmieder, R., & Edwards, R. A. (2011) · Bioinformatics · doi:10.1093/bioinformatics/btr026 · Cited by 5,119
Hsiao, E. Y., McBride, S. W., Hsien, S., Sharon, G., Hyde, E. R., McCue, T., Codelli, J. A., Chow, J., Reisman, S. E., Petrosino, J. F., et al. (2013) · Cell · doi:10.1016/j.cell.2013.11.024 · Cited by 3,283
Mangiarini, L., Sathasivam, K., Seller, M., Cozens, B., Harper, A., Hetherington, C., Lawton, M., Trottier, Y., Lehrach, H., Davies, S. W., et al. (1996) · Cell · doi:10.1016/s0092-8674(00)81369-0 · Cited by 3,073
Shah, M. A., Datson, N. A., Srinidhi, L., Stanton, V. P., MacDonald, M. E., Allard, M. W., Youngman, S., Am, F., Mott, R., Draths, K., et al. (1993) · Cell · Cited by 3,055
Cited by
Sorted by citations
Items 101–101 of 101
Amishi, & Bohidar, H. B. (2026) · Biosystems · doi:10.1016/j.biosystems.2026.105959
Metadata
- Authors
- Stan, T. L., Soylu-Kucharz, R., Burleigh, S., Prykhodko, O., Cao, L., Franke, N., Sjögren, M., Haikal, C., Hållenius, F., & Björkqvist, M.
- Affiliations
- Lund University (SE)
- Corresponding author
- Soylu-Kucharz, Rana
- ORCID
- Venue
- Scientific Reports
- Published
- 2020-10-26
- Volume
- 10
- Issue
- 1
- Pages
- 18270-18270
- ISSN
- 2045-2322 (ISSN-L)
- PMC
- PMC7589489
- OpenAlex
- W3094034464
- Cited by
- 101
- References
- 48
- Citations by year
- 2026: 11 · 2025: 14 · 2024: 22 · 2023: 17 · 2022: 26 · 2021: 11
- FWCI
- 4.38
- Type
- journal article
- Language
- en
- Open access
- gold
- doi.org
- Locations
- Scientific Reports (publishedVersion, cc-by)
- PubMed Central (publishedVersion, cc-by)
- PubMed (publishedVersion)
- Lund University Publications (Lund University) (submittedVersion)
- Funders
- Royal Physiographic Society of Lund
- Per Westlings funds
- Knut och Alice Wallenbergs Stiftelse
- Svenska Sällskapet för Medicinsk Forskning
- The Direktör Albert Påhlsson Foundation, Sweden
- Vetenskapsrådet (#2017-01080)
- Lund University
- Topics
- Life Sciences › Biochemistry, Genetics and Molecular Biology › Molecular Biology › Gut microbiota and health
- Health Sciences › Medicine › Gastroenterology › Gastrointestinal motility and disorders
- Life Sciences › Neuroscience › Neurology › Barrier Structure and Function Studies
- Keywords
- Huntington's disease, intestinal permeability, gut dysbiosis, R6/2 mouse model, tight junction proteins, occludin, zonula occludens, gut microbiota, Bacteroidetes, Firmicutes, leaky gut, weight loss, colon length
- MeSH terms
- Gastrointestinal Microbiome, Animals, Bacteria, Body Weight, Disease Models, Animal, DNA, Bacterial, DNA, Ribosomal, Female, Humans, Huntington Disease, Male, Phylogeny, RNA, Ribosomal, 16S, Sequence Analysis, DNA, Bacterial Physiological Phenomena, Bacterial Translocation, Mice, Tight Junction Proteins, Dysbiosis
About these checks
Registry, retraction, Cites and statistics results are computed, not judged, with one exception: a printed reference that no index lists is read once by a model before it counts as a citation error. Claims are extracted by a model and kept only when their quote appears verbatim in the text; each cited source is then checked, with a model’s help, for whether it says what the claim relies on. Those verdicts can be wrong — read the claim’s quote and the cited source before relying on one.
Statistics and arithmetic are recomputed, not judged.
Confidence bands are shown only for fields calibrated on our annotated test set. None is calibrated yet, so no band is shown.
What counts as a claim ›How we measure confidence ›How we check this ›
Are you an author, or do you see a problem with this page? Request a review
