

The DOI matches its Crossref record; the references it cites are not checked yet.
Effect of FTY720P on lipid accumulation in HEPG2 cells
Open accessAbstract
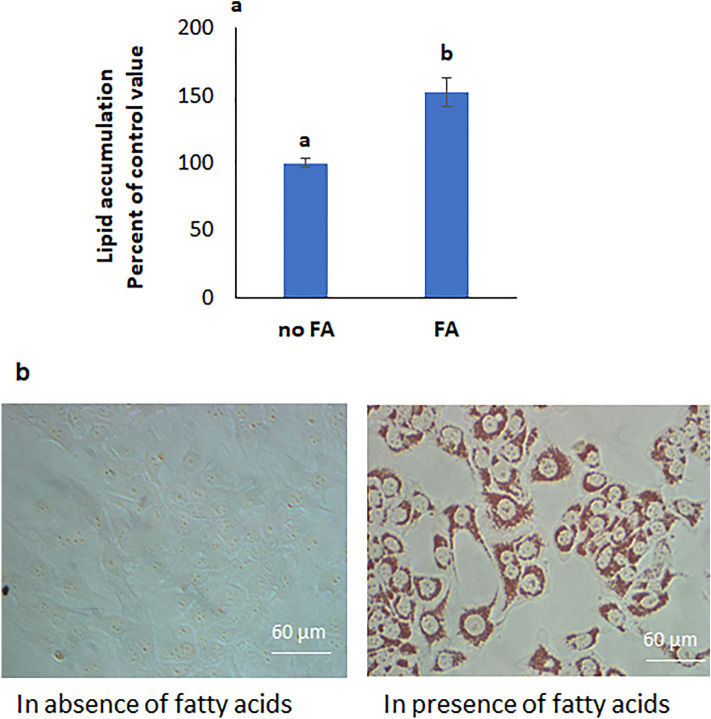
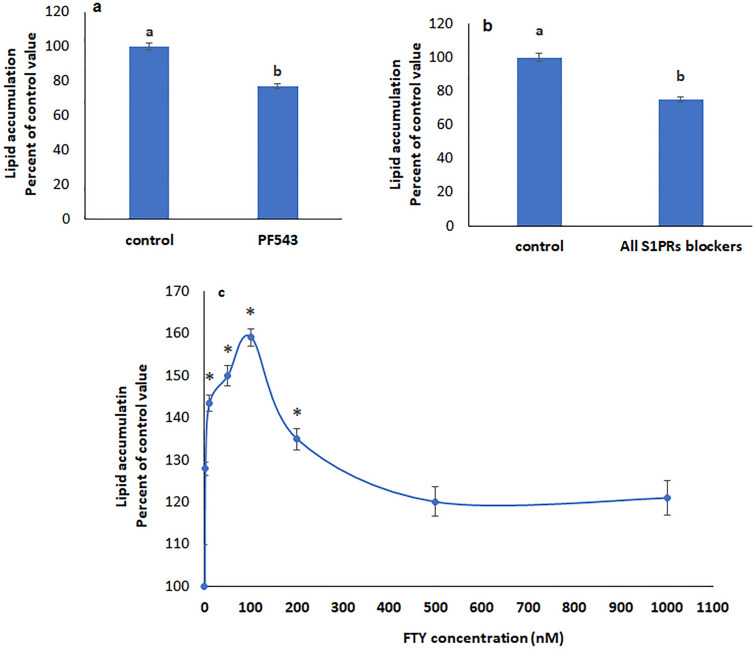
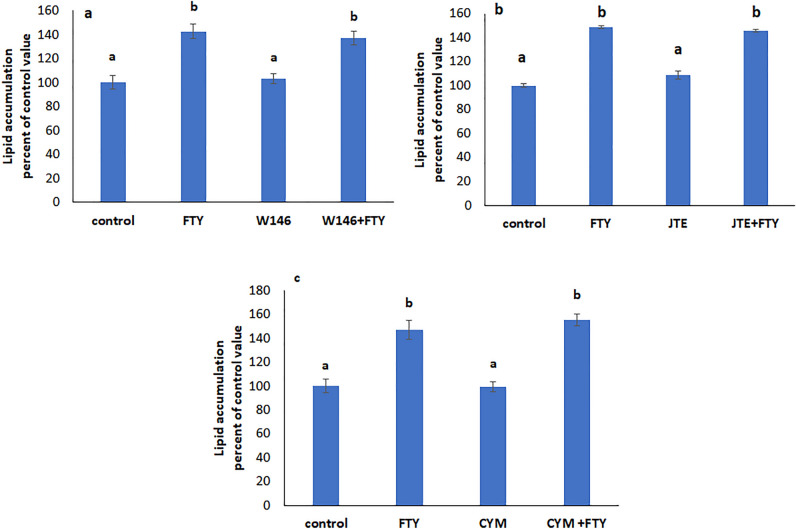
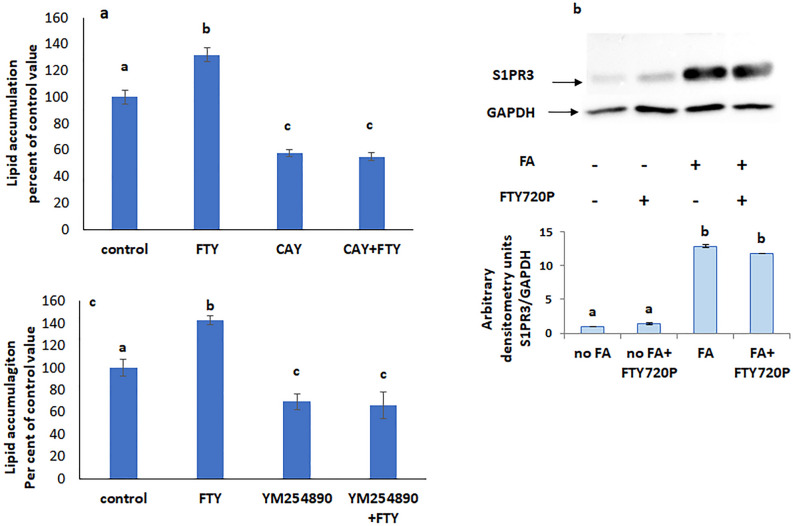
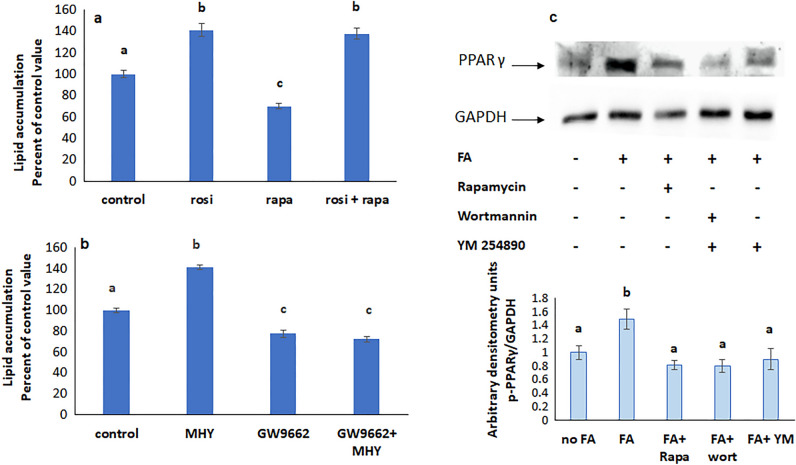
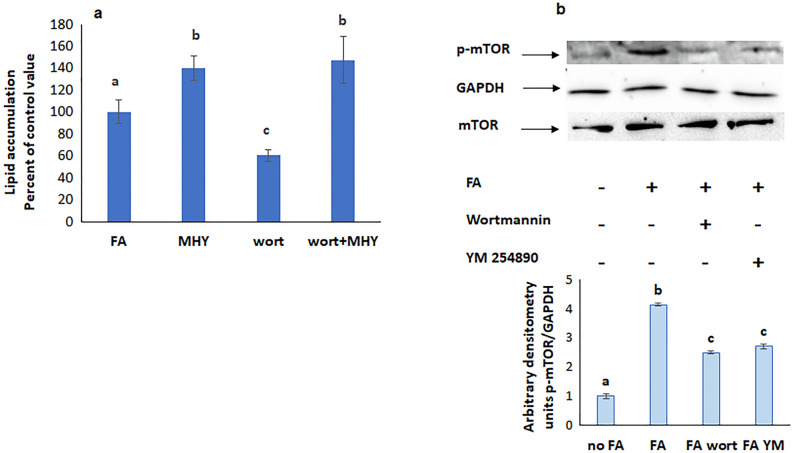
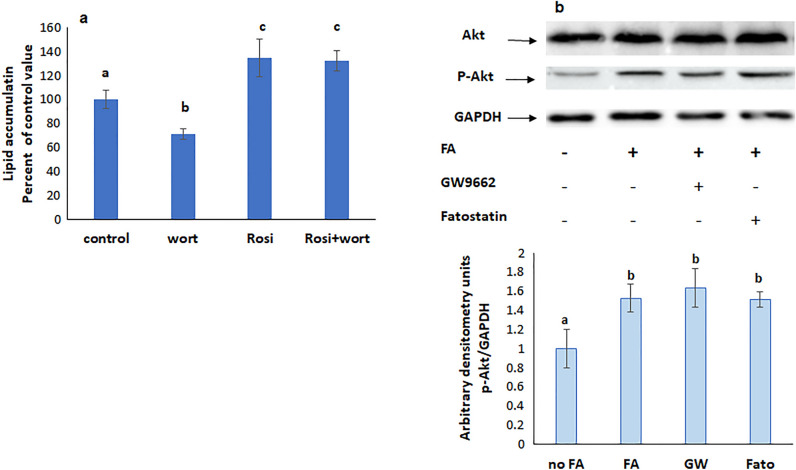
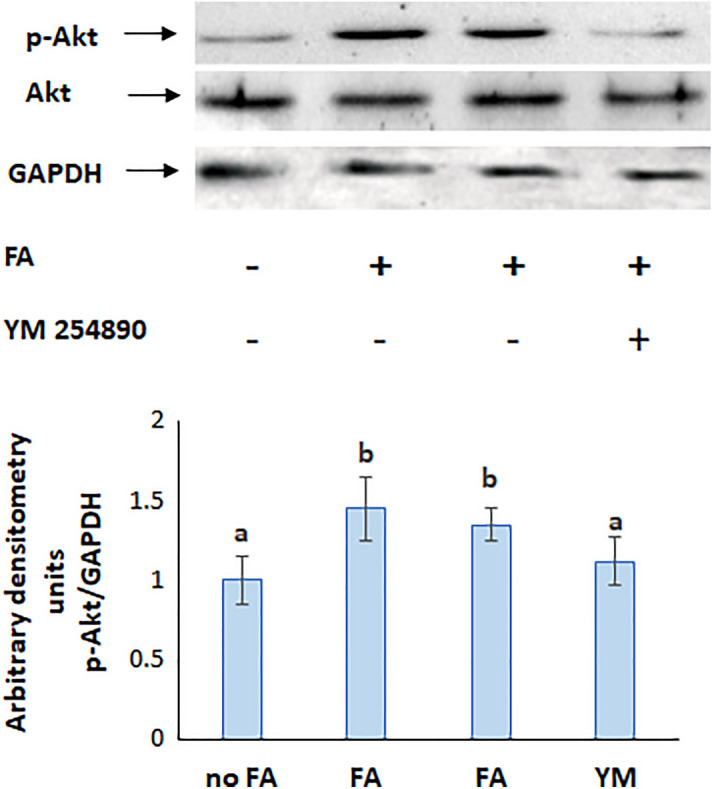
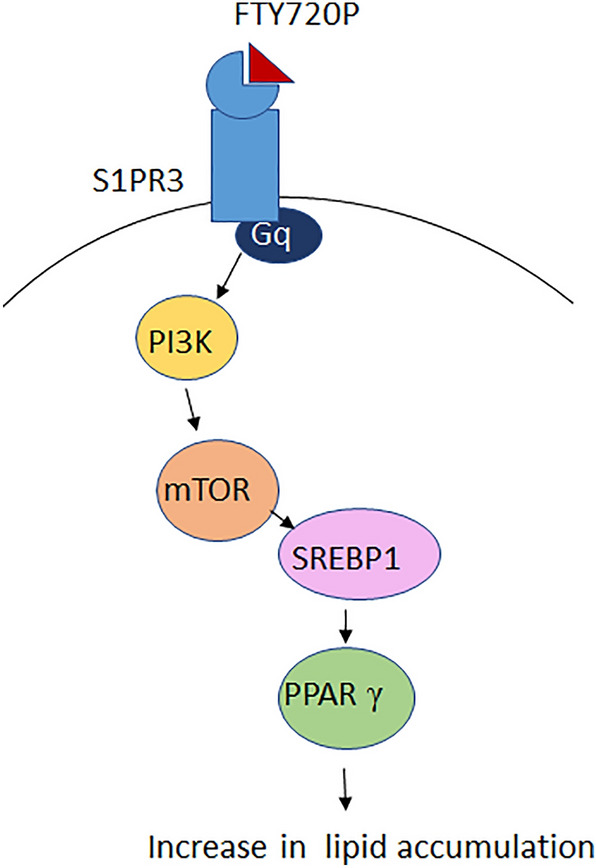
Nonalcoholic fatty liver disease (NAFLD) is characterized by an increase in hepatic lipid accumulation due to impaired lipid metabolism. Although a correlation was found between NAFLD and sphingosine-1-phosphate (S1P), the role of the sphingolipid remains controversial. The aim of this study was to investigate any involvement of S1P in steatosis using its analog FTY720P and HepG2 cells. Lipid accumulation was induced by incubating the cells in a mixture of oleic and palmitic acid, and was quantified using Oil Red O. The involvement of signaling mediators was studied using pharmacological inhibitors and western blot analysis. FTY720P increased lipid accumulation, but this increase wasn't maintained in the presence of inhibitors of S1PR3, Gq, SREBP, mTOR, PI3K, and PPARγ indicating their involvement in the process. The results revealed that FTY720P binds to S1PR3 which activates sequentially Gq, PI3K, and mTOR leading to an increase in SREBP expression and PPARγ activation. It was concluded that in presence of a high level of fatty acids, lipid accumulation is increased in hepatocytes by the exogenously added FTY720P.
Overview
The claims and statistics of this paper haven’t been checked yet.
Run the check — free, no account needed. It reads the open-access text and checks the sources it cites.
Integrity signals
Registry
Cites
Statistics
Figures
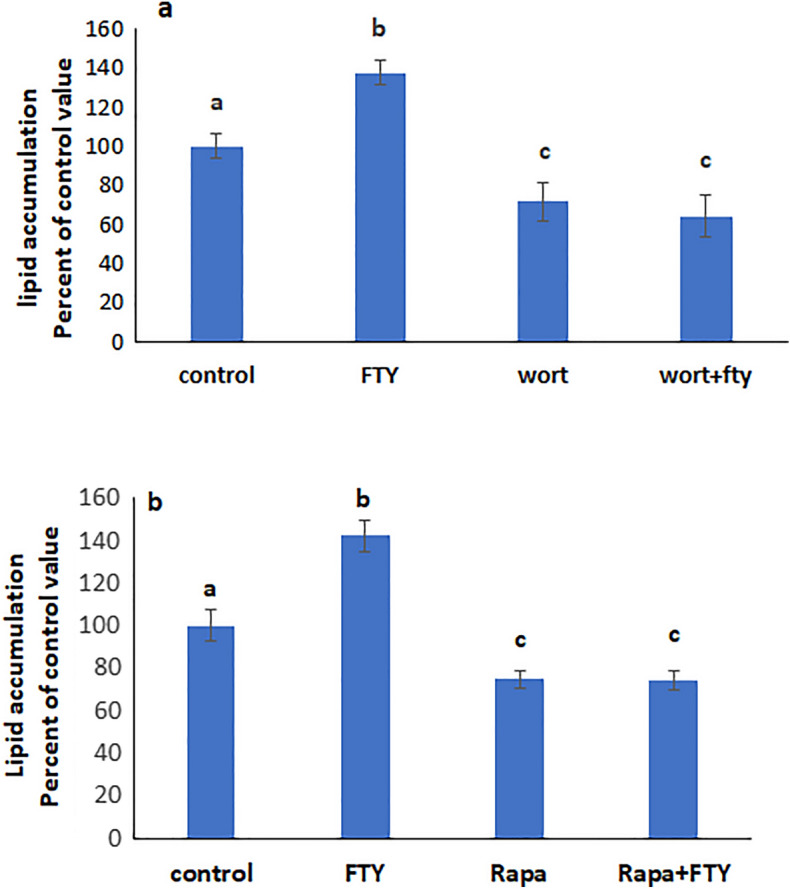
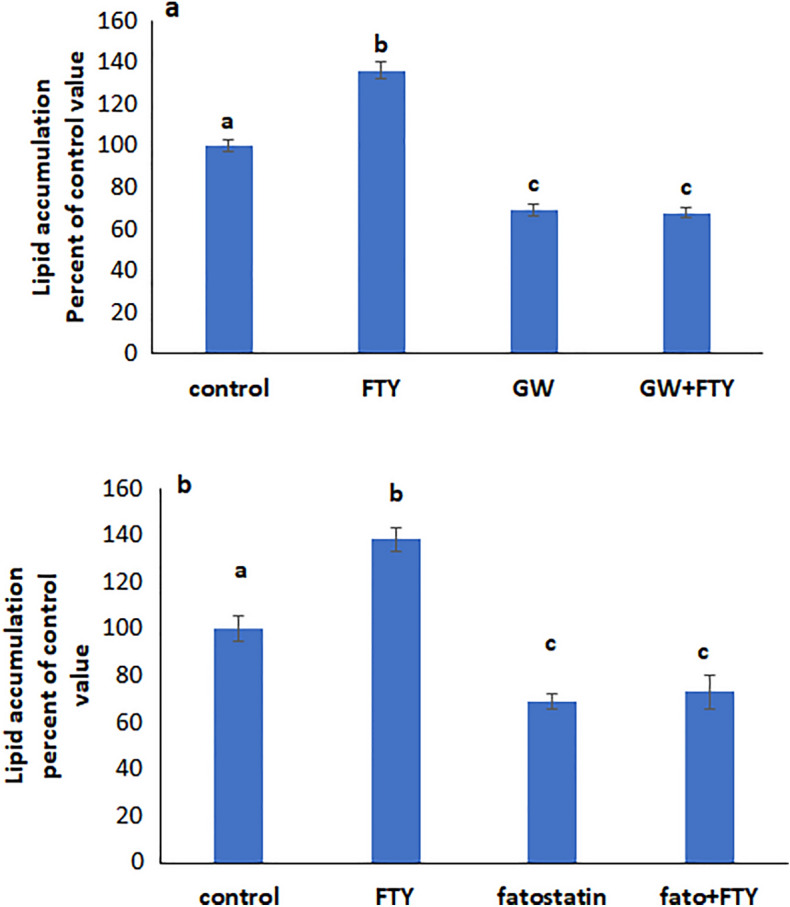
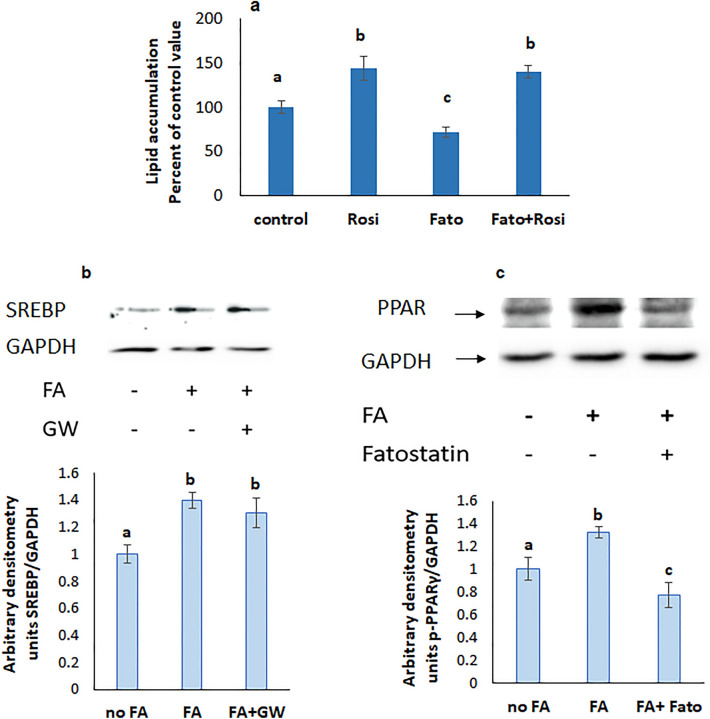
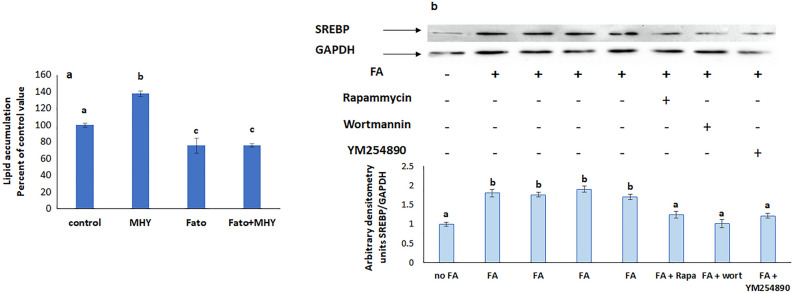
Verification
Claims the paper makes
The claims and statistics of this paper haven’t been checked yet.
Run the check — free, no account needed. It reads the open-access text and checks the sources it cites.
Claims other papers make about this one
Each is checked against this paper’s own text: does it say what the citing paper says it does?
The source backs part of the claim, not all of it — or backs it for a different population, condition or comparison.
In the citing paper
“When treated with a mixture of free fatty acids (e.g., oleic acid (OA) + palmitic acid (PA)), HepG2 cells show significant triglyceride accumulation [83,84,85].”
From The HepG2 Cell Line as a Model for Studying Metabolic Dysfunction-Associated Steatotic Liver Disease (2026) · cites this paper as [84]
Experimental — accuracy not yet measuredThe cited source says what the claim attributes to it.
In the citing paper
“HepG2 has been shown to demonstrate a predictable steatogenic response to free fatty acids (FFAs) and is convenient for reproducing early stages of pathogenesis and primary pharmacological selection of compounds.”
From The HepG2 Cell Line as a Model for Studying Metabolic Dysfunction-Associated Steatotic Liver Disease (2026) · cites this paper as [84]
Self-check
Percentages, sums and reported differences re-computed from the paper’s own numbers.
The self-check needs the paper’s full text.
Citations
The citation lists are queued
They are fetched later and appear here then.
References 56 · Cited by 14
Research works printed but not linked: 53
- Paschos, P. & Paletas, K. Non alcoholic fatty liver disease and metabolic syndrome. Hippokratia 13(1), 9–19 (2009).
- Farrell, G. C. & Larter, C. Z. Nonalcoholic fatty liver disease: From steatosis to cirrhosis. Hepatology 43, S99–S112 (2006). · DOI
- Williams, C. D. et al. Prevalence of nonalcoholic fatty liver disease and nonalcoholic steatohepatitis among a largely middle-aged population utilizing ultrasound and liver biopsy: A prospective study. J. Gastroenterol. 140(1), 124–131 (2011).
- Musso, G., Gambino, R. & Cassader, M. Recent insights into hepatic lipid metabolism in non-alcoholic fatty liver disease (NAFLD). Prog. Lipid Res. 48(1), 1–26 (2009). · DOI
- Tian, J., Goldstein, J. L. & Brown, M. S. Insulin induction of SREBP-1c in rodent liver requires LXRα-C/EBPβ complex. Proc. Natl. Acad. Sci. USA 113(29), 8182–8187 (2016). · DOI
- Gan, X., Wang, J., Su, B. & Wu, D. Evidence for direct activation of mTORC2 kinase activity by phosphatidylinositol 3,4,5-trisphosphate. J. Biol. Chem. 286(13), 10998–11002 (2011). · DOI
- Jacinto, E. et al. SIN1/MIP1 maintains rictor-mTOR complex integrity and regulates Akt phosphorylation and substrate specificity. Cell. 127(1), 125–137 (2006). · DOI
- Choi, S. S. & Diehl, A. M. Hepatic triglyceride synthesis and nonalcoholic fatty liver disease. Curr. Opin. Lipidol. 19(3), 295–300 (2008). · DOI
- Hannun, Y. A. & Obeid, L. M. The Ceramide-centric universe of lipid-mediated cell regulation: Stress encounters of the lipid kind. J. Biol. Chem. 277(29), 25847–25850 (2002). · DOI
- Ohanian, J. & Ohanian, V. Sphingolipids in mammalian cell signalling. Cell Mol. Life Sci. 58(14), 2053–2068 (2001). · DOI
- Holthuis, J. C., Pomorski, T., Raggers, R. J., Sprong, H. & Van Meer, G. The organizing potential of sphingolipids in intracellular membrane transport. Physiol. Rev. 81(4), 1689–1723 (2001). · DOI
- Tani, M., Ito, M. & Igarashi, Y. Ceramide/sphingosine/sphingosine 1-phosphate metabolism on the cell surface and in the extracellular space. Cell. Signal. 19(2), 229–237 (2007). · DOI
- Chun, J. et al. International Union of Pharmacology. XXXIV. Lysophospholipid receptor nomenclature. Pharmacol. Rev. 54(2), 265–269 (2002). · DOI
- Fayyaz, S. et al. Involvement of sphingosine 1-phosphate in palmitate-induced insulin resistance of hepatocytes via the S1P2 receptor subtype. Diabetologia 57(2), 373–382 (2014). · DOI
- Chen, J. et al. Deletion of sphingosine kinase 1 ameliorates hepatic steatosis in diet-induced obese mice: Role of PPARγ. Biochim. Biophys. Acta 1861(2), 138–147 (2016). · DOI
- Nagahashi, M. et al. Conjugated bile acid-activated S1P receptor 2 is a key regulator of sphingosine kinase 2 and hepatic gene expression. Hepatology 61(4), 1216–1226 (2015). · DOI
- Fujita, T. et al. Fungal metabolites. Part 12. Potent immunosuppressant, 14-deoxomyriocin, (2S,3R,4R)-(E)-2-amino-3,4-dihydroxy-2-hydroxymethyleicos-6-enoic acid and structure-activity relationships of myriocin derivatives. J. Antibiot. 47(2), 216–224 (1994). · DOI
- Khalil, C., Hodeify, R. & Kreydiyyeh, S. Signaling cascade mediating the effect of FTY720P on the Na+/K+ ATPase in LLC-PK1. Cell. Physiol. Biochem. 56(4), 418–435. https://doi.org/10.33594/000000561 (2022). · DOI
- Rida, R., Hodeify, R. & Kreydiyyeh, S. Adverse effect of FTY720P on colonic Na+ /K+ ATPase is mediated via ERK, p38MAPK, PKC, and PI3K. J. Appl. Toxicol. 43(2), 220–229. https://doi.org/10.1002/jat.4375 (2023). · DOI
- Brinkmann, V. et al. Fingolimod (FTY720): Discovery and development of an oral drug to treat multiple sclerosis. Nat. Rev. Drug Discov. 9(11), 883–897 (2010). · DOI · Paper page
- Moon, M. H. et al. Antiobesity activity of a sphingosine 1-phosphate analogue FTY720 observed in adipocytes and obese mouse model. Exp. Mol. Med. 44(10), 603–614 (2012). · DOI
- Mauer, A. S., Hirsova, P., Maiers, J. L., Shah, V. H. & Malhi, H. Inhibition of sphingosine 1-phosphate signaling ameliorates murine nonalcoholic steatohepatitis. Am. J. Physiol. Gastrointest. Liver Physiol. 312(3), G300–G313 (2017). · DOI
- Yao, H. R. et al. Lipotoxicity in HepG2 cells triggered by free fatty acids. Am. J. Transl. Res. 3(3), 284–291 (2011).
- Sikkeland, J., Jin, Y. & Saatcioglu, F. Methods to assess lipid accumulation in cancer cells. Methods Enzymol. 542, 407–423 (2014). · DOI
- Harrington, C. R. Lowry protein assay containing sodium dodecyl sulfate in microtiter plates for protein determinations on fractions from brain tissue. Anal. Biochem. 186(2), 285–287 (1990). · DOI
- Hannun, Y. A. & Obeid, L. M. Principles of bioactive lipid signalling: Lessons from sphingolipids. Nat. Rev. Mol. Cell Biol. 9(2), 139–150 (2008). · DOI
- Al Fadel, F., Fayyaz, S., Japtok, L. & Kleuser, B. Involvement of sphingosine 1-phosphate in palmitate-induced non-alcoholic fatty liver disease. Cell Physiol. Biochem. 40(6), 1637–1645 (2016). · DOI
- Osawa, Y. et al. Acid sphingomyelinase regulates glucose and lipid metabolism in hepatocytes through AKT activation and AMP-activated protein kinase suppression. FASEB J. 25(4), 1133–1144 (2011). · DOI
- Geng, T. et al. SphK1 mediates hepatic inflammation in a mouse model of NASH induced by high saturated fat feeding and initiates proinflammatory signaling in hepatocytes. J. Lipid Res. 56(12), 2359–2371 (2015). · DOI
- Al Alam, N. & Kreydiyyeh, S. I. FTY720P inhibits hepatic Na(+)-K(+) ATPase via S1PR2 and PGE2. Biochem. Cell Biol. 94(4), 371–377 (2016). · DOI
- Wang, X. et al. Morin reduces hepatic inflammation-associated lipid accumulation in high fructose-fed rats via inhibiting sphingosine kinase 1/sphingosine 1-phosphate signaling pathway. Biochem. Pharmacol. 86(12), 1791–1804 (2013). · DOI
- Titchenell, P. M. et al. Direct hepatocyte insulin signaling is required for lipogenesis but is dispensable for the suppression of glucose production. Cell Metab. 23(6), 1154–1166 (2016). · DOI
- Porstmann, T. et al. SREBP activity is regulated by mTORC1 and contributes to Akt-dependent cell growth. Cell Metab. 8(3), 224–236 (2008). · DOI · Paper page
- Ruiz, M., Okada, H. & Dahlbäck, B. HDL-associated ApoM is anti-apoptotic by delivering sphingosine 1-phosphate to S1P1 & S1P3 receptors on vascular endothelium. Lipids Health Dis. 16(1), 36 (2017). · DOI
- Pettinelli, P. & Videla, L. A. Up-regulation of PPAR-gamma mRNA expression in the liver of obese patients: An additional reinforcing lipogenic mechanism to SREBP-1c induction. Clin. Endocrinol. Metab. 96(5), 1424–1430 (2011). · DOI
- Lin, J. et al. Hyperlipidemic effects of dietary saturated fats mediated through PGC-1beta coactivation of SREBP. Cell 120(2), 261–273 (2005). · DOI
- Edvardsson, U. et al. Rosiglitazone (BRL49653), a PPARgamma-selective agonist, causes peroxisome proliferator-like liver effects in obese mice. JLR 40(7), 1177–1184 (1999).
- Bedoucha, M., Atzpodien, E. & Boelsterli, U. A. Diabetic KKAy mice exhibit increased hepatic PPARgamma1 gene expression and develop hepatic steatosis upon chronic treatment with antidiabetic thiazolidinediones. J. Hepatol. 35(1), 17–23 (2001). · DOI
- Matsusue, K. et al. Liver-specific disruption of PPARgamma in leptin-deficient mice improves fatty liver but aggravates diabetic phenotypes. J. Clin. Investig. 111(5), 737–747 (2003). · DOI · Paper page
- Parham, K. A. et al. Sphingosine 1-phosphate is a ligand for peroxisome proliferator-activated receptor-γ that regulates neoangiogenesis. FASEB J. 29(9), 3638–3653 (2015). · DOI · Paper page
- Koch, A. et al. Thiazolidinedione-dependent activation of sphingosine kinase 1 causes an anti-fibrotic effect in renal mesangial cells. Br. J. Pharmacol. 166(3), 1018–1032 (2012). · DOI
- Horton, J. D. & Shimomura, I. Sterol regulatory element-binding proteins: Activators of cholesterol and fatty acid biosynthesis. Curr. Opin. Lipidol. 10(2), 143–150 (1999). · DOI
- Yahagi, N. et al. Absence of sterol regulatory element-binding protein-1 (SREBP-1) ameliorates fatty livers but not obesity or insulin resistance in Lep(ob)/Lep(ob) mice. J. Biol. Chem. 277(22), 19353–19357 (2002). · DOI
- Ozbay, T., Rowan, A., Leon, A., Patel, P. & Sewer, M. B. Cyclic adenosine 5′-monophosphate-dependent sphingosine-1-phosphate biosynthesis induces human CYP17 gene transcription by activating cleavage of sterol regulatory element binding protein 1. Endocrinology 147(3), 1427–1437 (2006). · DOI · Paper page
- Ruiz, M. et al. Sphingosine 1-phosphate mediates adiponectin receptor signaling essential for lipid homeostasis and embryogenesis. Nat. Commun. 13(1), 7162 (2022). · DOI
- Murga, C., Laguinge, L., Wetzker, R., Cuadrado, A. & Gutkind, J. S. Activation of Akt/protein kinase B by G protein-coupled receptors. A role for alpha and beta gamma subunits of heterotrimeric G proteins acting through phosphatidylinositol-3-OH kinasegamma. J. Biol. Chem. 273(30), 19080–19085 (1998). · DOI
- Vanhaesebroeck, B., Guillermet-Guibert, J., Graupera, M. & Bilanges, B. The emerging mechanisms of isoform-specific PI3K signalling. Nat. Rev. Mol. Cell Biol. 11(5), 329–341 (2010). · DOI · Paper page
- Franke, T. F., Kaplan, D. R., Cantley, L. C. & Toker, A. Direct regulation of the Akt proto-oncogene product by phosphatidylinositol-3,4-bisphosphate. Science 275(5300), 665–668 (1997). · DOI
- Alessi, D. R. et al. Characterization of a 3-phosphoinositide-dependent protein kinase which phosphorylates and activates protein kinase Balpha. Curr. Biol. 7(4), 261–269 (1997). · DOI
- Sarbassov, D. D., Ali, S. M. & Sabatini, D. M. Growing roles for the mTOR pathway. Curr. Opin. Cell Biol. 17(6), 596–603 (2005). · DOI
- Inoki, K., Li, Y., Zhu, T., Wu, J. & Guan, K. L. TSC2 is phosphorylated and inhibited by Akt and suppresses mTOR signalling. Nat Cell Biol. 4(9), 648–657 (2002). · DOI · Paper page
- Vander Haar, E., Lee, S. I., Bandhakavi, S., Griffin, T. J. & Kim, D. H. Insulin signalling to mTOR mediated by the Akt/PKB substrate PRAS40. Nat. Cell Biol. 9(3), 316–323 (2007). · DOI
- Kim, J. B., Wright, H. M., Wright, M. & Spiegelman, B. M. ADD1/SREBP1 activates PPARgamma through the production of endogenous ligand. Proc. Natl. Acad. Sci. USA. 95(8), 4333–4337 (1998). · DOI
Metadata
- Authors
- Rida, R., & Kreydiyyeh, S.
- Affiliations
- American University of Beirut (LB)
- Corresponding author
- Kreydiyyeh, Sawsan
- ORCID
- Kreydiyyeh, Sawsan
- Venue
- Scientific Reports
- Published
- 2023-11-12
- Volume
- 13
- Issue
- 1
- Pages
- 19716-19716
- ISSN
- 2045-2322 (ISSN-L)
- PMC
- PMC10641067
- OpenAlex
- W4388609714
- Cited by
- 14
- References
- 56
- Citations by year
- 2026: 9 · 2025: 4 · 2024: 1
- FWCI
- 2.80
- Type
- journal article
- Language
- en
- Open access
- gold
- doi.org
- Locations
- Scientific Reports (publishedVersion, cc-by)
- PubMed Central (publishedVersion, cc-by)
- PubMed (publishedVersion)
- DOAJ (DOAJ: Directory of Open Access Journals) (submittedVersion, cc-by-sa)
- Funders
- University Research Board, American University of Beirut
- Topics
- Health Sciences › Medicine › Hepatology › Liver Disease Diagnosis and Treatment
- Life Sciences › Biochemistry, Genetics and Molecular Biology › Molecular Biology › Sphingolipid Metabolism and Signaling
- Life Sciences › Biochemistry, Genetics and Molecular Biology › Biochemistry › Lipid metabolism and biosynthesis
- Keywords
- sphingosine-1-phosphate, non-alcoholic fatty liver disease, hepatic steatosis, lipid accumulation, S1PR3, Gq signaling, phosphatidylinositol 3-kinase, mTOR, SREBP, PPARγ, hepatocytes, oleic acid, palmitic acid
- MeSH terms
- Humans, Liver, Lysophospholipids, Organophosphates, Sphingosine, Phosphatidylinositol 3-Kinases, PPAR gamma, Lipid Metabolism, Sterol Regulatory Element Binding Protein 1, Hep G2 Cells, TOR Serine-Threonine Kinases, Non-alcoholic Fatty Liver Disease
About these checks
Registry, retraction, Cites and statistics results are computed, not judged, with one exception: a printed reference that no index lists is read once by a model before it counts as a citation error. Claims are extracted by a model and kept only when their quote appears verbatim in the text; each cited source is then checked, with a model’s help, for whether it says what the claim relies on. Those verdicts can be wrong — read the claim’s quote and the cited source before relying on one.
Statistics and arithmetic are recomputed, not judged.
Confidence bands are shown only for fields calibrated on our annotated test set. None is calibrated yet, so no band is shown.
What counts as a claim ›How we measure confidence ›How we check this ›
Are you an author, or do you see a problem with this page? Request a review
How to cite
Cite CoChat for the checks on this page, and the paper for its own findings.
- This page
- CoChat. (2026). Citation check: Effect of FTY720P on lipid accumulation in HEPG2 cells. https://app.cochat.ai/papers/10.1038/s41598-023-46011-4
- The paper
- Rida, R., & Kreydiyyeh, S. (2023). Effect of FTY720P on lipid accumulation in HEPG2 cells. Scientific Reports. https://doi.org/10.1038/s41598-023-46011-4
