

The DOI matches its Crossref record; 1 of the 1 references it cites were found in a registry or an index.
Dimension reduction of microbiome data linked Bifidobacterium and Prevotella to allergic rhinitis
Abstract
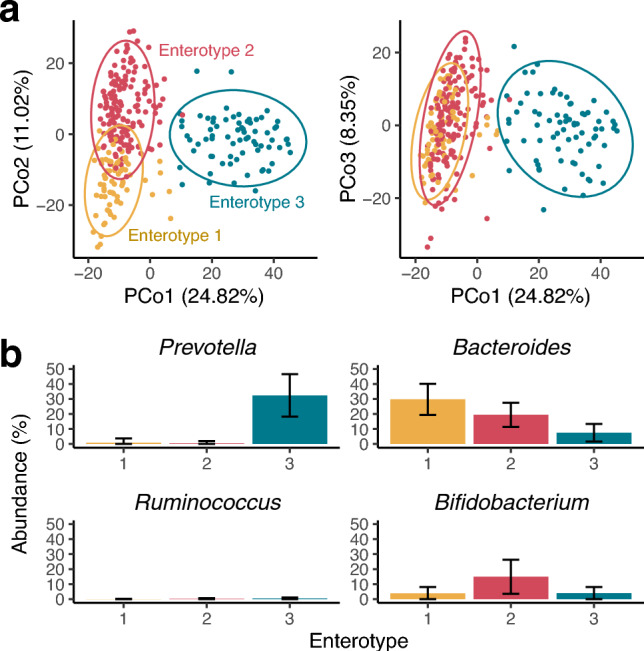
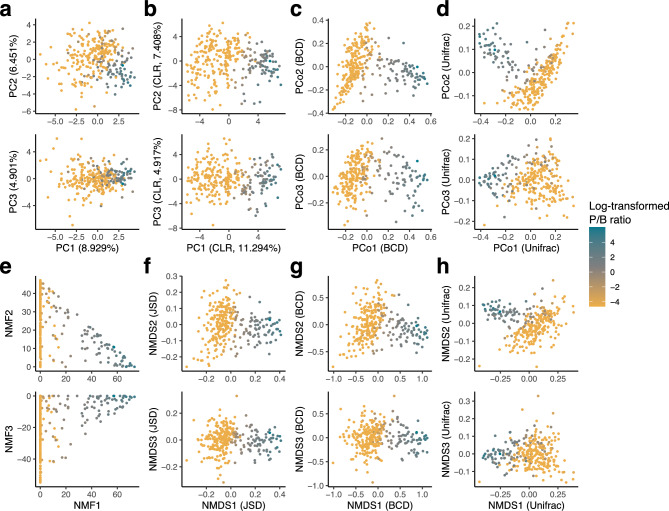
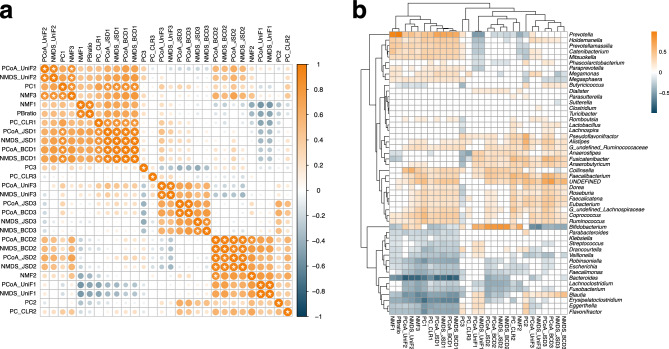
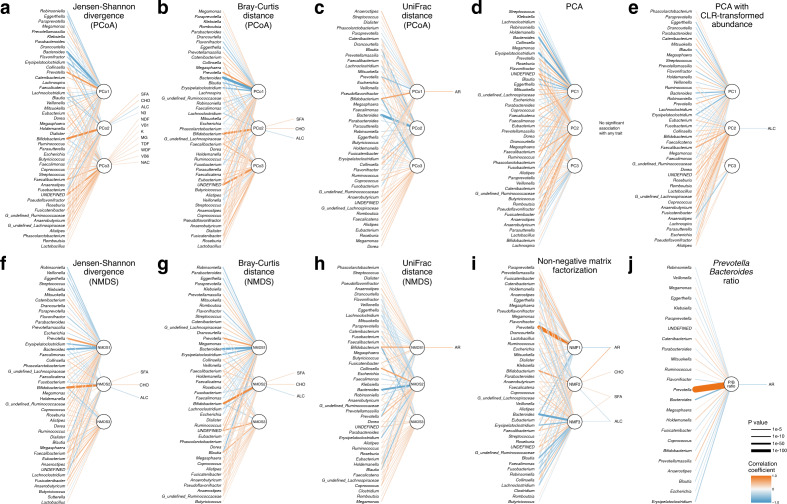
Dimension reduction has been used to visualise the distribution of multidimensional microbiome data, but the composite variables calculated by the dimension reduction methods have not been widely used to investigate the relationship of the human gut microbiome with lifestyle and disease. In the present study, we applied several dimension reduction methods, including principal component analysis, principal coordinate analysis (PCoA), non-metric multidimensional scaling (NMDS), and non-negative matrix factorization, to a microbiome dataset from 186 subjects with symptoms of allergic rhinitis (AR) and 106 controls. All the dimension reduction methods supported that the distribution of microbial data points appeared to be continuous rather than discrete. Comparison of the composite variables calculated from the different dimension reduction methods showed that the characteristics of the composite variables differed depending on the distance matrices and the dimension reduction methods. The first composite variables calculated from PCoA and NMDS with the UniFrac distance were strongly associated with AR (FDR adjusted P = 2.4 × 10⁻⁴ for PCoA and P = 2.8 × 10⁻⁴ for NMDS), and also with the relative abundance of Bifidobacterium and Prevotella. The abundance of Bifidobacterium was also linked to intake of several nutrients, including carbohydrate, saturated fat, and alcohol via composite variables. Notably, the association between the composite variables and AR was much stronger than the association between the relative abundance of individual genera and AR. Our results highlight the usefulness of the dimension reduction methods for investigating the association of microbial composition with lifestyle and disease in clinical research.
Overview
The claims and statistics of this paper haven’t been checked yet.
Run the check — free, no account needed. It reads the open-access text and checks the sources it cites.
Integrity signals
Registry
Cites
Statistics
Figures
Verification
Claims the paper makes
The claims and statistics of this paper haven’t been checked yet.
Run the check — free, no account needed. It reads the open-access text and checks the sources it cites.
Claims other papers make about this one
Each is checked against this paper’s own text: does it say what the citing paper says it does?
In the citing paper
“Specific microbiome profiles have been observed in food-allergic individuals compared to non-allergic controls.”
From Pollen–Food Allergy Syndrome: Allergens, Clinical Insights, Diagnostic and Therapeutic Challenges (2024) · cites this paper as [235]
In the citing paper
“For example, reduced abundances of beneficial genera such as Prevotella and Bifidobacterium, alongside an overrepresentation of potentially proinflammatory species like Neisseria, have been implicated in allergic conditions [235].”
From Pollen–Food Allergy Syndrome: Allergens, Clinical Insights, Diagnostic and Therapeutic Challenges (2024) · cites this paper as [235]
Self-check
Percentages, sums and reported differences re-computed from the paper’s own numbers.
The self-check needs the paper’s full text.
Citations
Cites
Bifidobacteria and Their Health-Promoting Effects
Hidalgo-Cantabrana, C., Delgado, S., Ruiz, L., Ruas-Madiedo, P., Sánchez, B., & Margolles, A. (2017) · Microbiology Spectrum · doi:10.1128/microbiolspec.bad-0010-2016 · Cited by 490
Research works printed but not linked: 37
- Bousquet, J. et al. Allergic Rhinitis and its Impact on Asthma (ARIA) 2008*. Allergy 63, 8–160 (2008). · DOI · Paper page
- Brożek, J. L. et al. Allergic Rhinitis and its Impact on Asthma (ARIA) guidelines—2016 revision. J. Allergy Clin. Immunol. 140, 950–958 (2017). · DOI
- Bjermer, L., Westman, M., Holmström, M. & Wickman, M. C. The complex pathophysiology of allergic rhinitis: Scientific rationale for the development of an alternative treatment option. Allergy Asthma Clin. Immunol. 15, 24 (2019). · DOI
- Pascal, M. et al. Microbiome and allergic diseases. Front. Immunol. 9, 1584 (2018). · DOI
- Hirata, S. & Kunisawa, J. Gut microbiome, metabolome, and allergic diseases. Allergol. Int. 66, 523–528 (2017). · DOI
- McKenzie, C., Tan, J., Macia, L. & Mackay, C. R. The nutrition-gut microbiome-physiology axis and allergic diseases. Immunol. Rev. 278, 277–295 (2017). · DOI
- Wu, G. D. et al. Linking long-term dietary patterns with gut microbial enterotypes. Science 334, 105–108 (2011). · DOI · Paper page
- MetaHIT Consortium (additional members) et al. Enterotypes of the human gut microbiome. Nature 473, 174–180 (2011). · DOI · Paper page
- Mobeen, F., Sharma, V. & Prakash, T. Enterotype variations of the healthy human gut microbiome in different geographical regions. Bioinformation 14, 560–573 (2018). · DOI
- Knights, D. et al. Rethinking “enterotypes”. Cell Host Microbe 16, 433–437 (2014). · DOI · Paper page
- Yang, S. et al. The gut microbiome and antibiotic resistome of chronic diarrhea rhesus macaques (Macaca mulatta) and its similarity to the human gut microbiome. Microbiome 10, 29 (2022). · DOI
- Zhu, L. et al. Gut microbial characteristics of adult patients with allergy rhinitis. Microb Cell Fact 19, 171 (2020). · DOI
- Sahoyama, Y. et al. Multiple nutritional and gut microbial factors associated with allergic rhinitis: The Hitachi Health Study. Sci. Rep. 12, 3359 (2022). · DOI
- Kobayashi, S. et al. Comparison of relative validity of food group intakes estimated by comprehensive and brief-type self-administered diet history questionnaires against 16 d dietary records in Japanese adults. Public Health Nutr. 14, 1200–1211 (2011). · DOI
- Kobayashi, S. et al. Both comprehensive and brief self-administered diet history questionnaires satisfactorily rank nutrient intakes in Japanese adults. J. Epidemiol. 22, 151–159 (2012). · DOI
- Willett, W. & Stampfer, M. J. Total energy intake: Implications for epidemiologic analyses. Am. J. Epidemiol. 124, 17–27 (1986). · DOI · Paper page
- Kim, S.-W. et al. Robustness of gut microbiota of healthy adults in response to probiotic intervention revealed by high-throughput pyrosequencing. DNA Res. 20, 241–253 (2013). · DOI
- Endres, D. M. & Schindelin, J. E. A new metric for probability distributions. IEEE Trans. Inform. Theory 49, 1858–1860 (2003). · DOI
- Walesiak, M. & Dudek, A. The choice of variable normalization method in cluster analysis. Proceedings of the 35th International Business Information Management Association Conference, 325–340 (2020).
- van den Boogaart, K. G. & Tolosana-Delgado, R. “compositions”: A unified R package to analyze compositional data. Comput. Geosci. 34, 320–338 (2008). · DOI
- Baselga, A. Separating the two components of abundance-based dissimilarity: balanced changes in abundance vs. abundance gradients. Methods Ecol. Evol. 4, 552–557 (2013). · DOI
- Baselga, A. & Orme, C. D. L. betapart: an R package for the study of beta diversity. Methods Ecol. Evol. 3, 808–812 (2012). · DOI
- Lozupone, C. & Knight, R. UniFrac: a new phylogenetic method for comparing microbial communities. Appl. Environ. Microbiol. 71, 8228–8235 (2005). · DOI · Paper page
- Edgar, R. C. Search and clustering orders of magnitude faster than BLAST. Bioinformatics 26, 2460–2461 (2010). · DOI
- Lee, D. D. & Seung, H. S. Learning the parts of objects by non-negative matrix factorization. Nature 401, 788–791 (1999). · DOI
- Levy, R. et al. Longitudinal analysis reveals transition barriers between dominant ecological states in the gut microbiome. Proc. Natl. Acad. Sci. USA 117, 13839–13845 (2020). · DOI
- Hjorth, M. F. et al. Prevotella-to-Bacteroides ratio predicts body weight and fat loss success on 24-week diets varying in macronutrient composition and dietary fiber: Results from a post-hoc analysis. Int. J. Obes. 43, 149–157 (2019). · DOI
- Hothorn, T., Hornik, K., van de Wiel, M. A. & Zeileis, A. A Lego system for conditional inference. Am. Stat. 60, 257–263 (2006). · DOI
- Benjamini, Y. & Hochberg, Y. Controlling the false discovery rate: A practical and powerful approach to multiple testing. J. R. Stat. Soc. Ser. B (Methodol.) 57, 289–300 (1995). · DOI · Paper page
- Ruiz, L., Delgado, S., Ruas-Madiedo, P., Sánchez, B. & Margolles, A. Bifidobacteria and their molecular communication with the immune system. Front. Microbiol. 8, 2345 (2017). · DOI
- Alessandri, G., Ossiprandi, M. C., MacSharry, J., van Sinderen, D. & Ventura, M. Bifidobacterial dialogue with its human host and consequent modulation of the immune system. Front. Immunol. 10, 2348 (2019). · DOI
- Fukuda, S. et al. Bifidobacteria can protect from enteropathogenic infection through production of acetate. Nature 469, 543–547 (2011). · DOI · Paper page
- Duranti, S. et al. Elucidating the gut microbiome of ulcerative colitis: bifidobacteria as novel microbial biomarkers. FEMS Microbiol. Ecol. 92, fiw191 (2016). · DOI
- Fujimura, K. E. et al. Neonatal gut microbiota associates with childhood multisensitized atopy and T cell differentiation. Nat. Med. 22, 1187–1191 (2016). · DOI
- Singh, A. et al. Immune-modulatory effect of probiotic Bifidobacterium lactis NCC2818 in individuals suffering from seasonal allergic rhinitis to grass pollen: an exploratory, randomized, placebo-controlled clinical trial. Eur. J. Clin. Nutr. 67, 161–167 (2013). · DOI · Paper page
- Pokusaeva, K., Fitzgerald, G. F. & Van Sinderen, D. Carbohydrate metabolism in Bifidobacteria. Genes Nutr. 6, 285–306 (2011). · DOI
- Hizo, G. H. & Rampelotto, P. H. The role of bifidobacterium in liver diseases: A systematic review of next-generation sequencing studies. Microorganisms 11, 2999 (2023). · DOI
Cited by
Sorted by citations
Pollen–Food Allergy Syndrome: Allergens, Clinical Insights, Diagnostic and Therapeutic Challenges
Haidar, L., Bănărescu, C. F., Uța, C., Moldovan, S. I., Zimbru, E.-L., Zimbru, R.-I., Ciurariu, E., Georgescu, M., & Panaitescu, C. (2024) · Applied Sciences · doi:10.3390/app15010066 · Cited by 21
Metadata
- Authors
- Komaki, S., Sahoyama, Y., Hachiya, T., Koseki, K., Ogata, Y., Hamazato, F., Shiozawa, M., Nakagawa, T., Suda, W., Hattori, M., & Kawakami, E.
- Venue
- Scientific Reports
- Published
- 2024-04-05
- Volume
- 14
- Issue
- 1
- ISSN
- 2045-2322
- PMC
- PMC10995140
- Cited by
- 13
- References
- 1
- Language
- en
About these checks
Registry, retraction, Cites and statistics results are computed, not judged, with one exception: a printed reference that no index lists is read once by a model before it counts as a citation error. Claims are extracted by a model and kept only when their quote appears verbatim in the text; each cited source is then checked, with a model’s help, for whether it says what the claim relies on. Those verdicts can be wrong — read the claim’s quote and the cited source before relying on one.
Statistics and arithmetic are recomputed, not judged.
Confidence bands are shown only for fields calibrated on our annotated test set. None is calibrated yet, so no band is shown.
What counts as a claim ›How we measure confidence ›How we check this ›
Are you an author, or do you see a problem with this page? Request a review
