Cited by 8

The DOI matches its Crossref record; 2 of the 2 references it cites were found in a registry or an index.

TRIM44 enhances autophagy via SQSTM1 oligomerization in response to oxidative stress

Wang, Yuqin, Lyu, Lin, Vu, Trung, McCarty, Nami·2024·Scientific Reports

Overview

The claims and statistics of this paper haven’t been checked yet.

Run the check — free, no account needed. It reads the open-access text and checks the sources it cites.

A few free checks a day · papers already verified open instantly · results are public

Integrity signals

Registry

Crossref · 10.1038/s41598-024-67832-x

Cites

2 of 2 references verified0 citation errors · 0 not checkable

Statistics

Figures

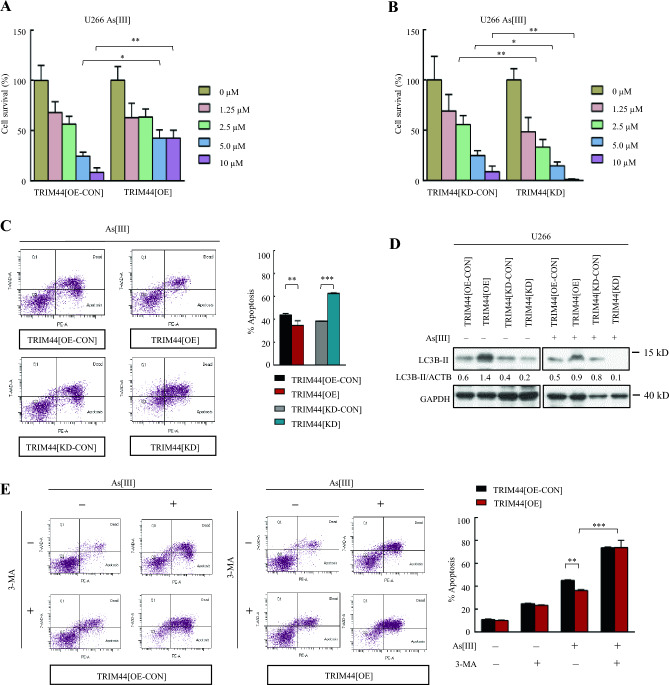
Figure 1 TRIM44 attenuates cytotoxicity via enhancing autophagy in response to oxidative stress. (A) Cell survival assay. U266 TRIM44[OE-CON] and TRIM44[OE] cells were challenged with different concentrations of As[III] as indicated for 24 h. Percentage of cell survival was determined by cell counting with trypan blue staining. Error bars represent s.e.m., n = 3, *P < 0.05, **P < 0.01 (unpaired t-tests). (B) Cell survival assay. U266 TRIM44[KD-CON] and TRIM44[KD] cells were challenged with different concentrations of As[III] as indicated for 24 h. Percentage of cell survival was determined by cell counting with trypan blue staining. Error bars represent s.e.m., n = 3, *P < 0.05, **P < 0.01 (unpaired t-tests). (C) Flow cytometry analysis. U266 cells were treated with or without As[III] (5 μM, 24 h) and then subjected to be stained with PE/7-AAD. Percentage of apoptosis was quantified. **P < 0.01, ***P < 0.001 (unpaired t-tests). (D) Immunoblot analysis. U266 cells were treated with or without As[III] (5 μM) for 24 h. Cell lysates were then analyzed by immunoblotting for LC3B-II. GAPDH was used as a loading control. (E) Flow cytometry analysis. U266 cells were co-treated with or without As[III] (5 μM) and autophagy inhibitor 3-Methyladenine (3-MA, 500 μM) for 24 h. and then subjected to be stained with PE/7-AAD. Percentage of apoptosis was quantified. **P < 0.01, ***P < 0.001 (unpaired t-tests).
Figure 1 TRIM44 attenuates cytotoxicity via enhancing autophagy in response to oxidative stress. (A) Cell survival assay. U266 TRIM44[OE-CON] and TRIM44[OE] cells were challenged with different concentrations of As[III] as indicated for 24 h. Percentage of cell survival was determined by cell counting with trypan blue staining. Error bars represent s.e.m., n = 3, *P < 0.05, **P < 0.01 (unpaired t-tests). (B) Cell survival assay. U266 TRIM44[KD-CON] and TRIM44[KD] cells were challenged with different concentrations of As[III] as indicated for 24 h. Percentage of cell survival was determined by cell counting with trypan blue staining. Error bars represent s.e.m., n = 3, *P < 0.05, **P < 0.01 (unpaired t-tests). (C) Flow cytometry analysis. U266 cells were treated with or without As[III] (5 μM, 24 h) and then subjected to be stained with PE/7-AAD. Percentage of apoptosis was quantified. **P < 0.01, ***P < 0.001 (unpaired t-tests). (D) Immunoblot analysis. U266 cells were treated with or without As[III] (5 μM) for 24 h. Cell lysates were then analyzed by immunoblotting for LC3B-II. GAPDH was used as a loading control. (E) Flow cytometry analysis. U266 cells were co-treated with or without As[III] (5 μM) and autophagy inhibitor 3-Methyladenine (3-MA, 500 μM) for 24 h. and then subjected to be stained with PE/7-AAD. Percentage of apoptosis was quantified. **P < 0.01, ***P < 0.001 (unpaired t-tests).CC BY-NC-ND · PubMed Central
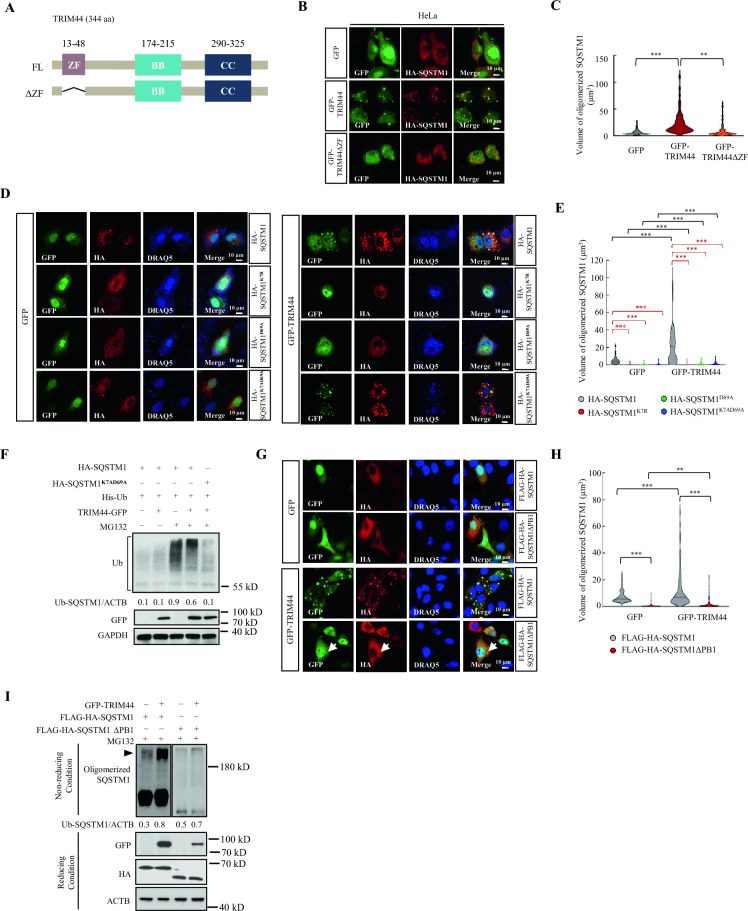
Figure 2 TRIM44 promotes SQSTM1 oligomerization. (A) The domain structure of TRIM44 protein. Depicts full-length (FL) TRIM44 (aa 1-344), ΔZF truncate (aa 48–344). (B) Confocal microscopy of HeLa cells co-transfected with HA-SQSTM1 and GFP, or GFP-TRIM44 full-length or GFP-TRIM44ΔZF. Immunostaining with HA antibody was done after 48 h. Scale bars represent 10 μm. (C) Graph illustrating the average volume of HA-SQSTM1 oligomerization. Average volume from 50 cells counted for each data point (bar). Statistical analysis via one-way ANOVA with Tukey's test, **P < 0.01, ***P < 0.001. (D) Confocal microscopy of HeLa cells co-transfected with GFP or GFP-TRIM44 and specific HA-SQSTM1 constructs (HA-SQSTM1, HA-SQSTM1K7R, HA-SQSTMQD69A, and HA-SQSTM1K7AD69A). Immunostaining with HA antibody performed post 48 h. Scale bars: 10 µm. (E) Graph of average volume of HA-SQSTM1 constructs oligomerization (HA-SQSTM1, HA-SQSTM1K7R, HA-SQSTM1D69A, and HA-SQSTM1K7AD69A). One-way ANOVA with Tukey's test for statistical analysis. ***P < 0.001. Black star (*) denotes GFP-TRIM44 transfected cells versus corresponding GFP transfected cells. Red star (*) denotes HA-SQSTM1 mutants’ transfected cells versus corresponding wild-type HA-SQSTM1 transfected cells. (F) In vivo deubiquitylation assay. 293T cells were co-transfected with HA-SQSTM1 constructs (HA-SQSTM1 and HA-SQSTM1K7AD69A), His-Ubiquitin and GFP-TRIM44 plasmids. Post 48 h, cells were treated with proteasome inhibitor MG132 (5 μM, 6 h), followed by immunoprecipitation with HA antibody. Anti-Ub antibody was used to immunoblot ubiquitinated HA-SQSTM1 and HA-SQSTM1K7AD69A. (G) HeLa cells were transfected with FLAG-HA-SQSTM1 or FLAG-HA-SQSTM1ΔPB1 mutant (lacking PB1 domain), in conjunction with either GFP or GFP-TRIM44. After 48 h, immunostaining was performed with HA (red) and DRAQ5 (blue). Scale bars represent 10 μm. (H) Graphic presentation of the average oligomerization volume of SQSTM1 (FLAG-HASQSTM1, FLAG-HA-SQSTM1ΔPB1). Each bar reflects the oligomerization volume of the indicated HA-SQSTM1 constructs in 50 cells. Statistical analysis was carried out using one-way ANOVA with Tukey's test, with **P < 0.01 and ***P < 0.001. (I) 293T cells were co-transfected with the indicated plasmids. After 48 h, cells were cross-linked with DSP (0.4 mg/ml, 4 °C, 2 h) and processed under either reducing (with β-ME) or nonreducing conditions (without β-ME). The lysates were then subjected to immunoblotting using the indicated antibodies.
Figure 2 TRIM44 promotes SQSTM1 oligomerization. (A) The domain structure of TRIM44 protein. Depicts full-length (FL) TRIM44 (aa 1-344), ΔZF truncate (aa 48–344). (B) Confocal microscopy of HeLa cells co-transfected with HA-SQSTM1 and GFP, or GFP-TRIM44 full-length or GFP-TRIM44ΔZF. Immunostaining with HA antibody was done after 48 h. Scale bars represent 10 μm. (C) Graph illustrating the average volume of HA-SQSTM1 oligomerization. Average volume from 50 cells counted for each data point (bar). Statistical analysis via one-way ANOVA with Tukey's test, **P < 0.01, ***P < 0.001. (D) Confocal microscopy of HeLa cells co-transfected with GFP or GFP-TRIM44 and specific HA-SQSTM1 constructs (HA-SQSTM1, HA-SQSTM1K7R, HA-SQSTMQD69A, and HA-SQSTM1K7AD69A). Immunostaining with HA antibody performed post 48 h. Scale bars: 10 µm. (E) Graph of average volume of HA-SQSTM1 constructs oligomerization (HA-SQSTM1, HA-SQSTM1K7R, HA-SQSTM1D69A, and HA-SQSTM1K7AD69A). One-way ANOVA with Tukey's test for statistical analysis. ***P < 0.001. Black star (*) denotes GFP-TRIM44 transfected cells versus corresponding GFP transfected cells. Red star (*) denotes HA-SQSTM1 mutants’ transfected cells versus corresponding wild-type HA-SQSTM1 transfected cells. (F) In vivo deubiquitylation assay. 293T cells were co-transfected with HA-SQSTM1 constructs (HA-SQSTM1 and HA-SQSTM1K7AD69A), His-Ubiquitin and GFP-TRIM44 plasmids. Post 48 h, cells were treated with proteasome inhibitor MG132 (5 μM, 6 h), followed by immunoprecipitation with HA antibody. Anti-Ub antibody was used to immunoblot ubiquitinated HA-SQSTM1 and HA-SQSTM1K7AD69A. (G) HeLa cells were transfected with FLAG-HA-SQSTM1 or FLAG-HA-SQSTM1ΔPB1 mutant (lacking PB1 domain), in conjunction with either GFP or GFP-TRIM44. After 48 h, immunostaining was performed with HA (red) and DRAQ5 (blue). Scale bars represent 10 μm. (H) Graphic presentation of the average oligomerization volume of SQSTM1 (FLAG-HASQSTM1, FLAG-HA-SQSTM1ΔPB1). Each bar reflects the oligomerization volume of the indicated HA-SQSTM1 constructs in 50 cells. Statistical analysis was carried out using one-way ANOVA with Tukey's test, with **P < 0.01 and ***P < 0.001. (I) 293T cells were co-transfected with the indicated plasmids. After 48 h, cells were cross-linked with DSP (0.4 mg/ml, 4 °C, 2 h) and processed under either reducing (with β-ME) or nonreducing conditions (without β-ME). The lysates were then subjected to immunoblotting using the indicated antibodies.CC BY-NC-ND · PubMed Central
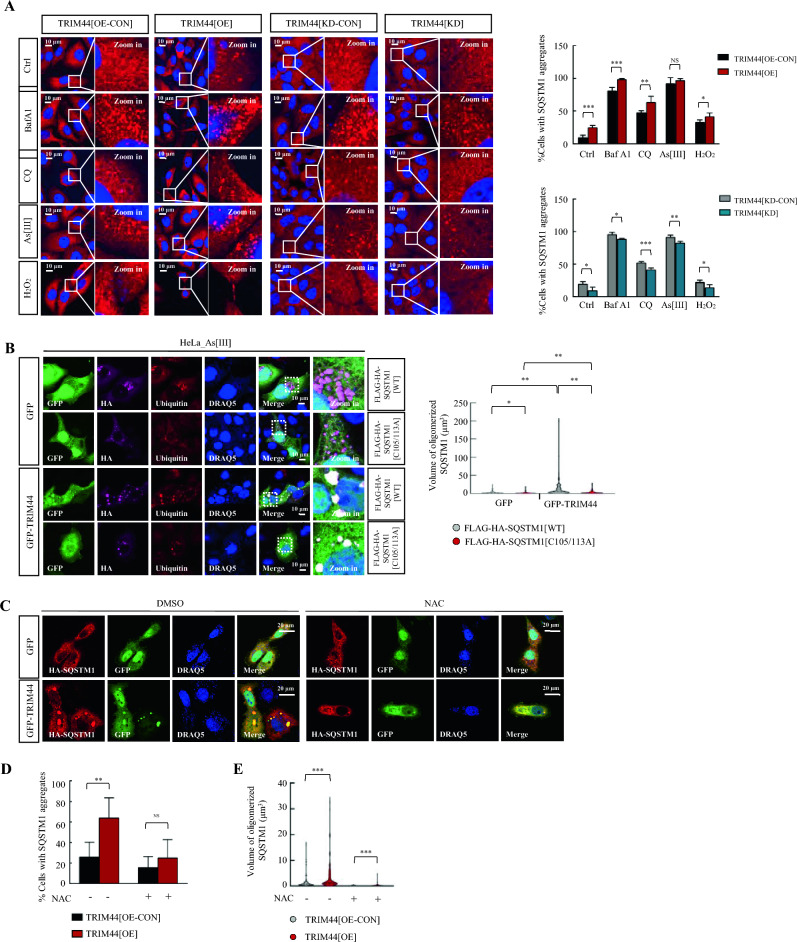
Figure 3 TRIM44 promotes SQSTM1 oligomerization in response to oxidative stresses. (A) Confocal microscopy of HeLa stable cells (TRIM44[OE-CON], or TRIM44[OE], TRIM44[KD-CON] and TRIM44[KD]) treated with Bafilomycin A1 (Baf A1, 400 nM, 4 h), or chloroquine (CQ, 50 μM, 4 h), or arsenic trioxide (As[III], 5 μM, 4 h), or hydrogen peroxide (H2O2, 3 mM, 10 min). Immunostaining with anti-SQSTM1 antibody was performed. Cells with more than two visible SQSTM1 aggregates were considered positive. n = 3, mean ± SD, *P < 0.05, **P < 0.01, ***P < 0.005 (Student's unpaired t test). (B) Immunofluorescence staining of HeLa cells co-transfected with indicated plasmids. After 48 h, cells were challenged with As[III] (5 μM, 24 h) and immunostained with anti-HA (magenta), anti-ubiquitin (red), and DRAQ5 (blue). Volume of oligomerized SQSTM1 was quantified (mean ± SD, n = 3, **P < 0.01, ***P < 0.005, one-way ANOVA with Tukey's test). (C) Immunofluorescence staining. HeLa cells co-transfected with indicated plasmids. After 24 h, cells were treated with or without NAC (0.2 mM, 24 h). Immunostaining with anti-HA antibody (red) and DRAQ5 (blue) was performed. Scale bars represent 20 μm. (D) Percentage of cells with SQSTM1 aggregates was quantified. Cells with more than two visible SQSTM1 aggregates were considered positive (n = 3, mean ± SD, **P < 0.01 (Student's unpaired t test). (E) Volume of oligomerized SQSTM1 was quantified. Student's unpaired t test was used for statistical analysis (***P < 0.001).
Figure 3 TRIM44 promotes SQSTM1 oligomerization in response to oxidative stresses. (A) Confocal microscopy of HeLa stable cells (TRIM44[OE-CON], or TRIM44[OE], TRIM44[KD-CON] and TRIM44[KD]) treated with Bafilomycin A1 (Baf A1, 400 nM, 4 h), or chloroquine (CQ, 50 μM, 4 h), or arsenic trioxide (As[III], 5 μM, 4 h), or hydrogen peroxide (H2O2, 3 mM, 10 min). Immunostaining with anti-SQSTM1 antibody was performed. Cells with more than two visible SQSTM1 aggregates were considered positive. n = 3, mean ± SD, *P < 0.05, **P < 0.01, ***P < 0.005 (Student's unpaired t test). (B) Immunofluorescence staining of HeLa cells co-transfected with indicated plasmids. After 48 h, cells were challenged with As[III] (5 μM, 24 h) and immunostained with anti-HA (magenta), anti-ubiquitin (red), and DRAQ5 (blue). Volume of oligomerized SQSTM1 was quantified (mean ± SD, n = 3, **P < 0.01, ***P < 0.005, one-way ANOVA with Tukey's test). (C) Immunofluorescence staining. HeLa cells co-transfected with indicated plasmids. After 24 h, cells were treated with or without NAC (0.2 mM, 24 h). Immunostaining with anti-HA antibody (red) and DRAQ5 (blue) was performed. Scale bars represent 20 μm. (D) Percentage of cells with SQSTM1 aggregates was quantified. Cells with more than two visible SQSTM1 aggregates were considered positive (n = 3, mean ± SD, **P < 0.01 (Student's unpaired t test). (E) Volume of oligomerized SQSTM1 was quantified. Student's unpaired t test was used for statistical analysis (***P < 0.001).CC BY-NC-ND · PubMed Central
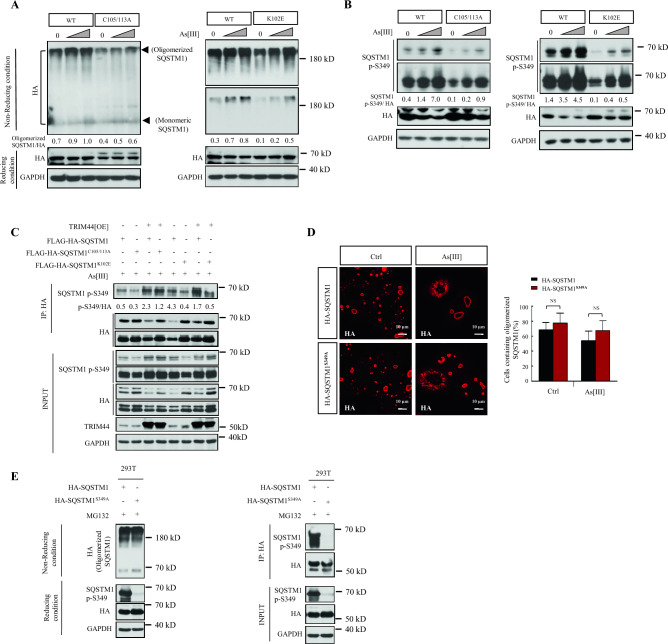
Figure 4 Oligomerization of SQSTM1 is essential for its phosphorylation at S349. (A) HeLa cells stable expressing WT FLAG-HA-SQSTM1 (WT), FLAG-HA-SQSTM1 [C105/113A] (C105/113A) or FLAG-HA-SQSTM1[K102E] (K102E) were treated with As[III] (from 2.5 to 5 μM, 6 h), followed by cross-linking with DSP (0.4 mg/ml, 4 °C, 2 h). Cell lysates, prepared under reducing (with β-ME) or non-reducing condition (without β-ME), were subjected to immunoblotting for indicated antibodies. (B) 293T cells stably expressing WT FLAG-HA-SQSTM1, FLAG-HA SQSTM1[C105/113A] (C105/113A) or FLAG-HA-SQSTM1[K102E] (K102E) were treated with As[III] (from 2.5 to 5 μM, 6 h). Whole-cell lysates were examined for SQSTM1 p-S349, HA expression by immunoblotting (GAPDH was used as a loading control). (C) 293T cells stably co-expressing indicated SQSTM1 wild-type or SQSTM1 mutations with or without TRIM44 were treated with As[III] (5 μM) for 6 h. Immunoprecipation was performed with anti-HA antibody and immunoblotting for SQSTM1 p-S349 and HA. (D) Immunofluorescence staining of HeLa cells transfected with indicated HA-SQSTM1 constructs (HA-SQSTM1, and HA-SQSTM1S349A). After 48 h, cells were treated with or without As[III] (5 μM, 24 h). Immunostaining with anti-HA antibody was performed. Percentage of cells containing oligomerized SQSTM1 was analyzed. Cells with more than two visible SQSTM1 aggregates were considered positive. n = 3, mean ± SD. NS, non-significant (Student's unpaired t test). (E) 293T cells were transfected with HA-SQSTM1 constructs and expressed to MG132 (5 μM) for a duration of 6 h. The treated cells were subsequently cross-linked with DSP (0.4 mg/ml, 4 °C, 2 h) and prepared under either reducing conditions (with β-ME) or nonreducing condition (without β-ME). Cell lysates were subjected to immunoblotting for the indicated antibodies. Immunoprecipitation was executed using an anti-HA antibody and immunoblotting for SQSTM1 p-S349 and HA.
Figure 4 Oligomerization of SQSTM1 is essential for its phosphorylation at S349. (A) HeLa cells stable expressing WT FLAG-HA-SQSTM1 (WT), FLAG-HA-SQSTM1 [C105/113A] (C105/113A) or FLAG-HA-SQSTM1[K102E] (K102E) were treated with As[III] (from 2.5 to 5 μM, 6 h), followed by cross-linking with DSP (0.4 mg/ml, 4 °C, 2 h). Cell lysates, prepared under reducing (with β-ME) or non-reducing condition (without β-ME), were subjected to immunoblotting for indicated antibodies. (B) 293T cells stably expressing WT FLAG-HA-SQSTM1, FLAG-HA SQSTM1[C105/113A] (C105/113A) or FLAG-HA-SQSTM1[K102E] (K102E) were treated with As[III] (from 2.5 to 5 μM, 6 h). Whole-cell lysates were examined for SQSTM1 p-S349, HA expression by immunoblotting (GAPDH was used as a loading control). (C) 293T cells stably co-expressing indicated SQSTM1 wild-type or SQSTM1 mutations with or without TRIM44 were treated with As[III] (5 μM) for 6 h. Immunoprecipation was performed with anti-HA antibody and immunoblotting for SQSTM1 p-S349 and HA. (D) Immunofluorescence staining of HeLa cells transfected with indicated HA-SQSTM1 constructs (HA-SQSTM1, and HA-SQSTM1S349A). After 48 h, cells were treated with or without As[III] (5 μM, 24 h). Immunostaining with anti-HA antibody was performed. Percentage of cells containing oligomerized SQSTM1 was analyzed. Cells with more than two visible SQSTM1 aggregates were considered positive. n = 3, mean ± SD. NS, non-significant (Student's unpaired t test). (E) 293T cells were transfected with HA-SQSTM1 constructs and expressed to MG132 (5 μM) for a duration of 6 h. The treated cells were subsequently cross-linked with DSP (0.4 mg/ml, 4 °C, 2 h) and prepared under either reducing conditions (with β-ME) or nonreducing condition (without β-ME). Cell lysates were subjected to immunoblotting for the indicated antibodies. Immunoprecipitation was executed using an anti-HA antibody and immunoblotting for SQSTM1 p-S349 and HA.CC BY-NC-ND · PubMed Central
Figure 5 TRIM44 facilitates SQSTM1 S349 phosphorylation via PKA. (A) U266 TRIM44[OE-CON], TRIM44[OE] cells were exposed to inhibitors targeting CKI (CKI-7, 100 µM, 6 h), GSK3 (CHIR-99021, 2 µM, 24 h), CaMKII (KN-62, 1 µM, 24 h), and PKA (H89, 5 µM, 24 h), and As[III] (5 µM, 6 h) or left untreated. Whole-cell lysates were examined using anti-SQSTM1, anti-SQSTM1 p-S349. GAPDH served as a loading control. (B) Cell extracts from U266 TRIM44[OE-CON], TRIM44[OE], TRIM44[KD-CON] and TRIM44[KD] cells were lysed for measure PKA activity (PKA Kinase activity Kit, Abcam, ab139435). Measurements were made in triplicates, mean ± SD. Student's t test was used for statistical analysis *P < 0.05, **P < 0.01. (C) 293T cells stably co-expressing FLAG-HA-SQSTM1 with TRIM44 (TRIM44[OE]) or without TRIM44 (TRIM44[OE-CON) were treated with or without As[III] (5 μM, 6 h). Immunoprecipitation was subsequently performed with an anti-PKA substrate antibody and immunoblotting for indicated signals. (D) U266 TRIM44[KD-CON], TRIM44[KD] cells were treated with or without As[III] (5 μM, 24 h). Whole-cell lysates were analyzed via immunoblotting for SQSTM1 p-S349, SQSTM1, PKA Cα. (E) U266 TRIM44[OE-CON] and TRIM44[OE] cells were transfected with NC or PKA Cα siRNA. After 48 h, whole-cell lysates were analyzed via immunoblotting for SQSTM1 pS349 and SQSTM1, PKA Cα. (F) 293T cells stably co-expressing FLAG-HA-SQSTM1 with TRIM44 (TRIM44[OE]) or without TRIM44 (TRIM44[OE-CON) were treated with or without Baf A1 (100 nM, 6 h). Immunoprecipitation was subsequently performed with an anti-HA antibody and immunoblotting for indicated signals.
Figure 5 TRIM44 facilitates SQSTM1 S349 phosphorylation via PKA. (A) U266 TRIM44[OE-CON], TRIM44[OE] cells were exposed to inhibitors targeting CKI (CKI-7, 100 µM, 6 h), GSK3 (CHIR-99021, 2 µM, 24 h), CaMKII (KN-62, 1 µM, 24 h), and PKA (H89, 5 µM, 24 h), and As[III] (5 µM, 6 h) or left untreated. Whole-cell lysates were examined using anti-SQSTM1, anti-SQSTM1 p-S349. GAPDH served as a loading control. (B) Cell extracts from U266 TRIM44[OE-CON], TRIM44[OE], TRIM44[KD-CON] and TRIM44[KD] cells were lysed for measure PKA activity (PKA Kinase activity Kit, Abcam, ab139435). Measurements were made in triplicates, mean ± SD. Student's t test was used for statistical analysis *P < 0.05, **P < 0.01. (C) 293T cells stably co-expressing FLAG-HA-SQSTM1 with TRIM44 (TRIM44[OE]) or without TRIM44 (TRIM44[OE-CON) were treated with or without As[III] (5 μM, 6 h). Immunoprecipitation was subsequently performed with an anti-PKA substrate antibody and immunoblotting for indicated signals. (D) U266 TRIM44[KD-CON], TRIM44[KD] cells were treated with or without As[III] (5 μM, 24 h). Whole-cell lysates were analyzed via immunoblotting for SQSTM1 p-S349, SQSTM1, PKA Cα. (E) U266 TRIM44[OE-CON] and TRIM44[OE] cells were transfected with NC or PKA Cα siRNA. After 48 h, whole-cell lysates were analyzed via immunoblotting for SQSTM1 pS349 and SQSTM1, PKA Cα. (F) 293T cells stably co-expressing FLAG-HA-SQSTM1 with TRIM44 (TRIM44[OE]) or without TRIM44 (TRIM44[OE-CON) were treated with or without Baf A1 (100 nM, 6 h). Immunoprecipitation was subsequently performed with an anti-HA antibody and immunoblotting for indicated signals.CC BY-NC-ND · PubMed Central
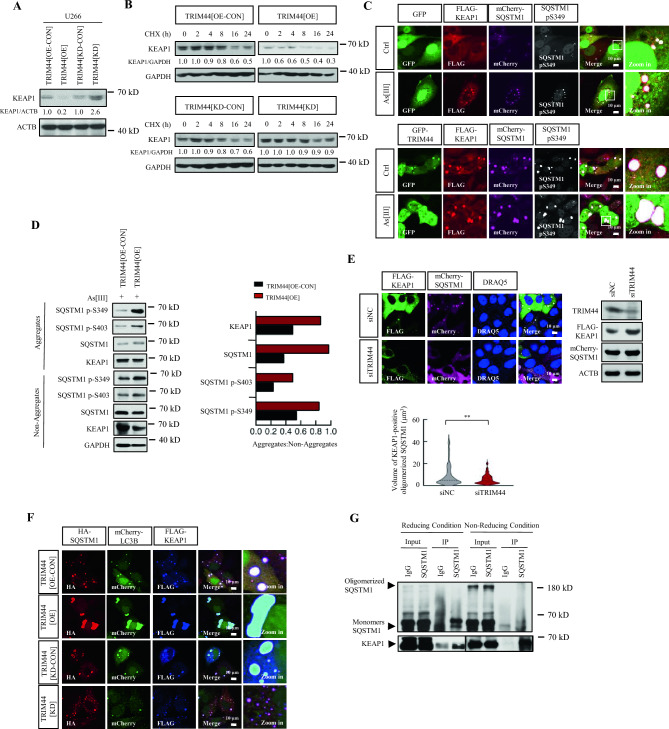
Figure 6 TRIM44-mediated phosphorylation of SQSTM1 accelerates KEAP1 degradation. (A) Immunoblot analysis was conducted on whole-cell lysates from U266 TRIM44[OECON], TRIM44[OE], TRIM44[KD-CON] and TRIM44[KD] cells, examining for KEAP1. (B) HeLa TRIM44[OE-CON], TRIM44[OE], TRIM44[KD-CON] and TRIM44[KD] cells were treated with cycloheximide (100 μg/ml) for specified durations. Whole-cell lysates were then analyzed via immunoblotting for KEAP1. GAPDH was utilized as a loading control. (C) Confocal microscopy of HeLa cells tri-transfected with FLAG-KEAP1, mCherry-SQSTM1 and GFP or GFP-TRIM44. After 24 h, cells were treated with or without As[III] for another 24 h. Immunostaining with anti-FLAG (red), and anti-SQSTM1 p-S349 (white) was performed. Expression of GFP-TRIM44 or GFP was shown as green, and mCherry-SQSTM1 was shown as magenta color. Scale bars represent 10 μm. (D) HeLa TRIM44[OE-CON] and TRIM44[OE] cells were treated with As[III] (5 μM) for 6 h. Whole-cell lysates were analyzed by immunoblotting. Non-Aggregates: NP-40-soluble; Aggregates: SDS-soluble, NP40 insoluble. Relative ratios of Non-Aggregates or Aggregates versus GAPDH are indicated. (E) HeLa cells were transfected with NC or TRIM44 siRNA. After 24 h, cells were then co-transfected with FLAG-KEAP1 and mCherry-SQSTM1 for another 24 h. Immunostaining with anti-FLAG antibody (green) and DRAQ5 (blue) were performed. Expression of mCherry-SQSTM1 was shown as magenta color. Scale bars represent 20 μm. Cells were also analyzed by immunoblotting for TRIM44, FLAG and mCherry. GAPDH was used as a loading control. Volume of KEAP1-positive oligomerized SQSTM1 was quantified. Student's unpaired t test was used for statistical analysis. **P < 0.01. (F) Immunofluorescence staining. HeLa TRIM44[OE-CON], TRIM44[OE], TRIM44[KD-CON], TRIM44[KD] cells were tri-transfected with HA-SQSTM1, mCherry-LC3B, and FLAG-KEAP1. After 48 h, cells were immunostained with anti-HA (red), and anti-FLAG (blue). Expression of mCherry-LC3 was shown as green color. Scale bars, represent 10 μm. (G) 293T cells were co-transfected with FLAG-KEAP1 and mCherry-SQSTM1. After 48 h, the cells were treated with MG132 (5 μM, 6 h) and then treated with the crosslinking agent DSP (0.4 mg/ml, 4 °C) for 2 h. Subsequently, the cells were lysed in IP lysis buffer containing 1% SDS. The lysates were mixed with loading buffer containing β-ME for reducing condition or without β-ME (non-reducing condition). The samples were then subjected to SDS-PAGE and immunoblotting for SQSTM1 and KEAP1.
Figure 6 TRIM44-mediated phosphorylation of SQSTM1 accelerates KEAP1 degradation. (A) Immunoblot analysis was conducted on whole-cell lysates from U266 TRIM44[OECON], TRIM44[OE], TRIM44[KD-CON] and TRIM44[KD] cells, examining for KEAP1. (B) HeLa TRIM44[OE-CON], TRIM44[OE], TRIM44[KD-CON] and TRIM44[KD] cells were treated with cycloheximide (100 μg/ml) for specified durations. Whole-cell lysates were then analyzed via immunoblotting for KEAP1. GAPDH was utilized as a loading control. (C) Confocal microscopy of HeLa cells tri-transfected with FLAG-KEAP1, mCherry-SQSTM1 and GFP or GFP-TRIM44. After 24 h, cells were treated with or without As[III] for another 24 h. Immunostaining with anti-FLAG (red), and anti-SQSTM1 p-S349 (white) was performed. Expression of GFP-TRIM44 or GFP was shown as green, and mCherry-SQSTM1 was shown as magenta color. Scale bars represent 10 μm. (D) HeLa TRIM44[OE-CON] and TRIM44[OE] cells were treated with As[III] (5 μM) for 6 h. Whole-cell lysates were analyzed by immunoblotting. Non-Aggregates: NP-40-soluble; Aggregates: SDS-soluble, NP40 insoluble. Relative ratios of Non-Aggregates or Aggregates versus GAPDH are indicated. (E) HeLa cells were transfected with NC or TRIM44 siRNA. After 24 h, cells were then co-transfected with FLAG-KEAP1 and mCherry-SQSTM1 for another 24 h. Immunostaining with anti-FLAG antibody (green) and DRAQ5 (blue) were performed. Expression of mCherry-SQSTM1 was shown as magenta color. Scale bars represent 20 μm. Cells were also analyzed by immunoblotting for TRIM44, FLAG and mCherry. GAPDH was used as a loading control. Volume of KEAP1-positive oligomerized SQSTM1 was quantified. Student's unpaired t test was used for statistical analysis. **P < 0.01. (F) Immunofluorescence staining. HeLa TRIM44[OE-CON], TRIM44[OE], TRIM44[KD-CON], TRIM44[KD] cells were tri-transfected with HA-SQSTM1, mCherry-LC3B, and FLAG-KEAP1. After 48 h, cells were immunostained with anti-HA (red), and anti-FLAG (blue). Expression of mCherry-LC3 was shown as green color. Scale bars, represent 10 μm. (G) 293T cells were co-transfected with FLAG-KEAP1 and mCherry-SQSTM1. After 48 h, the cells were treated with MG132 (5 μM, 6 h) and then treated with the crosslinking agent DSP (0.4 mg/ml, 4 °C) for 2 h. Subsequently, the cells were lysed in IP lysis buffer containing 1% SDS. The lysates were mixed with loading buffer containing β-ME for reducing condition or without β-ME (non-reducing condition). The samples were then subjected to SDS-PAGE and immunoblotting for SQSTM1 and KEAP1.CC BY-NC-ND · PubMed Central
Figure 7 TRIM44 regulates the SQSTM1‐KEAP1‐NFE2L2 system. (A) U266 TRIM44[OE-CON], TRIM44[OE], TRIM44[KD-CON] and TRIM44[KD] cells were treated with or without As[III] (5 μM, 6 h). Nuclear fractions and cytoplasmic fractions were prepared and then subjected to immunoblot analysis with indicated antibodies. Relative levels of NFE2L2 in nuclear and KEAP1 in cytoplasm were quantified. (B) Quantitation of messenger RNA (mRNA) levels of NFE2L2 targets in U266 stable cells. Cells were challenged with or without As[III] (5 μM, 24 h) and then subjected to qRT-PCR analysis with indicated genes. The experiments were performed three times. Data are mean ± SD. Statistical analysis was carried out using Student’s t test, with *P < 0.05, **P < 0.01 and ***P < 0.001. (C) Immunoprecipitation assays. 293T (TRIM44[OE-CON], TRIM44[OE], TRIM44[KDCON], and TRIM44[KD]) cells were tri-transfected with indicated plasmids. After 48 h, cells were subjected to immunoprecipitation with anti-GFP and anti-HA. Immunoblotting was performed with indicated antibodies. Data are representative of three independent experiments. (D) Immunoprecipitation assays. 293T cells were co-transfected with indicated plasmids. After 48 h, cells were treated with MG132 (5 μM) for 6 h and then subjected to immunoprecipitation with anti-HA. Immunoblotting was performed with indicated antibodies. Data are representative of three independent experiments. (E) Immunoblot analysis. 293T cells stably co-expressing FLAG-HA-SQSTM1 wild-type (WT) or its mutation (C105/113A) with TRIM44 (TRIM44[OE]) or without TRIM44 (TRIM44[OE-CON) were treated with As[III] (5 μM, 6 h). Total cell lysates and nuclear fractions were prepared and analyzed by immunoblotting for indicated antibodies.
Figure 7 TRIM44 regulates the SQSTM1‐KEAP1‐NFE2L2 system. (A) U266 TRIM44[OE-CON], TRIM44[OE], TRIM44[KD-CON] and TRIM44[KD] cells were treated with or without As[III] (5 μM, 6 h). Nuclear fractions and cytoplasmic fractions were prepared and then subjected to immunoblot analysis with indicated antibodies. Relative levels of NFE2L2 in nuclear and KEAP1 in cytoplasm were quantified. (B) Quantitation of messenger RNA (mRNA) levels of NFE2L2 targets in U266 stable cells. Cells were challenged with or without As[III] (5 μM, 24 h) and then subjected to qRT-PCR analysis with indicated genes. The experiments were performed three times. Data are mean ± SD. Statistical analysis was carried out using Student’s t test, with *P < 0.05, **P < 0.01 and ***P < 0.001. (C) Immunoprecipitation assays. 293T (TRIM44[OE-CON], TRIM44[OE], TRIM44[KDCON], and TRIM44[KD]) cells were tri-transfected with indicated plasmids. After 48 h, cells were subjected to immunoprecipitation with anti-GFP and anti-HA. Immunoblotting was performed with indicated antibodies. Data are representative of three independent experiments. (D) Immunoprecipitation assays. 293T cells were co-transfected with indicated plasmids. After 48 h, cells were treated with MG132 (5 μM) for 6 h and then subjected to immunoprecipitation with anti-HA. Immunoblotting was performed with indicated antibodies. Data are representative of three independent experiments. (E) Immunoblot analysis. 293T cells stably co-expressing FLAG-HA-SQSTM1 wild-type (WT) or its mutation (C105/113A) with TRIM44 (TRIM44[OE]) or without TRIM44 (TRIM44[OE-CON) were treated with As[III] (5 μM, 6 h). Total cell lysates and nuclear fractions were prepared and analyzed by immunoblotting for indicated antibodies.CC BY-NC-ND · PubMed Central

Verification

Claims the paper makes

The claims and statistics of this paper haven’t been checked yet.

Run the check — free, no account needed. It reads the open-access text and checks the sources it cites.

A few free checks a day · papers already verified open instantly · results are public

Claims other papers make about this one

Each is checked against this paper’s own text: does it say what the citing paper says it does?

Self-check

Percentages, sums and reported differences re-computed from the paper’s own numbers.

The self-check needs the paper’s full text.

Citations

Cites

Research works printed but not linked: 43

  1. Cui, H., Kong, Y. & Zhang, H. Oxidative stress, mitochondrial dysfunction, and aging. J. Signal Transduct. 2012, 646354 (2012). · DOI
  2. Finkel, T. & Holbrook, N. J. Oxidants, oxidative stress and the biology of ageing. Nature 408(6809), 239–247 (2000). · DOI · Paper page
  3. Hayes, J. D., Dinkova-Kostova, A. T. & Tew, K. D. Oxidative stress in cancer. Cancer Cell 38(2), 167–197 (2020). · DOI · Paper page
  4. Lin, M. T. & Beal, M. F. Mitochondrial dysfunction and oxidative stress in neurodegenerative diseases. Nature 443(7113), 787–795 (2006). · DOI · Paper page
  5. Anding, A. L. & Baehrecke, E. H. Cleaning house: Selective autophagy of organelles. Dev. Cell 41(1), 10–22 (2017). · DOI · Paper page
  6. Murrow, L. & Debnath, J. Autophagy as a stress-response and quality-control mechanism: Implications for cell injury and human disease. Annu. Rev. Pathol. 8, 105–137 (2013). · DOI
  7. Shen, Z. X. et al. Use of arsenic trioxide (As2O3) in the treatment of acute promyelocytic leukemia (APL): II. Clinical efficacy and pharmacokinetics in relapsed patients. Blood 89(9), 3354–3360 (1997). · DOI
  8. Akhtar, A. et al. Recent advances in arsenic trioxide encapsulated nanoparticles as drug delivery agents to solid cancers. J. Biomed. Res. 31(3), 177–188 (2017). · DOI
  9. Mizushima, N. et al. Autophagy fights disease through cellular self-digestion. Nature 451(7182), 1069–1075 (2008). · DOI · Paper page
  10. Bellezza, I. et al. Nrf2-Keap1 signaling in oxidative and reductive stress. Biochim. Biophys. Acta Mol. Cell Res. 1865(5), 721–733 (2018). · DOI
  11. Komatsu, M. et al. The selective autophagy substrate p62 activates the stress responsive transcription factor Nrf2 through inactivation of Keap1. Nat. Cell Biol. 12(3), 213–223 (2010). · DOI · Paper page
  12. Lau, A. et al. A noncanonical mechanism of Nrf2 activation by autophagy deficiency: Direct interaction between Keap1 and p62. Mol. Cell Biol. 30(13), 3275–3285 (2010). · DOI
  13. Watanabe, M. & Hatakeyama, S. TRIM proteins and diseases. J. Biochem. 161(2), 135–144 (2017).
  14. Allen, M. D. & Bycroft, M. The solution structure of the ZnF UBP domain of USP33/VDU1. Protein Sci. 16(9), 2072–2075 (2007). · DOI
  15. Boutou, E., Matsas, R. & Mamalaki, A. Isolation of a mouse brain cDNA expressed in developing neuroblasts and mature neurons. Mol. Brain Res. 86(1–2), 153–167 (2001). · DOI
  16. Kawaguchi, T. et al. Overexpression of TRIM44 is related to invasive potential and malignant outcomes in esophageal squamous cell carcinoma. Tumour Biol. 39(6), 1010428317700409 (2017). · DOI
  17. Liu, S. et al. Overexpression of TRIM44 is an independent marker for predicting poor prognosis in epithelial ovarian cancer. Exp. Ther. Med. 16(4), 3034–3040 (2018).
  18. Yamada, Y. et al. A novel prognostic factor TRIM44 promotes cell proliferation and migration, and inhibits apoptosis in testicular germ cell tumor. Cancer Sci. 108(1), 32–41 (2017). · DOI
  19. Zhu, X. et al. High expression of TRIM44 is associated with enhanced cell proliferation, migration, invasion, and resistance to doxorubicin in hepatocellular carcinoma. Tumour Biol. 37(11), 14615–14628 (2016). · DOI
  20. Lyu, L., Chen, Z. & McCarty, N. TRIM44 links the UPS to SQSTM1/p62-dependent aggrephagy and removing misfolded proteins. Autophagy 18(4), 783–798 (2022). · DOI
  21. Levy, J. M. M., Towers, C. G. & Thorburn, A. Targeting autophagy in cancer. Nat. Rev. Cancer 17(9), 528–542 (2017). · DOI · Paper page
  22. Lyu, L., Lin, T. C. & McCarty, N. TRIM44 mediated p62 deubiquitination enhances DNA damage repair by increasing nuclear FLNA and 53BP1 expression. Oncogene 40(32), 5116–5130 (2021). · DOI
  23. Chen, Z. et al. TRIM44 promotes quiescent multiple myeloma cell occupancy and survival in the osteoblastic niche via HIF-1α stabilization. Leukemia 33(2), 469–486 (2019). · DOI
  24. Yang, B. et al. Novel function of Trim44 promotes an antiviral response by stabilizing VISA. J. Immunol. 190(7), 3613–3619 (2013). · DOI
  25. Bjørkøy, G. et al. p62/SQSTM1 forms protein aggregates degraded by autophagy and has a protective effect on huntingtin-induced cell death. J. Cell Biol. 171(4), 603–614 (2005). · DOI · Paper page
  26. Jakobi, A. J. et al. Structural basis of p62/SQSTM1 helical filaments and their role in cellular cargo uptake. Nat. Commun. 11(1), 440 (2020). · DOI
  27. Pan, J. A. et al. TRIM21 ubiquitylates SQSTM1/p62 and suppresses protein sequestration to regulate redox homeostasis. Mol. Cell 61(5), 720–733 (2016). · DOI
  28. Ciuffa, R. et al. The selective autophagy receptor p62 forms a flexible filamentous helical scaffold. Cell Rep. 11(5), 748–758 (2015). · DOI
  29. Carroll, B. et al. Oxidation of SQSTM1/p62 mediates the link between redox state and protein homeostasis. Nat. Commun. 9(1), 256 (2018). · DOI
  30. Li, N. et al. Mitochondrial complex I inhibitor rotenone induces apoptosis through enhancing mitochondrial reactive oxygen species production. J. Biol. Chem. 278(10), 8516–8525 (2003). · DOI
  31. Ichimura, Y. et al. Phosphorylation of p62 activates the Keap1-Nrf2 pathway during selective autophagy. Mol. Cell 51(5), 618–631 (2013). · DOI
  32. Lim, J. et al. Proteotoxic stress induces phosphorylation of p62/SQSTM1 by ULK1 to regulate selective autophagic clearance of protein aggregates. PLoS Genet. 11(2), e1004987 (2015). · DOI
  33. Matsumoto, G. et al. Serine 403 phosphorylation of p62/SQSTM1 regulates selective autophagic clearance of ubiquitinated proteins. Mol. Cell 44(2), 279–289 (2011). · DOI
  34. Katsuragi, Y., Ichimura, Y. & Komatsu, M. p62/SQSTM1 functions as a signaling hub and an autophagy adaptor. FEBS J. 282(24), 4672–4678 (2015). · DOI
  35. Taguchi, K. et al. Keap1 degradation by autophagy for the maintenance of redox homeostasis. Proc. Natl. Acad. Sci. U. S. A. 109(34), 13561–13566 (2012). · DOI · Paper page
  36. Ichimura, Y. & Komatsu, M. Activation of p62/SQSTM1-Keap1-nuclear factor erythroid 2-related factor 2 pathway in cancer. Front. Oncol. 8, 210 (2018). · DOI
  37. Kao, S. H. et al. Analysis of protein stability by the cycloheximide chase assay. Bio Protoc. https://doi.org/10.21769/BioProtoc.1374 (2015). · DOI
  38. Janasik, B. et al. Effect of arsenic exposure on NRF2-KEAP1 pathway and epigenetic modification. Biol. Trace Elem. Res. 185(1), 11–19 (2018). · DOI
  39. Baird, L. & Yamamoto, M. The molecular mechanisms regulating the KEAP1-NRF2 pathway. Mol. Cell Biol. https://doi.org/10.1128/MCB.00099-20 (2020). · DOI
  40. Itakura, E. & Mizushima, N. p62 Targeting to the autophagosome formation site requires self-oligomerization but not LC3 binding. J. Cell Biol. 192(1), 17–27 (2011). · DOI
  41. Lamark, T. et al. Interaction codes within the family of mammalian Phox and Bem1p domain-containing proteins. J. Biol. Chem. 278(36), 34568–34581 (2003). · DOI
  42. Wilson, M. I. et al. PB1 domain-mediated heterodimerization in NADPH oxidase and signaling complexes of atypical protein kinase C with Par6 and p62. Mol. Cell 12(1), 39–50 (2003). · DOI
  43. Ikeda, R. et al. Phosphorylation of phase-separated p62 bodies by ULK1 activates a redox-independent stress response. EMBO J. 42(14), e113349 (2023). · DOI

Cited by

Sorted by citations

See all 8

Metadata

Authors
Wang, Y., Lyu, L., Vu, T., & McCarty, N.
Venue
Scientific Reports
Published
2024-08-16
Volume
14
Issue
1
ISSN
2045-2322
Cited by
8
References
2
Language
en
Funders
National Institute of Health, United States (CA181319)

About these checks

Registry, retraction, Cites and statistics results are computed, not judged, with one exception: a printed reference that no index lists is read once by a model before it counts as a citation error. Claims are extracted by a model and kept only when their quote appears verbatim in the text; each cited source is then checked, with a model’s help, for whether it says what the claim relies on. Those verdicts can be wrong — read the claim’s quote and the cited source before relying on one.

Statistics and arithmetic are recomputed, not judged.

Confidence bands are shown only for fields calibrated on our annotated test set. None is calibrated yet, so no band is shown.

What counts as a claim ›How we measure confidence ›How we check this ›

Are you an author, or do you see a problem with this page? Request a review