

A computer vision system for deep learning-based detection of patient mobilization activities in the ICU
Open accessThe DOI matches its Crossref record; 33 of the 33 references it cites were found in a registry or an index.
Abstract
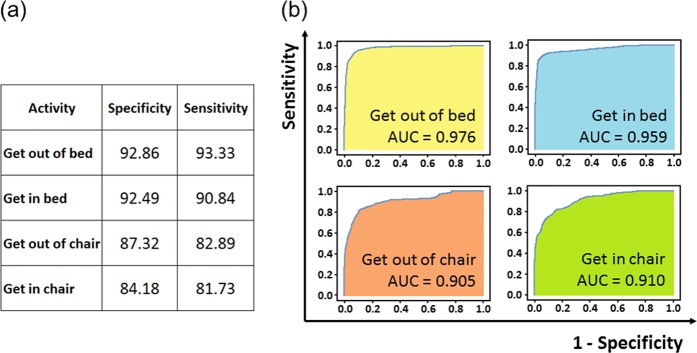
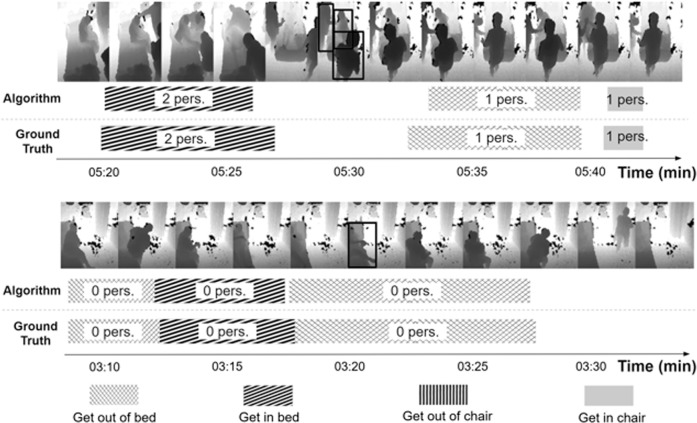
Early and frequent patient mobilization substantially mitigates risk for post-intensive care syndrome and long-term functional impairment. We developed and tested computer vision algorithms to detect patient mobilization activities occurring in an adult ICU. Mobility activities were defined as moving the patient into and out of bed, and moving the patient into and out of a chair. A data set of privacy-safe-depth-video images was collected in the Intermountain LDS Hospital ICU, comprising 563 instances of mobility activities and 98,801 total frames of video data from seven wall-mounted depth sensors. In all, 67% of the mobility activity instances were used to train algorithms to detect mobility activity occurrence and duration, and the number of healthcare personnel involved in each activity. The remaining 33% of the mobility instances were used for algorithm evaluation. The algorithm for detecting mobility activities attained a mean specificity of 89.2% and sensitivity of 87.2% over the four activities; the algorithm for quantifying the number of personnel involved attained a mean accuracy of 68.8%.
Overview
The claims and statistics of this paper haven’t been checked yet.
Free: it reads the open-access text and checks the first 5 claims that cite a source we can check. Create a free account to check every claim.
Integrity signals
Registry
Cites
Statistics
Figures

Verification
Claims the paper makes
The claims and statistics of this paper haven’t been checked yet.
Free: it reads the open-access text and checks the first 5 claims that cite a source we can check. Create a free account to check every claim.
Claims other papers make about this one
Each is checked against this paper’s own text: does it say what the citing paper says it does?
The cited source says what the claim attributes to it.
In the citing paper
“Using large datasets, CV models can acquire many pattern-recognition abilities-from physician-level diagnostics 7 to medical scene perception 8 .”
From Deep learning-enabled medical computer vision (2021) · cites this paper as [8]
In the citing paper
“In hospitals, for example, early works have demonstrated CV-based ambient intelligence in intensive care units to monitor for safety-critical behaviors such as hand hygiene activity 32 and patient mobilization 8,129,130 .”
From Deep learning-enabled medical computer vision (2021) · cites this paper as [8]
Self-check
Percentages, sums and reported differences re-computed from the paper’s own numbers.
The self-check needs the paper’s full text.
Citations
Cites
Deep Residual Learning for Image Recognition
He, K., Zhang, X., Ren, S., & Sun, J. (2016) · 2016 IEEE Conference on Computer Vision and Pattern Recognition (CVPR) · doi:10.1109/cvpr.2016.90 · Cited by 235,474 · cited 1×
“29 We used an 18-layer ResNet convolutional neural network 30 pre-trained on the large-scale ImageNet 31 and fi ne-tuned on our data set to initially extract informative visual features from every frame of data.”
MethodImageNet Large Scale Visual Recognition Challenge
Russakovsky, O., Deng, J., Su, H., Krause, J., Satheesh, S., Ma, S., Huang, Z., Karpathy, A., Khosla, A., Bernstein, M., et al. (2015) · International Journal of Computer Vision · doi:10.1007/s11263-015-0816-y · Cited by 39,380
Self-citationYOLO9000: Better, Faster, Stronger
Redmon, J., & Farhadi, A. (2017) · 2017 IEEE Conference on Computer Vision and Pattern Recognition (CVPR) · doi:10.1109/cvpr.2017.690 · Cited by 19,892 · cited 2×
“The YOLOv2 convolutional neural network was trained to predict the spatial locations of people in each image frame of data using annotated bounding boxes of the spatial locations of people in 1379 frames of patient data.”
MethodMeasuring nominal scale agreement among many raters.
Fleiss, J. L. (1971) · Psychological Bulletin · doi:10.1037/h0031619 · Cited by 8,733
Schweickert, W. D., Pohlman, M. C., Pohlman, A. S., Nigos, C., Pawlik, A. J., Esbrook, C. L., Spears, L., Miller, M., Franczyk, M., Deprizio, D., et al. (2009) · The Lancet · doi:10.1016/s0140-6736(09)60658-9 · Cited by 3,339
Needham, D. M., Davidson, J., Cohen, H., Hopkins, R. O., Weinert, C., Wunsch, H., Zawistowski, C., Bemis-Dougherty, A., Berney, S. C., Bienvenu, O. J., et al. (2012) · Critical Care Medicine · doi:10.1097/ccm.0b013e318232da75 · Cited by 2,639
Long-term cognitive impairment and functional disability among survivors of severe sepsis.
Iwashyna, T. J., Ely, E. W., Smith, D. M., & Langa, K. M. (2010) · JAMA · doi:10.1001/jama.2010.1553 · Cited by 2,582
One-Year Outcomes in Survivors of the Acute Respiratory Distress Syndrome
Herridge, M. S., Cheung, A. M., Tansey, C. M., Matte-Martyn, A., Diaz-Granados, N., Al-Saidi, F., Cooper, A. B., Guest, C. B., Mazer, C. D., Mehta, S., et al. (2003) · New England Journal of Medicine · doi:10.1056/nejmoa022450 · Cited by 2,334
Early exercise in critically ill patients enhances short-term functional recovery*
Burtin, C., Clerckx, B., Robbeets, C., Ferdinande, P., Langer, D., Troosters, T., Hermans, G., Decramer, M., & Gosselink, R. (2009) · Critical Care Medicine · doi:10.1097/ccm.0b013e3181a38937 · Cited by 1,032
How to solve the cost crisis in health care.
Kaplan, R. S., & Porter, M. E. (2011) · PubMed · Cited by 772
Cited by
Deep learning-enabled medical computer vision
Esteva, A., Chou, K., Yeung, S., Naik, N., Madani, A., Mottaghi, A., Liu, Y., Topol, E., Dean, J., & Socher, R. (2021) · npj Digital Medicine · doi:10.1038/s41746-020-00376-2 · Cited by 1,406
Self-citationArtificial intelligence and innovation management: A review, framework, and research agenda✰
Haefner, N., Wincent, J., Parida, V., & Gassmann, O. (2021) · Technological Forecasting and Social Change · doi:10.1016/j.techfore.2020.120392 · Cited by 1,073
“But this approach was critical in order to design an effective system (Yeung et al., 2019).”
BackgroundApplication Scenarios for Artificial Intelligence in Nursing Care: Rapid Review
Seibert, K., Domhoff, D., Bruch, D., Schulte-Althoff, M., Fürstenau, D., Biessmann, F., & Wolf-Ostermann, K. (2021) · Journal of Medical Internet Research · doi:10.2196/26522 · Cited by 314
Illuminating the dark spaces of healthcare with ambient intelligence
Haque, A., Milstein, A., & Fei-Fei, L. (2020) · Nature · doi:10.1038/s41586-020-2669-y · Cited by 274
Self-citationEthical issues in using ambient intelligence in health-care settings
Martinez-Martin, N., Luo, Z., Kaushal, A., Adeli, E., Haque, A., Kelly, S. S., Wieten, S., Cho, M. K., Magnus, D., Fei-Fei, L., et al. (2021) · The Lancet Digital Health · doi:10.1016/s2589-7500(20)30275-2 · Cited by 165
Self-citation
Metadata
- Authors
- Yeung, S., Rinaldo, F., Jopling, J., Liu, B., Mehra, R., Downing, N. L., Guo, M., Bianconi, G. M., Alahi, A., Lee, J., Campbell, B., Deru, K., Beninati, W., Fei-Fei, L., & Milstein, A.
- Affiliations
- Stanford University (US)
- Stanford Medicine (US)
- École Polytechnique Fédérale de Lausanne (CH)
- Intermountain Healthcare (US)
- Corresponding author
- Yeung, Serena
- Rinaldo, Francesca
- ORCID
- Venue
- npj Digital Medicine
- Published
- 2019-03-01
- Volume
- 2
- Issue
- 1
- Pages
- 11-11
- ISSN
- 2398-6352 (ISSN-L)
- PMC
- PMC6550251
- OpenAlex
- W2918817626
- Cited by
- 125
- References
- 33
- Citations by year
- 2026: 13 · 2025: 15 · 2024: 13 · 2023: 15 · 2022: 15 · 2021: 26 · 2020: 24 · 2019: 4
- FWCI
- 7.71
- Type
- journal article
- Language
- en
- Open access
- gold
- doi.org
- Licence
- cc-by
- creativecommons.org/licenses/by/4.0 (tdm)
- creativecommons.org/licenses/by/4.0 (vor)
- Locations
- npj Digital Medicine (publishedVersion, cc-by)
- Europe PMC (PubMed Central) (publishedVersion, cc-by)
- PubMed Central (publishedVersion, cc-by)
- PubMed (publishedVersion)
- DOAJ (DOAJ: Directory of Open Access Journals) (submittedVersion)
- Infoscience (Ecole Polytechnique Fédérale de Lausanne) (submittedVersion, cc-by-nc-nd)
- Funders
- Intermountain Healthcare
- Canada Excellence Research Chairs, Government of Canada
- Topics
- Physical Sciences › Computer Science › Computer Vision and Pattern Recognition › Context-Aware Activity Recognition Systems
- Physical Sciences › Computer Science › Computer Vision and Pattern Recognition › Human Pose and Action Recognition
- Health Sciences › Medicine › Critical Care and Intensive Care Medicine › Intensive Care Unit Cognitive Disorders
- Keywords
- patient mobilization, intensive care unit, computer vision, activity detection, depth video, bed mobility, post-intensive care syndrome, video surveillance
About these checks
Registry, retraction, Cites and statistics results are computed, not judged, with one exception: a printed reference that no index lists is read once by a model before it counts as a citation error. Claims are extracted by a model and kept only when their quote appears verbatim in the text; each cited source is then checked, with a model’s help, for whether it says what the claim relies on. Those verdicts can be wrong — read the claim’s quote and the cited source before relying on one.
Statistics and arithmetic are recomputed, not judged.
Confidence bands are shown only for fields calibrated on our annotated test set. None is calibrated yet, so no band is shown.
What counts as a claim ›How we measure confidence ›How we check this ›
Are you an author, or do you see a problem with this page? Request a review
How to cite
Cite CoChat for the checks on this page, and the paper for its own findings.
- This page
- CoChat. (2026). Citation check: A computer vision system for deep learning-based detection of patient mobilization activities in the ICU. https://app.cochat.ai/papers/10.1038/s41746-019-0087-z
- The paper
- Yeung, S., Rinaldo, F., Jopling, J., Liu, B., Mehra, R., Downing, N. L., Guo, M., Bianconi, G. M., Alahi, A., Lee, J., Campbell, B., Deru, K., Beninati, W., Fei-Fei, L., & Milstein, A. (2019). A computer vision system for deep learning-based detection of patient mobilization activities in the ICU. npj Digital Medicine. https://doi.org/10.1038/s41746-019-0087-z
Data sources
Bibliographic data: Semantic Scholar, OpenAlex, Crossref.
Contains information from the Semantic Scholar Academic Graph Datasets, made available under the ODC Attribution License (ODC-BY 1.0).
Semantic Scholar’s data is described in: Kinney, R., et al. (2023). The Semantic Scholar Open Data Platform. arXiv:2301.10140.
