

The DOI matches its Crossref record; 42 of the 42 references it cites were found in a registry or an index.
Deep learning algorithm predicts diabetic retinopathy progression in individual patients
Open accessAbstract
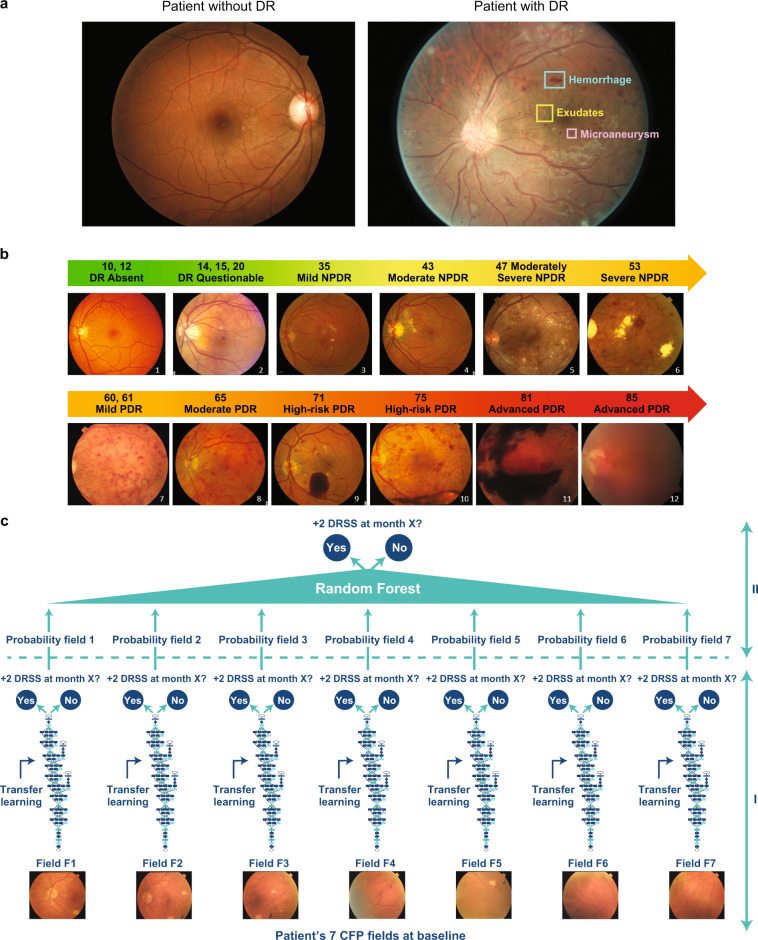
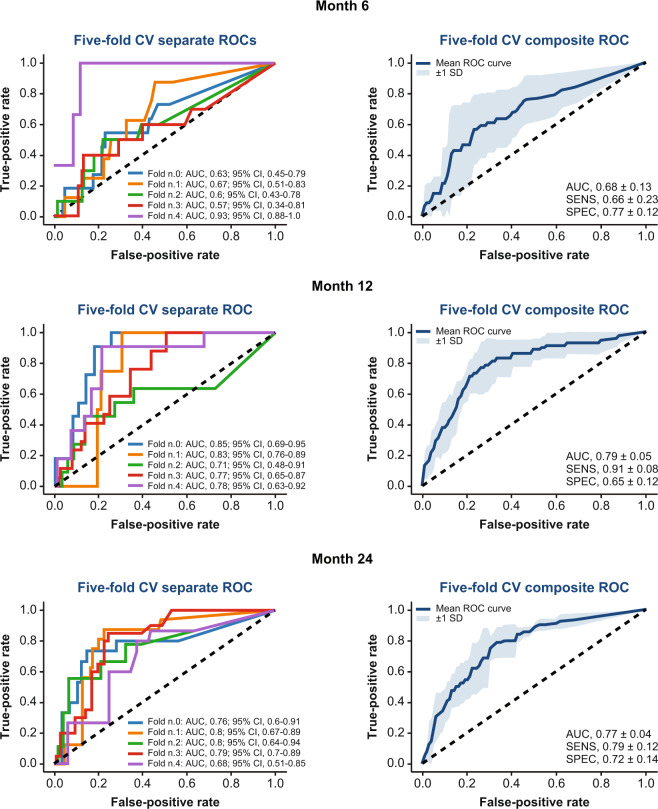
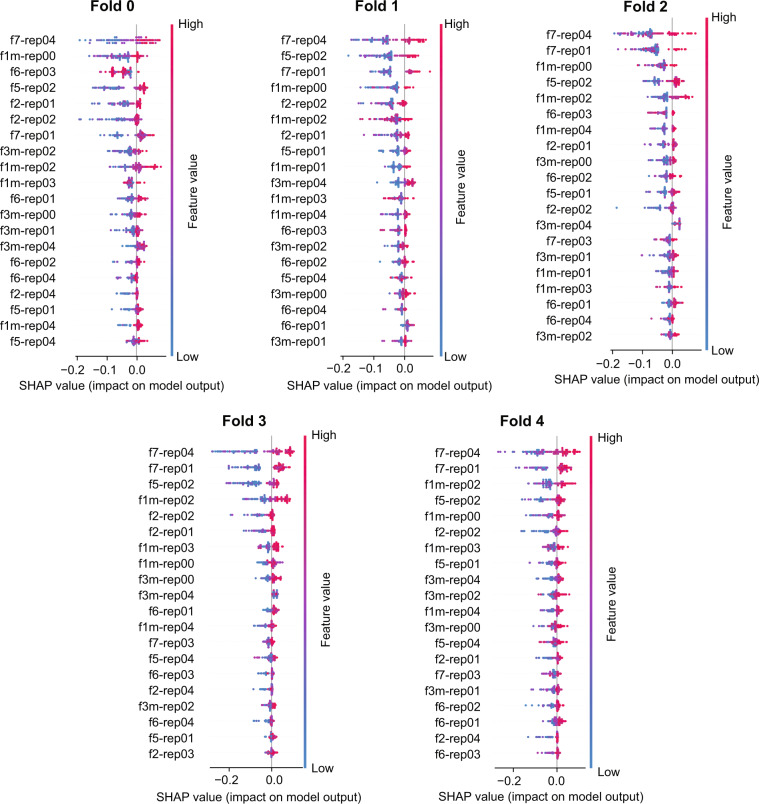
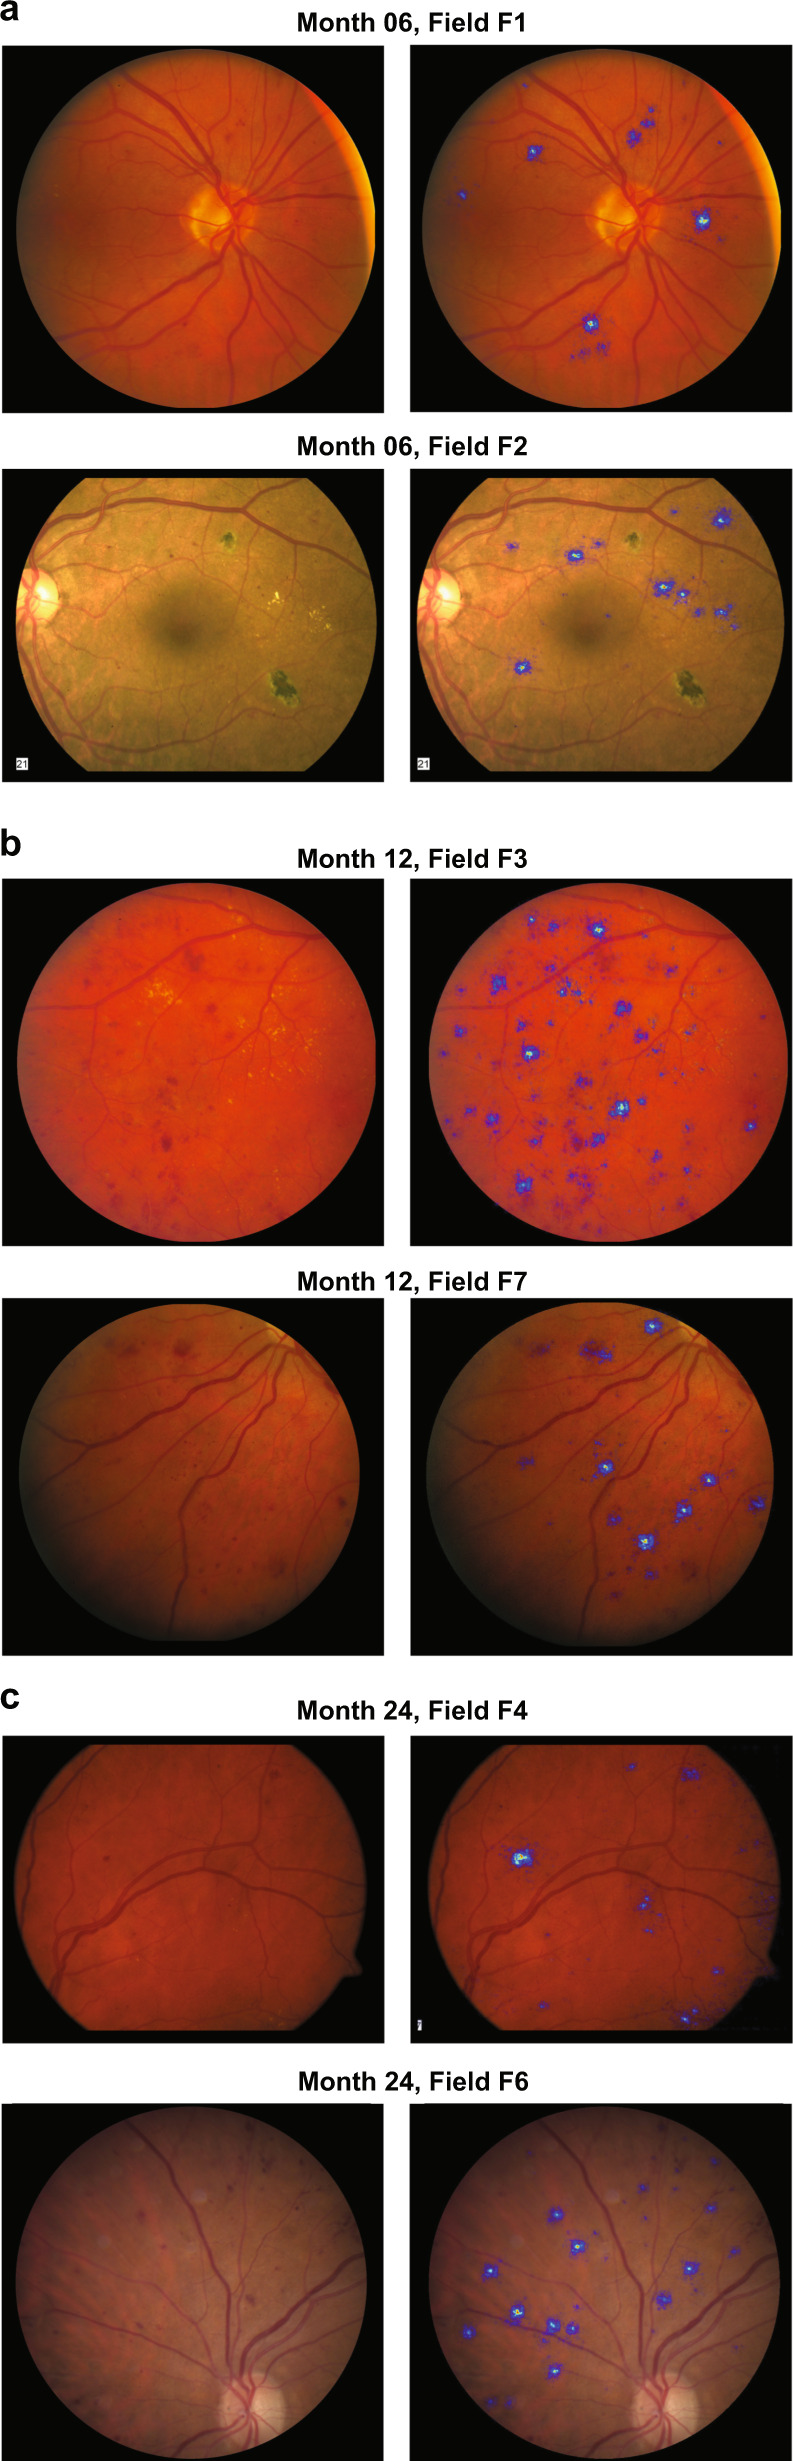
The global burden of diabetic retinopathy (DR) continues to worsen and DR remains a leading cause of vision loss worldwide. Here, we describe an algorithm to predict DR progression by means of deep learning (DL), using as input color fundus photographs (CFPs) acquired at a single visit from a patient with DR. The proposed DL models were designed to predict future DR progression, defined as 2-step worsening on the Early Treatment Diabetic Retinopathy Diabetic Retinopathy Severity Scale, and were trained against DR severity scores assessed after 6, 12, and 24 months from the baseline visit by masked, well-trained, human reading center graders. The performance of one of these models (prediction at month 12) resulted in an area under the curve equal to 0.79. Interestingly, our results highlight the importance of the predictive signal located in the peripheral retinal fields, not routinely collected for DR assessments, and the importance of microvascular abnormalities. Our findings show the feasibility of predicting future DR progression by leveraging CFPs of a patient acquired at a single visit. Upon further development on larger and more diverse datasets, such an algorithm could enable early diagnosis and referral to a retina specialist for more frequent monitoring and even consideration of early intervention. Moreover, it could also improve patient recruitment for clinical trials targeting DR.
Overview
The claims and statistics of this paper haven’t been checked yet.
Free: it reads the open-access text and checks the first 5 claims that cite a source we can check. Create a free account to check every claim.
Integrity signals
Registry
Cites
Statistics
Figures
Verification
Claims the paper makes
The claims and statistics of this paper haven’t been checked yet.
Free: it reads the open-access text and checks the first 5 claims that cite a source we can check. Create a free account to check every claim.
Claims other papers make about this one
Each is checked against this paper’s own text: does it say what the citing paper says it does?
The source backs part of the claim, not all of it — or backs it for a different population, condition or comparison.
In the citing paper
“when heat maps were used to identify novel features of diabetic retinopathy progression in ophthalmological fundal eye examination43”
From The false hope of current approaches to explainable artificial intelligence in health care (2021) · cites this paper as [43]
Experimental — accuracy not yet measuredThe source backs part of the claim, not all of it — or backs it for a different population, condition or comparison.
In the citing paper
“Recently, retinal images were used to predict the incidence and progression of chronic kidney disease (CKD)39 and diabetic retinopathy (DR).101,102”
From Artificial intelligence in diabetes management: Advancements, opportunities, and challenges (2023) · cites this paper as [101]
Experimental — accuracy not yet measuredThe cited source says what the claim attributes to it.
In the citing paper
“the performance of one of these models (prediction at month 12) resulted in an AUC equal to 0.79”
From Artificial intelligence in diabetes management: Advancements, opportunities, and challenges (2023) · cites this paper as Arcadu et al.101
Self-check
Percentages, sums and reported differences re-computed from the paper’s own numbers.
The self-check needs the paper’s full text.
Citations
Cites
Breiman, L. (2001) · Machine Learning · doi:10.1023/a:1010933404324 · Cited by 133,538
ImageNet classification with deep convolutional neural networks
Krizhevsky, A., Sutskever, I., & Hinton, G. E. (2017) · Communications of the ACM · doi:10.1145/3065386 · Cited by 112,155
ImageNet: A large-scale hierarchical image database
Deng, J., Dong, W., Socher, R., Li, L.-J., Li, K., & Fei-Fei, L. (2009) · 2009 IEEE Conference on Computer Vision and Pattern Recognition · doi:10.1109/cvpr.2009.5206848 · Cited by 65,333
Rethinking the Inception Architecture for Computer Vision
Szegedy, C., Vanhoucke, V., Ioffe, S., Shlens, J., & Wojna, Z. (2016) · 2016 IEEE Conference on Computer Vision and Pattern Recognition (CVPR) · doi:10.1109/cvpr.2016.308 · Cited by 32,138
A Unified Approach to Interpreting Model Predictions
Lundberg, S., & Lee, S.-I. (2017) · arXiv · doi:10.48550/arxiv.1705.07874 · Cited by 23,707
Classification and Regression Trees.
Gordon, A. D., Breiman, L., Friedman, J. H., Olshen, R. A., & Stone, C. J. (1984) · Biometrics · doi:10.2307/2530946 · Cited by 23,522
Classification and Regression Trees.
Ryzin, J. V., Breiman, L., Friedman, J. H., Olshen, R. A., & Stone, C. J. (1986) · Journal of the American Statistical Association · doi:10.2307/2288003 · Cited by 20,825
A survey on deep learning in medical image analysis
Litjens, G., Kooi, T., Bejnordi, B. E., Setio, A. A. A., Ciompi, F., Ghafoorian, M., van der Laak, J. A. W. M., van Ginneken, B., & Sánchez, C. I. (2017) · Medical Image Analysis · doi:10.1016/j.media.2017.07.005 · Cited by 15,332
Dermatologist-level classification of skin cancer with deep neural networks
Esteva, A., Kuprel, B., Novoa, R. A., Ko, J., Swetter, S. M., Blau, H. M., & Thrun, S. (2017) · Nature · doi:10.1038/nature21056 · Cited by 14,362
International Diabetes Federation 2017
Carracher, A. M., Marathe, P. H., & Close, K. L. (2018) · Journal of Diabetes · doi:10.1111/1753-0407.12644 · Cited by 13,418
Research works printed but not linked: 4
- Zeiler M.D., Fergus R. in Computer Vision – ECCV 2014. ECCV 2014. Lecture Notes in Computer Science, vol 8689 (eds Fleet, D. et al.) (Springer, Cham, 2014).
- Brown, D. M. et al. Long-term outcomes of ranibizumab therapy for diabetic macular edema: the 36-month results from two phase III trials: RISE and RIDE. Ophthalmology 120, 2013–2022 (2013). · DOI · Paper page
- Springenberg, J. T., Dosovitskiy, A., Brox, T. & Riedmiller, M. Striving for simplicity: the all convolutional net. https://arxiv.org/abs/1412.6806 (2015). · arXiv
- Simonyan, K., Vedaldi, A. & Zisserman, A. Deep inside convolutional networks: visualising image classification models and saliency maps. https://arxiv.org/abs/1312.6034 (2014). · arXiv
Cited by
Rajpurkar, P., Chen, E., Banerjee, O., & Topol, E. J. (2022) · Nature Medicine · doi:10.1038/s41591-021-01614-0 · Cited by 3,212
The false hope of current approaches to explainable artificial intelligence in health care
Ghassemi, M., Oakden-Rayner, L., & Beam, A. L. (2021) · The Lancet Digital Health · doi:10.1016/s2589-7500(21)00208-9 · Cited by 1,724
A Unifying Review of Deep and Shallow Anomaly Detection
Ruff, L., Kauffmann, J. R., Vandermeulen, R. A., Montavon, G., Samek, W., Kloft, M., Dietterich, T. G., & Muller, K.-R. (2021) · Proceedings of the IEEE · doi:10.1109/jproc.2021.3052449 · Cited by 914
Rajula, H. S. R., Verlato, G., Manchia, M., Antonucci, N., & Fanos, V. (2020) · Medicina · doi:10.3390/medicina56090455 · Cited by 606
Sources of bias in artificial intelligence that perpetuate healthcare disparities—A global review
Celi, L. A., Cellini, J., Charpignon, M.-L., Dee, E. C., Dernoncourt, F., Eber, R., Mitchell, W. G., Moukheiber, L., Schirmer, J., Situ, J., et al. (2022) · PLOS Digital Health · doi:10.1371/journal.pdig.0000022 · Cited by 576
Metadata
- Authors
- Arcadu, F., Benmansour, F., Maunz, A., Willis, J., Haskova, Z., & Prunotto, M.
- Affiliations
- F. Hoffmann-La Roche AG (CH)
- University of Geneva (CH)
- Corresponding author
- Prunotto, Marco
- Venue
- npj Digital Medicine
- Published
- 2019-09-20
- Volume
- 2
- Issue
- 1
- Pages
- 92-92
- ISSN
- 2398-6352 (ISSN-L)
- PMC
- PMC6754451
- OpenAlex
- W2974726644
- Cited by
- 305
- References
- 42
- Citations by year
- 2026: 20 · 2025: 32 · 2024: 58 · 2023: 33 · 2022: 55 · 2021: 53 · 2020: 50 · 2019: 3
- FWCI
- 26.39
- Type
- journal article
- Language
- en
- Update notices
- correction (2020-12-08)
- Open access
- gold
- doi.org
- Licence
- cc-by
- creativecommons.org/licenses/by/4.0 (tdm)
- creativecommons.org/licenses/by/4.0 (vor)
- Locations
- npj Digital Medicine (publishedVersion, cc-by)
- PubMed Central (publishedVersion, cc-by)
- PubMed (publishedVersion)
- DOAJ (DOAJ: Directory of Open Access Journals) (submittedVersion)
- Funders
- Genentech
- Topics
- Health Sciences › Medicine › Radiology, Nuclear Medicine and Imaging › Retinal Imaging and Analysis
- Health Sciences › Medicine › Ophthalmology › Retinal Diseases and Treatments
- Health Sciences › Medicine › Ophthalmology › Ophthalmology and Visual Health Research
- Keywords
- diabetic retinopathy, disease progression prediction, deep learning, color fundus images, microvascular abnormalities, retinal imaging
About these checks
Registry, retraction, Cites and statistics results are computed, not judged, with one exception: a printed reference that no index lists is read once by a model before it counts as a citation error. Claims are extracted by a model and kept only when their quote appears verbatim in the text; each cited source is then checked, with a model’s help, for whether it says what the claim relies on. Those verdicts can be wrong — read the claim’s quote and the cited source before relying on one.
Statistics and arithmetic are recomputed, not judged.
Confidence bands are shown only for fields calibrated on our annotated test set. None is calibrated yet, so no band is shown.
What counts as a claim ›How we measure confidence ›How we check this ›
Are you an author, or do you see a problem with this page? Request a review
How to cite
Cite CoChat for the checks on this page, and the paper for its own findings.
- This page
- CoChat. (2026). Citation check: Deep learning algorithm predicts diabetic retinopathy progression in individual patients. https://app.cochat.ai/papers/10.1038/s41746-019-0172-3
- The paper
- Arcadu, F., Benmansour, F., Maunz, A., Willis, J., Haskova, Z., & Prunotto, M. (2019). Deep learning algorithm predicts diabetic retinopathy progression in individual patients. npj Digital Medicine. https://doi.org/10.1038/s41746-019-0172-3
Data sources
Bibliographic data: Semantic Scholar, OpenAlex, Crossref.
Contains information from the Semantic Scholar Academic Graph Datasets, made available under the ODC Attribution License (ODC-BY 1.0).
Semantic Scholar’s data is described in: Kinney, R., et al. (2023). The Semantic Scholar Open Data Platform. arXiv:2301.10140.
