

The DOI matches its Crossref record; 91 of the 93 references it cites were found in a registry or an index.
Predicting adverse outcomes due to diabetes complications with machine learning using administrative health data
Open accessAbstract
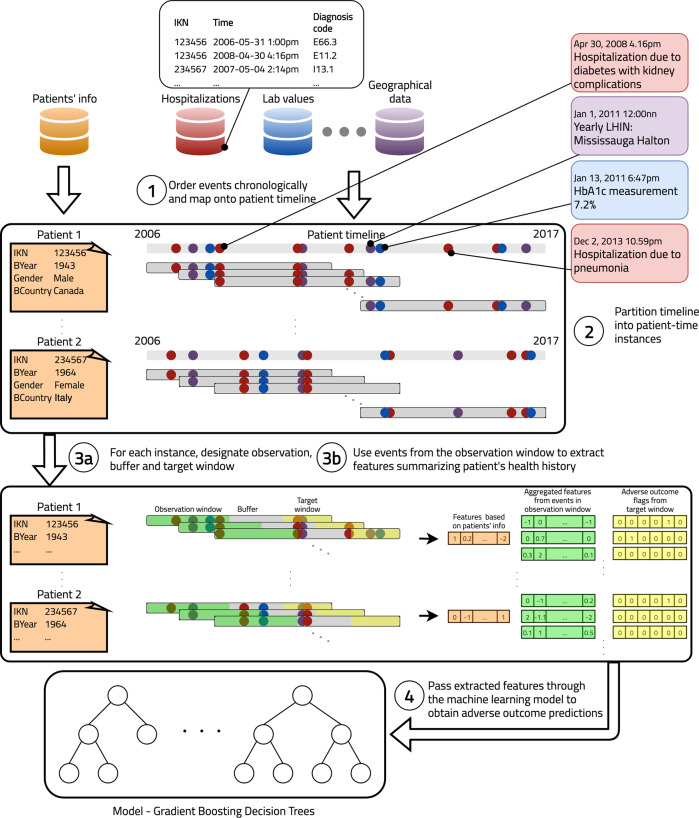
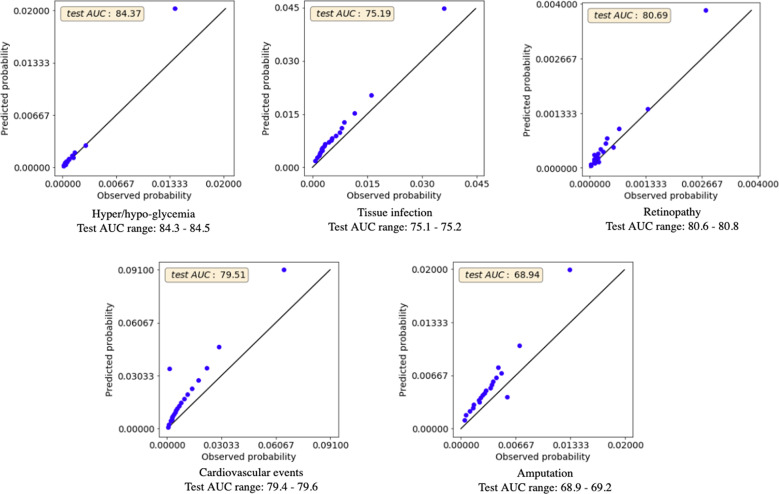
Across jurisdictions, government and health insurance providers hold a large amount of data from patient interactions with the healthcare system. We aimed to develop a machine learning-based model for predicting adverse outcomes due to diabetes complications using administrative health data from the single-payer health system in Ontario, Canada. A Gradient Boosting Decision Tree model was trained on data from 1,029,366 patients, validated on 272,864 patients, and tested on 265,406 patients. Discrimination was assessed using the AUC statistic and calibration was assessed visually using calibration plots overall and across population subgroups. Our model predicting three-year risk of adverse outcomes due to diabetes complications (hyper/hypoglycemia, tissue infection, retinopathy, cardiovascular events, amputation) included 700 features from multiple diverse data sources and had strong discrimination (average test AUC = 77.7, range 77.7–77.9). Through the design and validation of a high-performance model to predict diabetes complications adverse outcomes at the population level, we demonstrate the potential of machine learning and administrative health data to inform health planning and healthcare resource allocation for diabetes management.
Overview
The claims and statistics of this paper haven’t been checked yet.
Run the check — free, no account needed. It reads the open-access text and checks the sources it cites.
Integrity signals
Registry
Cites
Statistics
Figures
Verification
Claims the paper makes
The claims and statistics of this paper haven’t been checked yet.
Run the check — free, no account needed. It reads the open-access text and checks the sources it cites.
Claims other papers make about this one
Each is checked against this paper’s own text: does it say what the citing paper says it does?
The cited source says what the claim attributes to it.
In the citing paper
“Ravaut et al. [88] applied ML to Canadian administrative health data, achieving satisfactory performance for adverse CVD events.”
From Artificial intelligence-powered prediction of diabetic complications: from clinical data to molecular omics (2026) · cites this paper as [88]
Self-check
Percentages, sums and reported differences re-computed from the paper’s own numbers.
The self-check needs the paper’s full text.
Citations
Cites
ImageNet: A large-scale hierarchical image database
Deng, J., Dong, W., Socher, R., Li, L.-J., Li, K., & Fei-Fei, L. (2009) · 2009 IEEE Conference on Computer Vision and Pattern Recognition · doi:10.1109/cvpr.2009.5206848 · Cited by 65,333
XGBoost: A Scalable Tree Boosting System
Chen, T., & Guestrin, C. (2016) · Proceedings of the 22nd ACM SIGKDD International Conference on Knowledge Discovery and Data Mining · doi:10.1145/2939672.2939785 · Cited by 54,569
Greedy function approximation: A gradient boosting machine
Friedman, J. H. (2001) · The Annals of Statistics · doi:10.1214/aos/1013203451 · Cited by 30,731
(1993) · New England Journal of Medicine · doi:10.1056/nejm199309303291401 · Cited by 24,667
From local explanations to global understanding with explainable AI for trees
Lundberg, S. M., Erion, G., Chen, H., DeGrave, A., Prutkin, J. M., Nair, B., Katz, R., Himmelfarb, J., Bansal, N., & Lee, S.-I. (2020) · Nature Machine Intelligence · doi:10.1038/s42256-019-0138-9 · Cited by 10,551
High-performance medicine: the convergence of human and artificial intelligence
Topol, E. J. (2019) · Nature Medicine · doi:10.1038/s41591-018-0300-7 · Cited by 10,450
Measuring the Accuracy of Diagnostic Systems
Swets, J. A. (1988) · Science · doi:10.1126/science.3287615 · Cited by 10,058
The use of the area under the ROC curve in the evaluation of machine learning algorithms
Bradley, A. P. (1997) · Pattern Recognition · doi:10.1016/s0031-3203(96)00142-2 · Cited by 7,217
Global estimates of diabetes prevalence for 2013 and projections for 2035
Guariguata, L., Whiting, D. R., Hambleton, I., Beagley, J., Linnenkamp, U., & Shaw, J. E. (2014) · Diabetes Research and Clinical Practice · doi:10.1016/j.diabres.2013.11.002 · Cited by 4,642
Research works printed but not linked: 2
- Bojer, C. & Meldgaard, J. Learnings from Kaggle’s Forecasting Competitions. arXiv, https://arxiv.org/ftp/arxiv/papers/2009/2009.07701.pdf (2020).
- Vaswani, A. et al. in Advances in Neural Information Processing Systems (eds. Guyon, I. et al.) 5998–6008 (Curran Associates, Inc., 2017).
Cited by
Sorted by citations
Items 101–122 of 122
Li, B., Eisenberg, N., Beaton, D., Lee, D. S., Wijeysundera, D. N., de Mestral, C., Mamdani, M., Al-Omran, M. A., & Roche‐Nagle, G. (2024) · JVS-Vascular Insights · doi:10.1016/j.jvsvi.2024.100066
Islam, H., Bartlett, G. B., Pierce, R., Rao, P. R., Waitman, L. R., & Song, X. (2024) · medRxiv · doi:10.1101/2024.04.15.24305843
Kuluski, K., Jacobson, D., Ghazalbash, S., Baek, J., Rosella, L. C., Mansfield, E. D., Sud, A., Tang, T., Guilcher, S. J. T., & Zargoush, M. (2024) · PLoS ONE · doi:10.1371/journal.pone.0315918
Self-citationFair machine learning models for disease prediction: In-depth interviews with key health expertsPreprint
Nghiem, N., & Tiatia, R. (2025) · medRxiv · doi:10.1101/2025.02.04.25321632
Sugimoto, H., Hironaka, K., Yamada, T., Otowa‐Suematsu, N., Hirota, Y., Otake, H., Hirata, K., Sakaguchi, K., Ogawa, W., & Kuroda, S. (2025) · eLife · doi:10.7554/elife.102860.1
Machine Learning and Explainable AI for Type-2 Diabetes Management
Mazzi, C., Seghieri, C., & Molinari, R. (2025) · Springer eBooks · doi:10.1007/978-3-031-96736-8_30
Predicting the Risk of COVID-19 Among Adult Patients With Diabetes: A Machine Learning Approach
Eurich, D. T., Lau, D., Li, W., Weaver, O. R., Joon, T., Ye, M., McAlister, F. A., Kaul, P., & Samanani, S. (2025) · Canadian Journal of Diabetes · doi:10.1016/j.jcjd.2025.09.001
Investigating irisin levels in patients with diabetic nephropathy: a cross-sectional study
Khairallah, M. K., El-Shereef, H. K., Hassan, H. S., Dahpy, M. A., & Salah, A. A. (2025) · The Egyptian Journal of Internal Medicine · doi:10.1186/s43162-025-00522-w
Klempíř, O., Holá, M., Rožánek, M., Müllerová, J. G., & Tichopád, A. (2025) · medRxiv · doi:10.1101/2025.09.25.25336630
Individualized Therapy Optimization for Type 2 DiabetesPreprint
Lozhkina, A., Piazza, C., Gabr, Z., Rupp, M., Herzig, D., Bally, L., & Jaun, A. (2025) · medRxiv · doi:10.1101/2025.10.13.25337959
Multimorbidity measurement strategies for predicting hospital visits
Neves, B. D., Moreira, J. M., Gonçalves, S., Cerejo, J., Mota, I., Silva, N. A., Leite, F., & Silva, M. J. (2025) · BMC Health Services Research · doi:10.1186/s12913-025-13817-z
Sugimoto, H., Hironaka, K., Yamada, T., Otowa‐Suematsu, N., Hirota, Y., Otake, H., Hirata, K., Sakaguchi, K., Ogawa, W., & Kuroda, S. (2026) · eLife · doi:10.7554/elife.102860.2
Joon, T., Li, W., Lau, D., Sharma, V., Dubois, C., Hossain, T., Dubois, T. B., Ye, M., Samanani, S., & Eurich, D. T. (2026) · Informatics and Health · doi:10.1016/j.infoh.2025.11.003
Liang, Z., Qin, W., Deng, Y., Jiang, R., Zhu, L., Liang, W., Chen, C., & Shi, W. (2026) · doi:10.2196/preprints.96191
Liang, Z., Qin, W., Deng, Y., Jiang, R., Zhu, L., Liang, W., Chen, C., & Shi, W. (2026) · doi:10.2196/preprints.98063
Wang, Y., Wang, C., & Wang, J. (2026) · Frontiers in Endocrinology · doi:10.3389/fendo.2026.1888466
A Data-Centric Machine Learning Framework for Predicting Health Insurance Expenditure
Solmon, P., Saivarma, T., Sai, D. R., & Devika, O. (2026) · International Conference on Sustainable Computing and Smart Systems (ICSCSS) · doi:10.1109/icscss69635.2026.11646147
Anticipating health and care trajectories from routinely collected social care records
Gu, X., Nourse, R. A., Lü, L., Smout, E., Fuller, K., Havord, F., Baran, V., Briggs, A., Clifton, L., Farmer, A., et al. (2026) · npj Health Systems · doi:10.1038/s44401-026-00139-3
Yusufoğlu, B., & SIRMAOĞLU, E. (2026) · Brazilian Archives of Biology and Technology · doi:10.1590/1678-4324-2026260247
Aleman-Gonzales, L., Choque‐Quispe, B. M., Mamani-Zapana, W. H., Mendoza-Mollocondo, C.-I., Bernedo, E. G. M., Mamani, E. W. C., & Paredes-Quispe, J. R. (2026) · Journal Of Advanced Pharmacy Education And Research · doi:10.51847/oam3w008h7
Katharakis, G., Rikos, N., Rovithis, M., Papageorgiou, D., & Stavropoulou, A. (2026) · Healthcare · doi:10.3390/healthcare14182887
Lozhkina, A., Piazza, C., Gabr, Z., Rupp, M., Herzig, D., Bally, L., & Jaun, A. (2026) · JMIR Formative Research · doi:10.2196/92877
Metadata
- Authors
- Ravaut, M., Sadeghi, H., Leung, K. K., Volkovs, M., Kornas, K., Harish, V., Watson, T., Lewis, G. F., Weisman, A., Poutanen, T., & Rosella, L.
- Affiliations
- University of Toronto (CA)
- Mount Sinai Hospital (CA)
- Corresponding author
- Rosella, Laura
- ORCID
- Venue
- npj Digital Medicine
- Published
- 2021-02-12
- Volume
- 4
- Issue
- 1
- Pages
- 24-24
- ISSN
- 2398-6352 (ISSN-L)
- PMC
- PMC7881135
- OpenAlex
- W3127218785
- Cited by
- 121
- References
- 93
- Citations by year
- 2026: 20 · 2025: 30 · 2024: 18 · 2023: 28 · 2022: 18 · 2021: 7
- FWCI
- 6.27
- Type
- journal article
- Language
- en
- Open access
- gold
- doi.org
- Locations
- npj Digital Medicine (publishedVersion, cc-by)
- PubMed Central (publishedVersion, cc-by)
- PubMed (publishedVersion)
- DOAJ (DOAJ: Directory of Open Access Journals) (submittedVersion, cc-by-sa)
- Funders
- Canada Research Chairs
- Gouvernement du Canada | Canadian Institutes of Health Research
- Topics
- Physical Sciences › Computer Science › Artificial Intelligence › Machine Learning in Healthcare
- Health Sciences › Health Professions › Health Information Management › Artificial Intelligence in Healthcare
- Health Sciences › Medicine › Endocrinology, Diabetes and Metabolism › Diabetes Management and Research
- Keywords
- diabetes complications, adverse outcome prediction, administrative health data, gradient boosting decision tree, tissue infection, diabetic retinopathy, cardiovascular events, amputation, single-payer health care, Ontario, healthcare resource allocation, health planning
About these checks
Registry, retraction, Cites and statistics results are computed, not judged, with one exception: a printed reference that no index lists is read once by a model before it counts as a citation error. Claims are extracted by a model and kept only when their quote appears verbatim in the text; each cited source is then checked, with a model’s help, for whether it says what the claim relies on. Those verdicts can be wrong — read the claim’s quote and the cited source before relying on one.
Statistics and arithmetic are recomputed, not judged.
Confidence bands are shown only for fields calibrated on our annotated test set. None is calibrated yet, so no band is shown.
What counts as a claim ›How we measure confidence ›How we check this ›
Are you an author, or do you see a problem with this page? Request a review
