

The DOI matches its Crossref record; 91 of the 93 references it cites were found in a registry or an index.
Predicting adverse outcomes due to diabetes complications with machine learning using administrative health data
Open accessAbstract
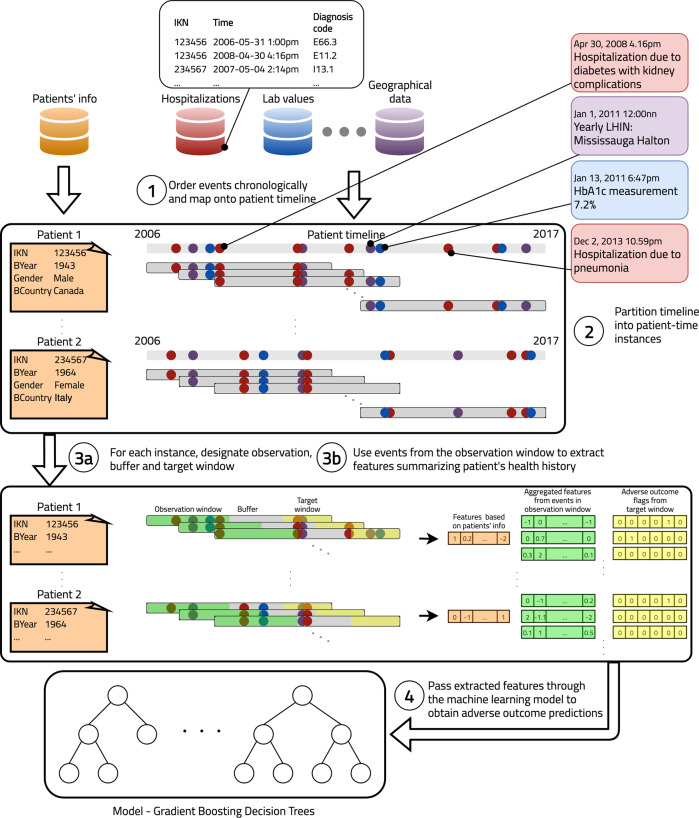
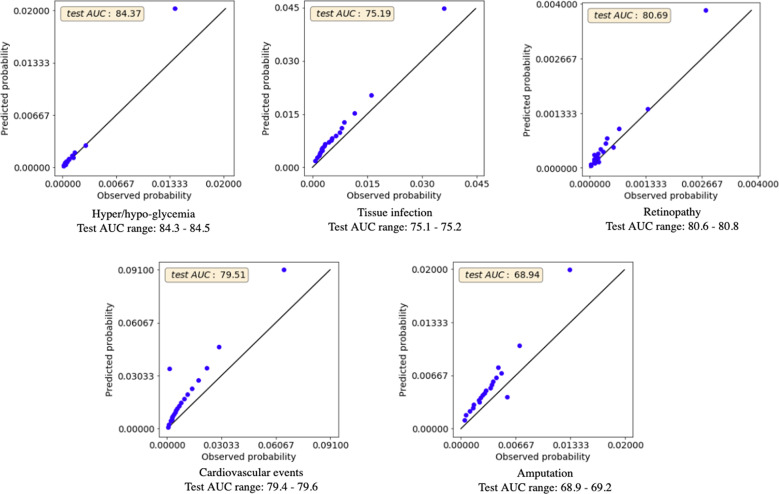
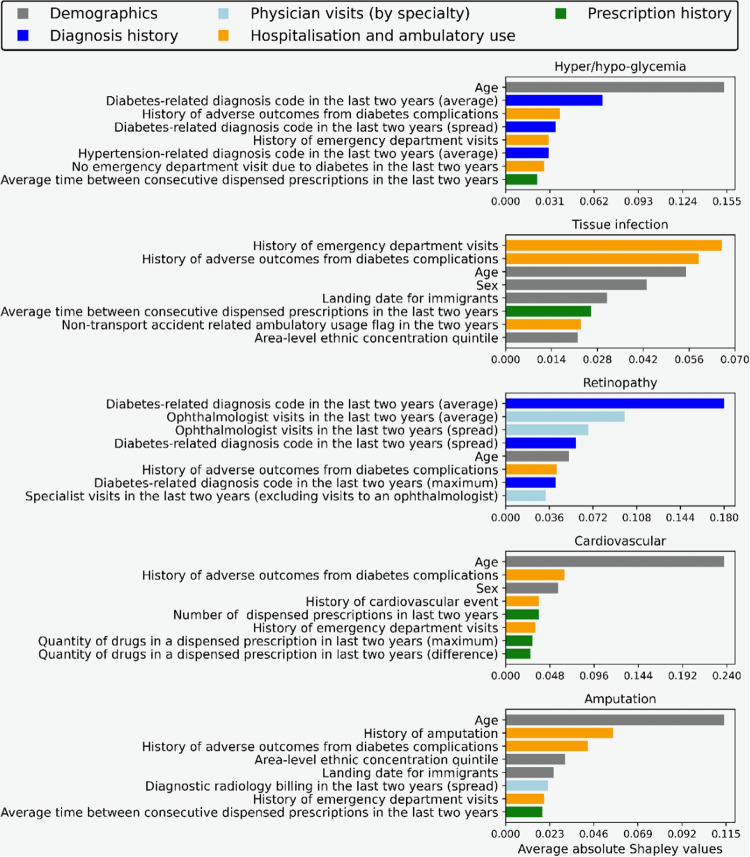
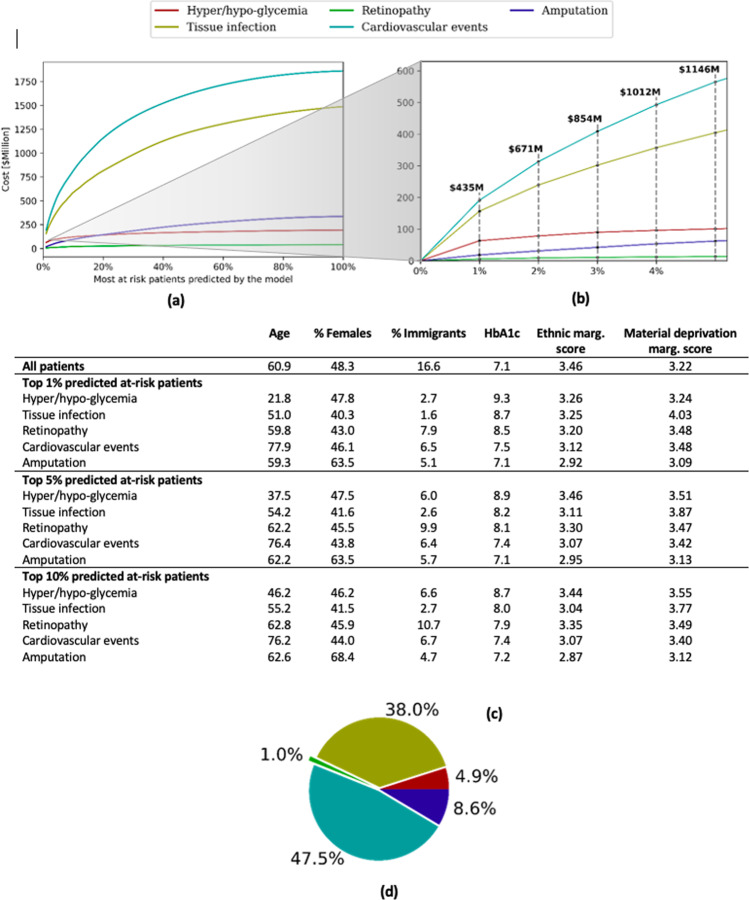
Across jurisdictions, government and health insurance providers hold a large amount of data from patient interactions with the healthcare system. We aimed to develop a machine learning-based model for predicting adverse outcomes due to diabetes complications using administrative health data from the single-payer health system in Ontario, Canada. A Gradient Boosting Decision Tree model was trained on data from 1,029,366 patients, validated on 272,864 patients, and tested on 265,406 patients. Discrimination was assessed using the AUC statistic and calibration was assessed visually using calibration plots overall and across population subgroups. Our model predicting three-year risk of adverse outcomes due to diabetes complications (hyper/hypoglycemia, tissue infection, retinopathy, cardiovascular events, amputation) included 700 features from multiple diverse data sources and had strong discrimination (average test AUC = 77.7, range 77.7–77.9). Through the design and validation of a high-performance model to predict diabetes complications adverse outcomes at the population level, we demonstrate the potential of machine learning and administrative health data to inform health planning and healthcare resource allocation for diabetes management.
Overview
The claims and statistics of this paper haven’t been checked yet.
Run the check — free, no account needed. It reads the open-access text and checks the sources it cites.
Integrity signals
Registry
Cites
Statistics
Figures
Verification
Claims the paper makes
The claims and statistics of this paper haven’t been checked yet.
Run the check — free, no account needed. It reads the open-access text and checks the sources it cites.
Claims other papers make about this one
Each is checked against this paper’s own text: does it say what the citing paper says it does?
The cited source says what the claim attributes to it.
In the citing paper
“Ravaut et al. [88] applied ML to Canadian administrative health data, achieving satisfactory performance for adverse CVD events.”
From Artificial intelligence-powered prediction of diabetic complications: from clinical data to molecular omics (2026) · cites this paper as [88]
Self-check
Percentages, sums and reported differences re-computed from the paper’s own numbers.
The self-check needs the paper’s full text.
Citations
Cites
ImageNet: A large-scale hierarchical image database
Deng, J., Dong, W., Socher, R., Li, L.-J., Li, K., & Fei-Fei, L. (2009) · 2009 IEEE Conference on Computer Vision and Pattern Recognition · doi:10.1109/cvpr.2009.5206848 · Cited by 65,333
XGBoost: A Scalable Tree Boosting System
Chen, T., & Guestrin, C. (2016) · Proceedings of the 22nd ACM SIGKDD International Conference on Knowledge Discovery and Data Mining · doi:10.1145/2939672.2939785 · Cited by 54,569
Greedy function approximation: A gradient boosting machine
Friedman, J. H. (2001) · The Annals of Statistics · doi:10.1214/aos/1013203451 · Cited by 30,731
(1993) · New England Journal of Medicine · doi:10.1056/nejm199309303291401 · Cited by 24,667
From local explanations to global understanding with explainable AI for trees
Lundberg, S. M., Erion, G., Chen, H., DeGrave, A., Prutkin, J. M., Nair, B., Katz, R., Himmelfarb, J., Bansal, N., & Lee, S.-I. (2020) · Nature Machine Intelligence · doi:10.1038/s42256-019-0138-9 · Cited by 10,551
High-performance medicine: the convergence of human and artificial intelligence
Topol, E. J. (2019) · Nature Medicine · doi:10.1038/s41591-018-0300-7 · Cited by 10,450
Measuring the Accuracy of Diagnostic Systems
Swets, J. A. (1988) · Science · doi:10.1126/science.3287615 · Cited by 10,058
The use of the area under the ROC curve in the evaluation of machine learning algorithms
Bradley, A. P. (1997) · Pattern Recognition · doi:10.1016/s0031-3203(96)00142-2 · Cited by 7,217
Global estimates of diabetes prevalence for 2013 and projections for 2035
Guariguata, L., Whiting, D. R., Hambleton, I., Beagley, J., Linnenkamp, U., & Shaw, J. E. (2014) · Diabetes Research and Clinical Practice · doi:10.1016/j.diabres.2013.11.002 · Cited by 4,642
Research works printed but not linked: 2
- Bojer, C. & Meldgaard, J. Learnings from Kaggle’s Forecasting Competitions. arXiv, https://arxiv.org/ftp/arxiv/papers/2009/2009.07701.pdf (2020).
- Vaswani, A. et al. in Advances in Neural Information Processing Systems (eds. Guyon, I. et al.) 5998–6008 (Curran Associates, Inc., 2017).
Cited by
Sorted by citations
Machine learning and deep learning predictive models for type 2 diabetes: a systematic review
Fregoso-Aparicio, L., Noguez, J., Montesinos, L., & García-García, J. A. (2021) · Diabetology & Metabolic Syndrome · doi:10.1186/s13098-021-00767-9 · Cited by 224
Machine Learning in Vascular Surgery: A Systematic Review and Critical Appraisal
Li, B., Feridooni, T., Cuen-Ojeda, C., Kishibe, T., de Mestral, C., Mamdani, M., & Al-Omran, M. A. (2021) · npj Digital Medicine · doi:10.1038/s41746-021-00552-y · Cited by 145
Ravaut, M., Harish, V., Sadeghi, H., Leung, K. K., Volkovs, M., Kornas, K., Watson, T., Poutanen, T., & Rosella, L. C. (2021) · JAMA Network Open · doi:10.1001/jamanetworkopen.2021.11315 · Cited by 97
Self-citationPrediction of complications of type 2 Diabetes: A Machine learning approach
Nicolucci, A., Romeo, L., Bernardini, M., Vespasiani, M., Rossi, M. C., Petrelli, M., Ceriello, A., Di Bartolo, P., Frontoni, E., & Vespasiani, G. (2022) · Diabetes Research and Clinical Practice · doi:10.1016/j.diabres.2022.110013 · Cited by 67
Parray, A. A., Inam, Z. M., Ramonfaur, D., Haider, S. S., Mistry, S. K., & Pandya, A. K. (2023) · Global Transitions · doi:10.1016/j.glt.2023.05.001 · Cited by 60
Taloba, A. I., El-Aziz, R. M. A., Alshanbari, H. M., & El-Bagoury, A. A.-A. H. (2022) · Journal of Healthcare Engineering · doi:10.1155/2022/7969220 · Cited by 54
Mora, T., Roche, D., & Rodríguez-Sánchez, B. (2023) · Diabetes Research and Clinical Practice · doi:10.1016/j.diabres.2023.110910 · Cited by 52
Li, B., Eisenberg, N., Beaton, D., Lee, D. S., Aljabri, B. A., Verma, R., Wijeysundera, D. N., Rotstein, O. D., de Mestral, C., Mamdani, M., et al. (2023) · Annals of Surgery · doi:10.1097/sla.0000000000006181 · Cited by 42
Machine Learning to Predict Outcomes of Endovascular Intervention for Patients With PAD
Li, B., Warren, B. E., Eisenberg, N., Beaton, D., Lee, D. S., Aljabri, B. A., Verma, R., Wijeysundera, D. N., Rotstein, O. D., de Mestral, C., et al. (2024) · JAMA Network Open · doi:10.1001/jamanetworkopen.2024.2350 · Cited by 39
An In-Ear PPG-Based Blood Glucose Monitor: A Proof-of-Concept Study
Hammour, G., & Mandic, D. P. (2023) · Sensors · doi:10.3390/s23063319 · Cited by 39
Cefalu, W. T., Andersen, D. K., Arreaza-Rubín, G., Pin, C. L., Sato, S. M., Verchere, C. B., Woo, M., & Rosenblum, N. D. (2021) · Diabetes Care · doi:10.2337/dci21-0051 · Cited by 36
Schallmoser, S., Züger, T., Kraus, M., Saar‐Tsechansky, M., Stettler, C., & Feuerriegel, S. (2023) · Journal of Medical Internet Research · doi:10.2196/42181 · Cited by 35
Talukder, M. A., Islam, M. M., Uddin, M. A., Kazi, M., Khalid, M., Akhter, A., & Moni, M. A. (2024) · Digital Health · doi:10.1177/20552076241271867 · Cited by 32
Carletti, M., Pandit, J. A., Gadaleta, M., Chiang, D. C., Delgado, F., Quartuccio, K., Fernandez, B., Garay, J. A. R., Torkamani, A., Miotto, R., et al. (2025) · Nature Medicine · doi:10.1038/s41591-025-03849-7 · Cited by 31
Flap failure prediction in microvascular tissue reconstruction using machine learning algorithms
Shi, Y.-C., Li, J., Li, S.-J., Li, Z., Zhang, H., Wu, Z., & Wu, Z. (2022) · World Journal of Clinical Cases · doi:10.12998/wjcc.v10.i12.3729 · Cited by 30
Yang, H., li, J., Liu, S., Yang, X., & Liu, J. (2022) · JMIR Medical Informatics · doi:10.2196/36958 · Cited by 30
Kanda, E., Suzuki, A., Makino, M., Tsubota, H., Kanemata, S., Shirakawa, K., & Yajima, T. (2022) · Scientific Reports · doi:10.1038/s41598-022-24562-2 · Cited by 29
Afrifa‐Yamoah, E., Adua, E., Peprah‐Yamoah, E., Anto, E. O., Opoku‐Yamoah, V., Acheampong, E., Macartney, M. J., & Hashmi, R. (2024) · Chronic Diseases and Translational Medicine · doi:10.1002/cdt3.137 · Cited by 34
Using machine learning to predict outcomes following carotid endarterectomy
Li, B., Beaton, D., Eisenberg, N., Lee, D. S., Wijeysundera, D. N., Lindsay, T. F., de Mestral, C., Mamdani, M., Roche‐Nagle, G., & Al-Omran, M. A. (2023) · Journal of Vascular Surgery · doi:10.1016/j.jvs.2023.05.024 · Cited by 25
Li, B., Verma, R., Beaton, D., Tamim, H., Hussain, M. A., Hoballah, J. J., Lee, D. S., Wijeysundera, D. N., de Mestral, C., Mamdani, M., et al. (2023) · Journal of the American Heart Association · doi:10.1161/jaha.123.030508 · Cited by 25
Elsayed, A. M., Ahmed, A. M., & Aly, A. H. (2022) · Applied Optics · doi:10.1364/ao.443621 · Cited by 22
Momenzadeh, A., Shamsa, A., & Meyer, J. G. (2022) · JAMIA Open · doi:10.1093/jamiaopen/ooac063 · Cited by 25
Using machine learning to predict outcomes following open abdominal aortic aneurysm repair
Li, B., Aljabri, B. A., Verma, R., Beaton, D., Eisenberg, N., Lee, D. S., Wijeysundera, D. N., Forbes, T. L., Rotstein, O. D., de Mestral, C., et al. (2023) · Journal of Vascular Surgery · doi:10.1016/j.jvs.2023.08.121 · Cited by 25
Benito, G. V., Goldberg, X., Brachowicz, N., Castaño‐Vinyals, G., Blay, N., Espinosa, A., Davidhi, F., Torres, D., Kogevinas, M., de Cid, R., et al. (2024) · Artificial Intelligence in Medicine · doi:10.1016/j.artmed.2024.102991 · Cited by 29
Cefalu, W. T., Andersen, D. K., Arreaza-Rubín, G., Pin, C. L., Sato, S. M., Verchere, C. B., Woo, M., & Rosenblum, N. D. (2021) · Diabetes · doi:10.2337/db21-0777 · Cited by 20
Predicting Outcomes Following Lower Extremity Endovascular Revascularization Using Machine Learning
Li, B., Aljabri, B. A., Verma, R., Beaton, D., Hussain, M. A., Lee, D. S., Wijeysundera, D. N., de Mestral, C., Mamdani, M., & Al-Omran, M. A. (2024) · Journal of the American Heart Association · doi:10.1161/jaha.123.033194 · Cited by 21
Machine-Learning-Based Prediction Modelling in Primary Care: State-of-the-Art Review
Sherbini, A. E., Virk, H. U. H., Wang, Z., Glicksberg, B. S., & Krittanawong, C. (2023) · AI · doi:10.3390/ai4020024 · Cited by 22
Li, B., Verma, R., Beaton, D., Tamim, H., Hussain, M. A., Hoballah, J. J., Lee, D. S., Wijeysundera, D. N., de Mestral, C., Mamdani, M., et al. (2023) · Journal of Vascular Surgery · doi:10.1016/j.jvs.2023.07.006 · Cited by 18
Li, B., Eisenberg, N., Beaton, D., Lee, D. S., Aljabri, B. A., Al‐Omran, L., Wijeysundera, D. N., Rotstein, O. D., Lindsay, T. F., de Mestral, C., et al. (2025) · Journal of the American Heart Association · doi:10.1161/jaha.124.039221 · Cited by 17
Using machine learning to predict outcomes following suprainguinal bypass
Li, B., Eisenberg, N., Beaton, D., Lee, D. S., Aljabri, B. A., Wijeysundera, D. N., Rotstein, O. D., de Mestral, C., Mamdani, M., Roche‐Nagle, G., et al. (2023) · Journal of Vascular Surgery · doi:10.1016/j.jvs.2023.09.037 · Cited by 16
Manzini, E., Vlacho, B., Franch‐Nadal, J., Escudero, J., Génova, A., Reixach, E., Andrés, E., Pizarro, I., Mauricio, D., & Perera-Lluna, A. (2025) · Expert Systems with Applications · doi:10.1016/j.eswa.2025.126876 · Cited by 15
A computational framework for discovering digital biomarkers of glycemic control
Bartolome, A., & Prioleau, T. (2022) · npj Digital Medicine · doi:10.1038/s41746-022-00656-z · Cited by 13
Predicting outcomes following lower extremity open revascularization using machine learning
Li, B., Verma, R., Beaton, D., Tamim, H., Hussain, M. A., Hoballah, J. J., Lee, D. S., Wijeysundera, D. N., de Mestral, C., Mamdani, M., et al. (2024) · Scientific Reports · doi:10.1038/s41598-024-52944-1 · Cited by 11
Impact of the COVID-19 Pandemic on the Health Workforce in Canada
Tardif, A., Gupta, B., McNeely, L., & Feeney, W. (2022) · Healthcare Quarterly · doi:10.12927/hcq.2022.26812 · Cited by 11
Predicting lack of clinical improvement following varicose vein ablation using machine learning
Li, B., Eisenberg, N., Beaton, D., Lee, D. S., Al‐Omran, L., Wijeysundera, D. N., Hussain, M. A., Rotstein, O. D., de Mestral, C., Mamdani, M., et al. (2024) · Journal of Vascular Surgery Venous and Lymphatic Disorders · doi:10.1016/j.jvsv.2024.102162 · Cited by 13
Predicting amputation using machine learning: A systematic review
Yao, P. F., Diao, Y. D., McMullen, E. P., Manka, M., Murphy, J., & Lin, C. (2023) · PLoS ONE · doi:10.1371/journal.pone.0293684 · Cited by 9
Using Machine Learning to Predict Outcomes Following Transfemoral Carotid Artery Stenting
Li, B., Eisenberg, N., Beaton, D., Lee, D. S., Al‐Omran, L., Wijeysundera, D. N., Hussain, M. A., Rotstein, O. D., de Mestral, C., Mamdani, M., et al. (2024) · Journal of the American Heart Association · doi:10.1161/jaha.124.035425 · Cited by 11
Lee, J., Choi, Y., Ko, T., Lee, K., Shin, J., & Kim, H.-S. (2024) · Endocrinology and Metabolism · doi:10.3803/enm.2023.1739 · Cited by 9
An Efficient Health Insurance Prediction System using Machine learning
Vinora, A., Surya, V., Lloyds, E., Pandian, B. K., Deborah, R. N., & Gobinath, A. (2023) · International Conference on Innovative Computing, Intelligent Communication and Smart Electrical Systems (ICSES) · doi:10.1109/icses60034.2023.10465334 · Cited by 9
Design of a Wearable Finger PPG-Based Blood Glucose Monitor
Wang, M., Liu, X., Han, W., Lin, X., Chen, X., Zhao, S., Zhuang, Z., Zhang, L., & Su, P. (2025) · Annals of Biomedical Engineering · doi:10.1007/s10439-025-03809-9 · Cited by 8
Wearable technology in vascular surgery: Current applications and future perspectives
Bartos, O., & Trenner, M. (2024) · Seminars in Vascular Surgery · doi:10.1053/j.semvascsurg.2024.08.004 · Cited by 8
Artificial intelligence in primary care
Sherbini, A. E., Glicksberg, B. S., & Krittanawong, C. (2023) · Elsevier eBooks · doi:10.1016/b978-0-443-15688-5.00039-5 · Cited by 9
RETRACTED ARTICLE: iDP: ML-driven diabetes prediction framework using deep-ensemble modeling
Kumar, A., Bawa, S., & Kumar, N. (2023) · Neural Computing and Applications · doi:10.1007/s00521-023-09184-7 · Cited by 8
RetractedPredicting inferior vena cava filter complications using machine learning
Li, B., Eisenberg, N., Beaton, D., Lee, D. S., Al‐Omran, L., Wijeysundera, D. N., Hussain, M. A., Rotstein, O. D., de Mestral, C., Mamdani, M., et al. (2024) · Journal of Vascular Surgery Venous and Lymphatic Disorders · doi:10.1016/j.jvsv.2024.101943 · Cited by 7
Ukah, U. V., Platt, R. W., Auger, N., Dasgupta, K., & Dayan, N. (2022) · Scientific Reports · doi:10.1038/s41598-022-14215-9 · Cited by 9
Kim, H., Jung, D. Y., Lee, S., Cho, J., Yim, H. W., & Kim, H. (2023) · Journal of Korean Medical Science · doi:10.3346/jkms.2023.38.e24 · Cited by 7
How machine learning on real world clinical data improves adverse event recording for endoscopy
Wittlinger, S., Wiest, I. C., Ladani, M. J., Kather, J. N., Ebert, M. P., Siegel, F. P., & Belle, S. (2025) · npj Digital Medicine · doi:10.1038/s41746-025-01826-5 · Cited by 6
Sarwar, M. A., Damaševičius, R., Belousovienė, E., & Maskeliūnas, R. (2026) · Artificial Intelligence in Medicine · doi:10.1016/j.artmed.2026.103409 · Cited by 6
Lau, D. C. W., Shaw, E., Farris, M. S., McMullen, S., Brar, S., Cowling, T., Chatterjee, S., Quansah, K., Kyaw, M. H., & Girard, L. (2023) · Canadian Journal of Diabetes · doi:10.1016/j.jcjd.2023.12.004 · Cited by 6
Nghiem, N., Wilson, N., Krebs, J. D., & Tran, T. (2024) · BMC Medical Informatics and Decision Making · doi:10.1186/s12911-024-02678-x · Cited by 8
Predicting mortality risk following major lower extremity amputation using machine learning
Li, B., Eisenberg, N., Beaton, D., Lee, D. S., Al‐Omran, L., Wijeysundera, D. N., Hussain, M. A., Rotstein, O. D., de Mestral, C., Mamdani, M., et al. (2025) · Journal of Vascular Surgery · doi:10.1016/j.jvs.2025.03.198 · Cited by 6
Recent advances in artificial intelligence-assisted endocrinology and diabetes
Oikonomakos, I. T., Anjana, R. M., Mohan, V., Steenblock, C., & Bornstein, S. R. (2023) · doi:10.37349/eemd.2023.00004 · Cited by 7
Predicting outcomes following endovascular aortoiliac revascularization using machine learning
Li, B., Aljabri, B. A., Beaton, D., Al‐Omran, L., Hussain, M. A., Lee, D. S., Wijeysundera, D. N., Rotstein, O. D., de Mestral, C., Mamdani, M., et al. (2025) · npj Digital Medicine · doi:10.1038/s41746-025-01865-y · Cited by 5
Artificial Intelligence for the Future of Medicine
Ruiz, R. B., & Velásquez, J. D. (2022) · Intelligent systems reference library · doi:10.1007/978-3-031-11170-9_1 · Cited by 8
Vimont, A., Béliard, S., Valéro, R., Leleu, H., & Durand‐Zaleski, I. (2023) · Diabetology & Metabolic Syndrome · doi:10.1186/s13098-023-01105-x · Cited by 5
Lopes, J., Faria, M., & Santos, M. F. (2024) · PLoS ONE · doi:10.1371/journal.pone.0302697 · Cited by 5
González-Touya, M., Carmona, R., & Sarría‐Santamera, A. (2021) · Healthcare · doi:10.3390/healthcare9070873 · Cited by 5
Sugimoto, H., Hironaka, K., Yamada, T., Otowa‐Suematsu, N., Hirota, Y., Otake, H., Hirata, K., Sakaguchi, K., Ogawa, W., & Kuroda, S. (2025) · eLife · doi:10.7554/elife.102860 · Cited by 5
Xie, X., Wu, C., Huang, Z., Zhou, Y., Huang, J., Dao, F., Yan, D., Deng, K., Lyu, H., Ma, C., et al. (2026) · Briefings in Bioinformatics · doi:10.1093/bib/bbag083 · Cited by 4
“Multi-center studies typically relied on EHR systems or international collaborations [87, 88], while single-center studies were mainly drawn from hospital inpatient or outpatient records.”
Abejirinde, I. O., Itanyi, I. U., Kornas, K., Zaim, R., Guha, S., Chui, V., Lipscombe, L. L., Rosella, L. C., & Shaw, J. (2025) · Journal of Participatory Medicine · doi:10.2196/69497 · Cited by 5
Self-citationKlunder, L. A., Guericke, D., Bemthuis, R., Koenderink, M., & Machado, M. (2026) · International Journal of Data Science and Analytics · doi:10.1007/s41060-026-01138-1 · Cited by 5
Rosella, L. C., Shaw, J., Guha, S., Abejirinde, I. O., Gibson, J., Lipscombe, L. L., Kornas, K., Zaim, R., Chui, V., & Itanyi, I. U. (2025) · Digital Health · doi:10.1177/20552076251358541 · Cited by 6
Self-citationNicolucci, A., Vespasiani, G., Mannino, D., Russo, G. T., Lucisano, G., Rossi, M. C., Ponzani, P., Cosmo, S. D., Cianni, G. D., Lencioni, C., et al. (2025) · Diabetes Research and Clinical Practice · doi:10.1016/j.diabres.2025.112900 · Cited by 4
Implementation of machine learning in emergency departments: A systematic review
Hosseini, B., Patel, A., Landes, M., Vaillancourt, S., Mamdani, M. M., Maruthananth, K., Matharu, N., Pathan, Z., Sivapragasam, K., Ruangsomboon, O., et al. (2026) · Digital Health · doi:10.1177/20552076251411209 · Cited by 5
Laudicella, M., Donni, P. L., & Prete, V. (2024) · Health Policy · doi:10.1016/j.healthpol.2024.105079 · Cited by 4
Phan, L. T., Rakkiyappan, R., & Manavalan, B. (2025) · Computers in Biology and Medicine · doi:10.1016/j.compbiomed.2025.109771 · Cited by 6
Missing Value Imputation for Diabetes Prediction
Luo, F., Qian, H., Wang, D., Guo, X., Sun, Y., Lee, E. S., Teong, H. H., Lai, R., & Miao, C. (2022) · International Joint Conference on Neural Networks (IJCNN) · doi:10.1109/ijcnn55064.2022.9892398 · Cited by 4
Postill, G., Harish, V., Itanyi, I. U., Tang, F., Buajitti, E., Kuenzig, M. E., Rosella, L. C., & Benchimol, E. I. (2025) · Communications Medicine · doi:10.1038/s43856-025-01191-0 · Cited by 3
Self-citationMachine Learning–Driven Prediction of Comorbidities and Mortality in Adults With Type 1 Diabetes
Andersen, J. S., Stoltenberg, C. W., Jensen, M. H., Vestergaard, P., Hejlesen, O. K., & Hangaard, S. (2024) · Journal of Diabetes Science and Technology · doi:10.1177/19322968241267779 · Cited by 3
Jaberi‐Douraki, M., Xu, X., Dima, D., Ailawadhi, S., Anwer, F., Mazzoni, S. A., Valent, J. N., Habib, M. H., Riviere, J. E., & Raza, S. (2024) · Blood Cancer Journal · doi:10.1038/s41408-024-01206-4 · Cited by 3
Using machine learning to predict outcomes following transcarotid artery revascularization
Li, B., Eisenberg, N., Beaton, D., Lee, D. S., Al‐Omran, L., Wijeysundera, D. N., Hussain, M. A., Rotstein, O. D., de Mestral, C., Mamdani, M., et al. (2025) · Scientific Reports · doi:10.1038/s41598-024-81625-2 · Cited by 3
Enhancing risk prediction base on health administrative data using high-dimensional prediction model
Hossain, M. B., Sadatsafavi, M., Wong, H., Cook, V. J., Johnston, J. C., & Karim, M. E. (2025) · Journal of Clinical Epidemiology · doi:10.1016/j.jclinepi.2025.111857 · Cited by 3
Machine Learning Applied to Routinely Collected Health Administrative Data
Rosella, L. C., & Harish, V. (2022) · Healthcare Quarterly · doi:10.12927/hcq.2022.26813 · Cited by 3
Self-citationPiccolino, A. L., Piccolino, A. R., & Piccolino, S. G. (2023) · Applied Neuropsychology Adult · doi:10.1080/23279095.2023.2236742 · Cited by 3
Cefalu, W. T., Andersen, D. K., Arreaza-Rubín, G., Pin, C. L., Sato, S. M., Verchere, C. B., Woo, M., Rosenblum, N. D., Rosenblum, N. D., Cefalu, W. T., et al. (2021) · Canadian Journal of Diabetes · doi:10.1016/j.jcjd.2021.09.126 · Cited by 3
Knowledge Engineering Challenges in Smart Healthcare Data Analysis System
Saroj, S., Saleena, B., & Prakash, B. (2022) · doi:10.1002/9781119792550.ch13 · Cited by 3
Predicting outcomes following open abdominal aortic aneurysm repair using machine learning
Li, B., Aljabri, B. A., Beaton, D., Al‐Omran, L., Hussain, M. A., Lee, D. S., Wijeysundera, D. N., Rotstein, O. D., de Mestral, C., Mamdani, M., et al. (2025) · Scientific Reports · doi:10.1038/s41598-025-98573-0 · Cited by 3
Machine learning-based methods for predicting postpartum depression: A review
Zhang, X., Bao, J., Ye, J., Qiu, X., & Pan, Y. (2026) · Artificial Intelligence in Medicine · doi:10.1016/j.artmed.2026.103410 · Cited by 2
Roberts, S. B., Löffler, A., Ramachandram, D., Garay-Fernandez, J., Norman, M., Pow, C., Razak, F. A., Verma, A. A., & de Mestral, C. (2026) · Journal of Clinical Epidemiology · doi:10.1016/j.jclinepi.2026.112295 · Cited by 2
Subramanian, D., & Cohen, T. (2022) · Cognitive informatics in biomedicine and healthcare · doi:10.1007/978-3-031-09108-7_6 · Cited by 2
Ong, R., Ng, C. J., Gunasekaran, K., Liu, H., Hsu, W., Lee, M. L., & Tan, N. C. (2025) · PLoS ONE · doi:10.1371/journal.pone.0319992 · Cited by 2
A Review of Machine Learning Algorithms in Diabetes Management
Gayaki, U., Daronde, S. B., Tale, A., & Barhate, A. (2025) · International Conference on Sentiment Analysis and Deep Learning (ICSADL) · doi:10.1109/icsadl65848.2025.10933462 · Cited by 2
Guazzo, A., Longato, E., Fadini, G. P., Morieri, M. L., Sparacino, G., & Camillo, B. D. (2023) · Lecture notes in computer science · doi:10.1007/978-3-031-25599-1_32 · Cited by 2
Phuong, T. N., Tai, N. D., Aloufi, A. S., Subramani, B., & Theivaraj, S. D. (2023) · Environmental Research · doi:10.1016/j.envres.2023.117249 · Cited by 2
RetractedA Systematic Review of Supervised Learning and Deep Learning Algorithms for Diabetic Detection
Sridevi, P., & Padmanaban, K. (2025) · International Conference on Sentiment Analysis and Deep Learning (ICSADL) · doi:10.1109/icsadl65848.2025.10933238 · Cited by 1
Predicting Outcomes Following Carotid Artery Stenting Using Machine Learning
Li, B., Aljabri, B. A., Beaton, D., Hussain, M. A., Lee, D. S., Wijeysundera, D. N., Rotstein, O. D., de Mestral, C., Mamdani, M., Roche‐Nagle, G., et al. (2025) · Journal of Endovascular Therapy · doi:10.1177/15266028251333670 · Cited by 1
Sivakumar, N. R. (2025) · International Conference on IT Innovation and Knowledge Discovery (ITIKD) · doi:10.1109/itikd63574.2025.11005343 · Cited by 1
Aagaard, A., Röttger, R., Johnson, E. K., & Olsen, K. R. (2025) · Scientific Reports · doi:10.1038/s41598-025-18079-7 · Cited by 1
Petch, J., Di, S., Watson, T., Becerra, M. P., Rosella, L. C., Natarajan, M., Sheth, T., & Schwalm, J.-D. (2026) · European Heart Journal - Digital Health · doi:10.1093/ehjdh/ztag040 · Cited by 1
Self-citationFllatah, J., & Banjar, H. R. (2026) · JMIR Formative Research · doi:10.2196/81039 · Cited by 1
Nygård, K., Ryhänen, R., Kortteenniemi, A., Järvinen, K., Vesikansa, A., Mehtälä, J., Koivusalo, M., Tirronen, A., Asllanaj, E., Kaukua, J., et al. (2026) · Diabetes Therapy · doi:10.1007/s13300-026-01879-z · Cited by 1
Ghafoor, B., Zaccardi, F., Khunti, K. K., & Shabnam, S. (2026) · Diabetic Medicine · doi:10.1111/dme.70398 · Cited by 2
Machine Learning in Diabetes Modeling
Ardabili, S., Mosavi, A., & Felde, I. (2023) · IEEE International Symposium on Intelligent Systems and Informatics (SISY) · doi:10.1109/sisy60376.2023.10417934 · Cited by 1
Machine Learning in Vascular Surgery: A Systematic Review and Critical AppraisalPreprint
Li, B., Feridooni, T., Cuen-Ojeda, C., Kishibe, T., de Mestral, C., Mamdani, M., & Al-Omran, M. (2021) · SSRN Electronic Journal · doi:10.2139/ssrn.3867678 · Cited by 1
Vimont, A., Béliard, S., Valéro, R., Leleu, H., & Durand‐Zaleski, I. (2022) · Research Square · doi:10.21203/rs.3.rs-1604014/v1
Vimont, A., Béliard, S., Valéro, R., Leleu, H., & Durand‐Zaleski, I. (2022) · Research Square · doi:10.21203/rs.3.rs-1604014/v2
Hossain, M. S., Devnath, A., & Karmokar, P. K. (2023) · Research Square · doi:10.21203/rs.3.rs-3364064/v1
Mohammed, S. J., Ahmed, A. M. S., & Mohammed, M. S. (2023) · JOIV International Journal on Informatics Visualization · doi:10.30630/joiv.7.3-2.1868
Borba, M. F. (2023) · Digital Library of Theses and Dissertations (Universidade de São Paulo) · doi:10.11606/t.6.2023.tde-05022024-163230 · Cited by 2
Metadata
- Authors
- Ravaut, M., Sadeghi, H., Leung, K. K., Volkovs, M., Kornas, K., Harish, V., Watson, T., Lewis, G. F., Weisman, A., Poutanen, T., & Rosella, L.
- Affiliations
- University of Toronto (CA)
- Mount Sinai Hospital (CA)
- Corresponding author
- Rosella, Laura
- ORCID
- Venue
- npj Digital Medicine
- Published
- 2021-02-12
- Volume
- 4
- Issue
- 1
- Pages
- 24-24
- ISSN
- 2398-6352 (ISSN-L)
- PMC
- PMC7881135
- OpenAlex
- W3127218785
- Cited by
- 121
- References
- 93
- Citations by year
- 2026: 20 · 2025: 30 · 2024: 18 · 2023: 28 · 2022: 18 · 2021: 7
- FWCI
- 6.27
- Type
- journal article
- Language
- en
- Open access
- gold
- doi.org
- Locations
- npj Digital Medicine (publishedVersion, cc-by)
- PubMed Central (publishedVersion, cc-by)
- PubMed (publishedVersion)
- DOAJ (DOAJ: Directory of Open Access Journals) (submittedVersion, cc-by-sa)
- Funders
- Canada Research Chairs
- Gouvernement du Canada | Canadian Institutes of Health Research
- Topics
- Physical Sciences › Computer Science › Artificial Intelligence › Machine Learning in Healthcare
- Health Sciences › Health Professions › Health Information Management › Artificial Intelligence in Healthcare
- Health Sciences › Medicine › Endocrinology, Diabetes and Metabolism › Diabetes Management and Research
- Keywords
- diabetes complications, adverse outcome prediction, administrative health data, gradient boosting decision tree, tissue infection, diabetic retinopathy, cardiovascular events, amputation, single-payer health care, Ontario, healthcare resource allocation, health planning
About these checks
Registry, retraction, Cites and statistics results are computed, not judged, with one exception: a printed reference that no index lists is read once by a model before it counts as a citation error. Claims are extracted by a model and kept only when their quote appears verbatim in the text; each cited source is then checked, with a model’s help, for whether it says what the claim relies on. Those verdicts can be wrong — read the claim’s quote and the cited source before relying on one.
Statistics and arithmetic are recomputed, not judged.
Confidence bands are shown only for fields calibrated on our annotated test set. None is calibrated yet, so no band is shown.
What counts as a claim ›How we measure confidence ›How we check this ›
Are you an author, or do you see a problem with this page? Request a review
