

The DOI matches its Crossref record; 87 of the 87 references it cites were found in a registry or an index.
IFN signaling and neutrophil degranulation transcriptional signatures are induced during SARS-CoV-2 infection
Open accessPublished version of a preprint
Abstract
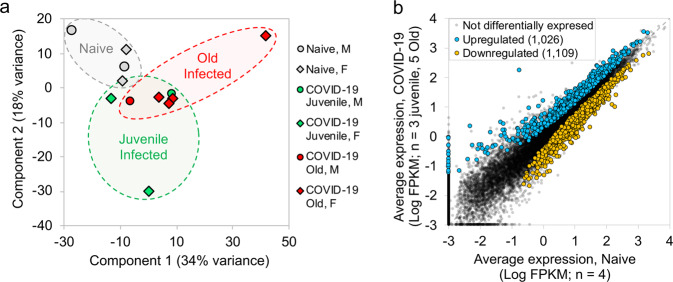
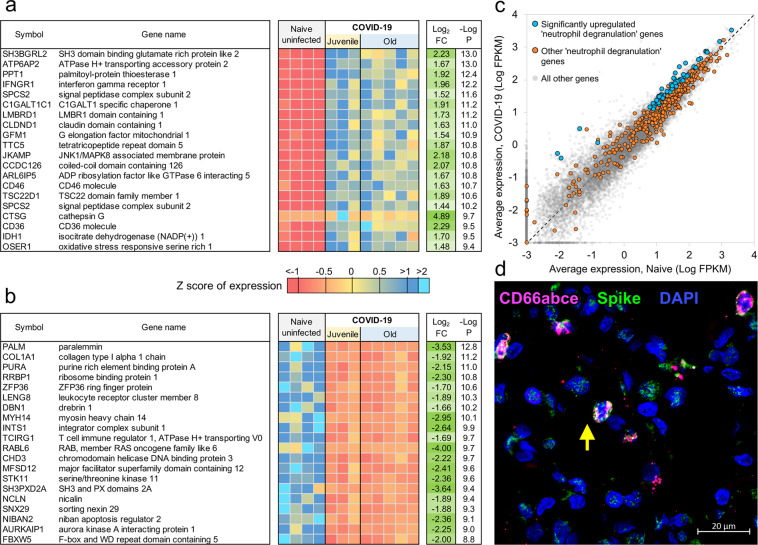
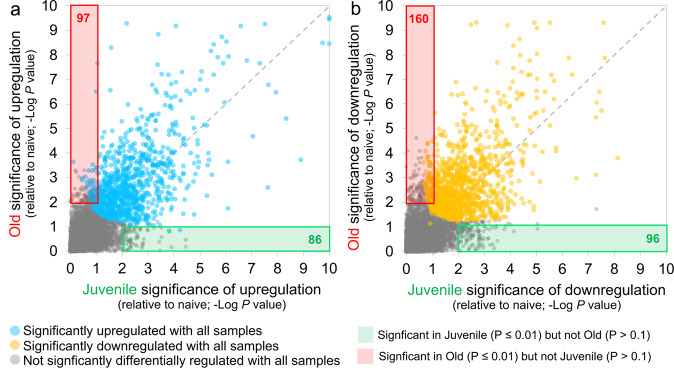
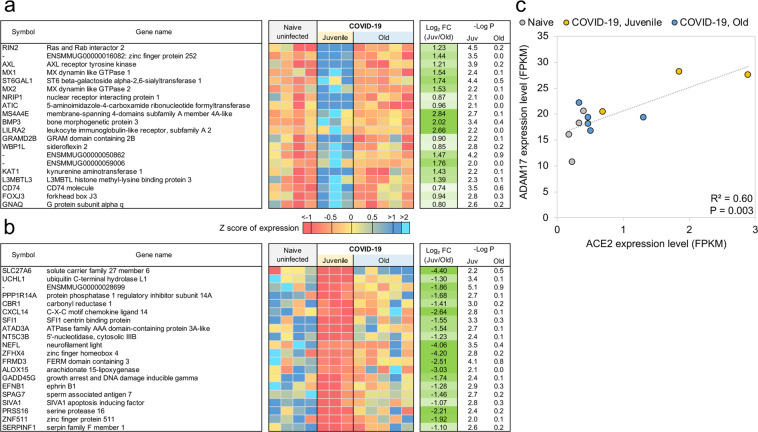
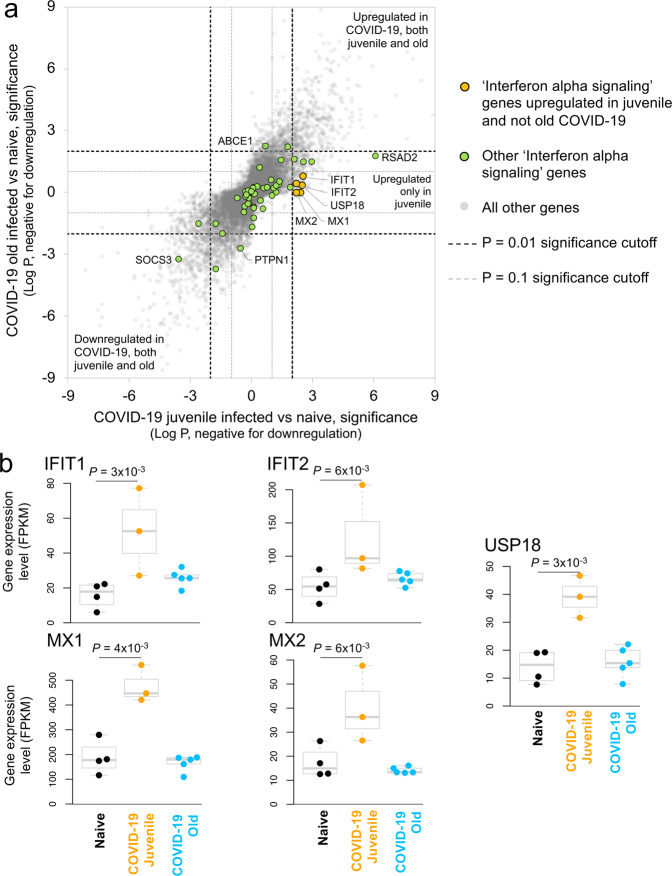
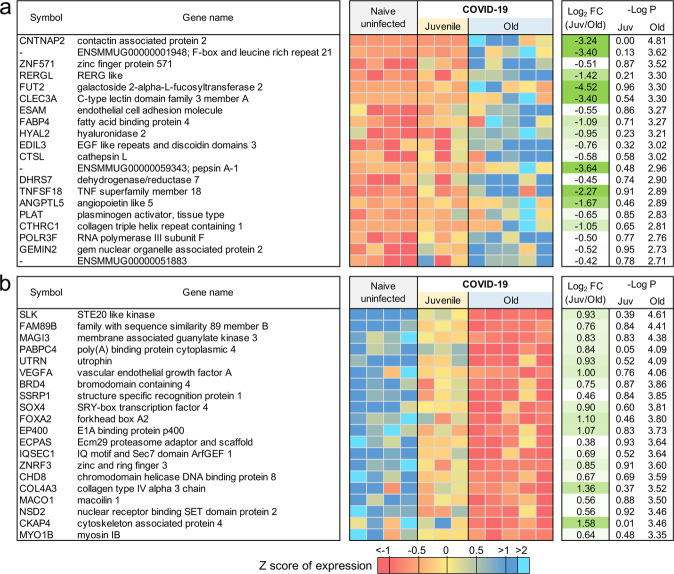
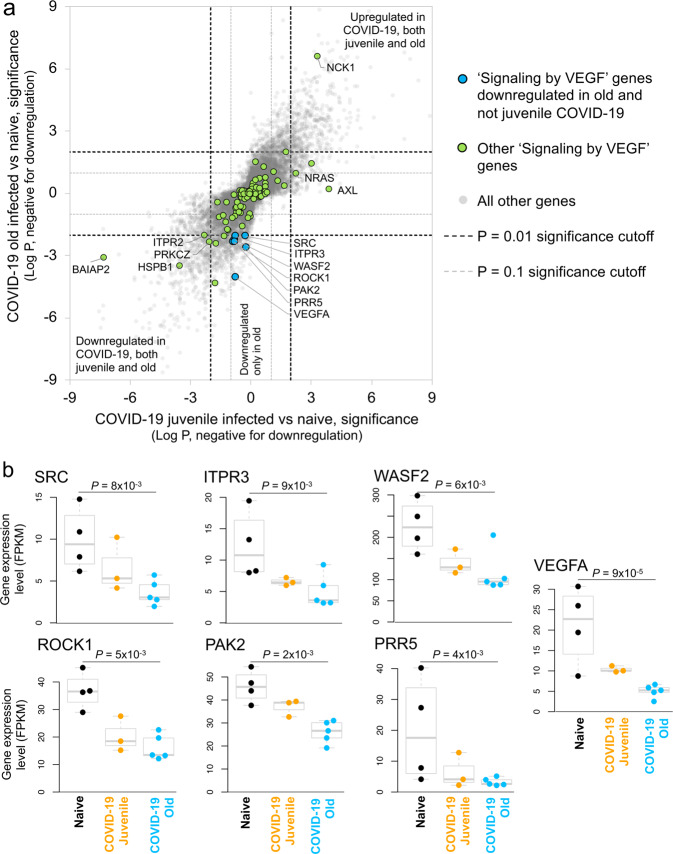
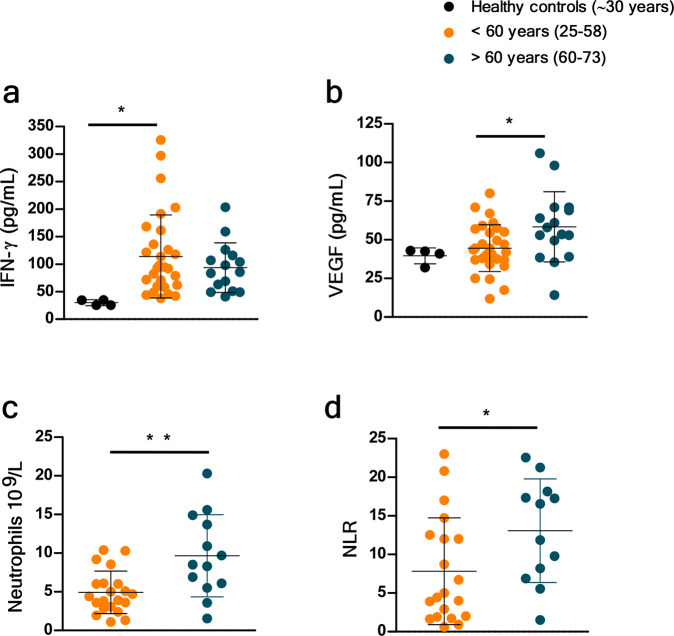
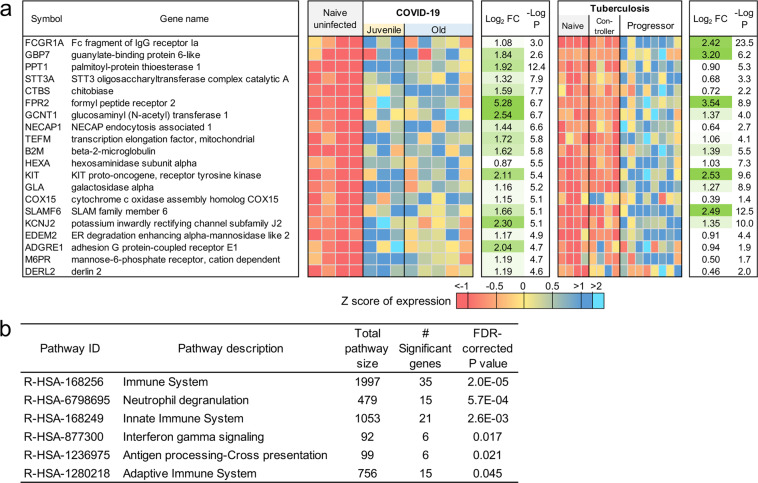
SARS-CoV-2 virus has infected more than 92 million people worldwide resulting in the Coronavirus disease 2019 (COVID-19). Using a rhesus macaque model of SARS-CoV-2 infection, we have characterized the transcriptional signatures induced in the lungs of juvenile and old macaques following infection. Genes associated with Interferon (IFN) signaling, neutrophil degranulation and innate immune pathways are significantly induced in macaque infected lungs, while pathways associated with collagen formation are downregulated, as also seen in lungs of macaques with tuberculosis. In COVID-19, increasing age is a significant risk factor for poor prognosis and increased mortality. Type I IFN and Notch signaling pathways are significantly upregulated in lungs of juvenile infected macaques when compared with old infected macaques. These results are corroborated with increased peripheral neutrophil counts and neutrophil lymphocyte ratio in older individuals with COVID-19 disease. Together, our transcriptomic studies have delineated disease pathways that improve our understanding of the immunopathogenesis of COVID-19.
Overview
The claims and statistics of this paper haven’t been checked yet.
Run the check — free, no account needed. It reads the open-access text and checks the sources it cites.
Integrity signals
Registry
Cites
Statistics
Figures
Verification
Claims the paper makes
The claims and statistics of this paper haven’t been checked yet.
Run the check — free, no account needed. It reads the open-access text and checks the sources it cites.
Claims other papers make about this one
Each is checked against this paper’s own text: does it say what the citing paper says it does?
In the citing paper
“a study of SARS-CoV-2 infection in old and juvenile rhesus macaques showed lower levels of ACE2 in old versus young macaques after SARS-CoV-2 infection, supporting the hypothesis that ACE2 is dysregulated in the elderly, even across species67.”
From SARS-CoV-2, COVID-19 and the aging immune system (2021) · cites this paper as [67]
In the citing paper
“In a rhesus macaque model of SARS-CoV-2 infection, old macaques also had reduced type I IFN and Notch signaling pathways in their lungs when compared to juvenile counterparts67.”
From SARS-CoV-2, COVID-19 and the aging immune system (2021) · cites this paper as [67]
Self-check
Percentages, sums and reported differences re-computed from the paper’s own numbers.
The self-check needs the paper’s full text.
Citations
Cites
Controlling the False Discovery Rate: A Practical and Powerful Approach to Multiple Testing
Benjamini, Y., & Hochberg, Y. (1995) · Journal of the Royal Statistical Society Series B: Statistical Methodology · doi:10.1111/j.2517-6161.1995.tb02031.x · Cited by 109,482
Trimmomatic: a flexible trimmer for Illumina sequence data
Bolger, A. M., Lohse, M., & Usadel, B. (2014) · Bioinformatics · doi:10.1093/bioinformatics/btu170 · Cited by 65,548
STAR: ultrafast universal RNA-seq aligner
Dobin, A., Davis, C. A., Schlesinger, F., Drenkow, J., Zaleski, C., Jha, S., Batut, P., Chaisson, M., & Gingeras, T. R. (2013) · Bioinformatics · doi:10.1093/bioinformatics/bts635 · Cited by 51,709
Clinical features of patients infected with 2019 novel coronavirus in Wuhan, China
Huang, C., Wang, Y., Li, X., Ren, L., Zhao, J., Hu, Y., Zhang, L., Fan, G., Xu, J., Gu, X., et al. (2020) · The Lancet · doi:10.1016/s0140-6736(20)30183-5 · Cited by 48,884
featureCounts: an efficient general purpose program for assigning sequence reads to genomic features
Liao, Y., Smyth, G. K., & Shi, W. (2014) · Bioinformatics · doi:10.1093/bioinformatics/btt656 · Cited by 27,219
lmerTest Package: Tests in Linear Mixed Effects Models
Kuznetsova, A., Brockhoff, P. B., & Christensen, R. H. B. (2017) · Journal of Statistical Software · doi:10.18637/jss.v082.i13 · Cited by 24,346
Differential expression analysis for sequence count data
Anders, S., & Huber, W. (2010) · Genome Biology · doi:10.1186/gb-2010-11-10-r106 · Cited by 15,581
Pathological findings of COVID-19 associated with acute respiratory distress syndrome
Xu, Z., Shi, L., Wang, Y., Zhang, J., Huang, L., Zhang, C., Liu, S., Zhao, P., Liu, H., Zhu, L., et al. (2020) · The Lancet Respiratory Medicine · doi:10.1016/s2213-2600(20)30076-x · Cited by 8,545
Wu, C., Chen, X., Cai, Y., Xia, J., Zhou, X., Xu, S., Huang, H., Zhang, L., Zhou, X., Du, C., et al. (2020) · JAMA Internal Medicine · doi:10.1001/jamainternmed.2020.0994 · Cited by 8,249
Pulmonary Vascular Endothelialitis, Thrombosis, and Angiogenesis in Covid-19
Ackermann, M., Verleden, S. E., Kuehnel, M., Haverich, A., Welte, T., Laenger, F., Vanstapel, A., Werlein, C., Stark, H., Tzankov, A., et al. (2020) · New England Journal of Medicine · doi:10.1056/nejmoa2015432 · Cited by 5,613
Cited by
Sorted by citations
Genetic mechanisms of critical illness in COVID-19
The GenOMICC Investigators, Pairo‐Castineira, E., The ISARIC4C Investigators, Initiative, T. C.-1. H. G., 23andMe Investigators, BRACOVID Investigators, Gen-COVID Investigators, Clohisey, S., Klarić, L., Bretherick, A. D., et al. (2020) · Nature · doi:10.1038/s41586-020-03065-y · Cited by 1,356
Neutrophil, neutrophil extracellular traps and endothelial cell dysfunction in sepsis
Zhang, H., Wang, Y., Qu, M., Li, W., Wu, D., Cata, J. P., & Miao, C. (2023) · Clinical and Translational Medicine · doi:10.1002/ctm2.1170 · Cited by 442
SARS-CoV-2, COVID-19 and the aging immune system
Bartleson, J. M., Radenkovic, D., Covarrubias, A. J., Furman, D., Winer, D. A., & Verdin, E. (2021) · Nature Aging · doi:10.1038/s43587-021-00114-7 · Cited by 359
Patients with COVID-19: in the dark-NETs of neutrophils
Ackermann, M., Anders, H., Bilyy, R. O., Bowlin, G. L., Daniel, C., LORENZO, R. D., Egeblad, M., Henneck, T., Hidalgo, A., Hoffmann, M. H., et al. (2021) · Cell Death and Differentiation · doi:10.1038/s41418-021-00805-z · Cited by 312
Responses to acute infection with SARS-CoV-2 in the lungs of rhesus macaques, baboons and marmosets
Singh, D. K., Singh, B., Ganatra, S. R., Gazi, M., Cole, J., Thippeshappa, R., Alfson, K. J., Clemmons, E., Gonzalez, O., Escobedo, R., et al. (2020) · Nature Microbiology · doi:10.1038/s41564-020-00841-4 · Cited by 209
Self-citationNETosis and Neutrophil Extracellular Traps in COVID-19: Immunothrombosis and Beyond
Zhu, Y., Chen, X., & Liu, X. (2022) · Frontiers in Immunology · doi:10.3389/fimmu.2022.838011 · Cited by 180
Chakraborty, C., Sharma, A. R., Bhattacharya, M., & Lee, S. (2022) · Frontiers in Immunology · doi:10.3389/fimmu.2022.801522 · Cited by 154
Molecular pathways involved in COVID-19 and potential pathway-based therapeutic targets
Farahani, M., Niknam, Z., Amirabad, L. M., Dashatan, N. A., Koushki, M., Nemati, M., Pouya, F. D., Rezaei–Tavirani, M., Rasmi, Y., & Tayebi, L. (2021) · Biomedicine & Pharmacotherapy · doi:10.1016/j.biopha.2021.112420 · Cited by 126
Kouwaki, T., Nishimura, T., Wang, G., & Oshiumi, H. (2021) · Frontiers in Immunology · doi:10.3389/fimmu.2021.700926 · Cited by 113
The role of type I interferon in the treatment of COVID‐19
Sodeifian, F., Nikfarjam, M., Kian, N., Mohamed, K., & Rezaei, N. (2021) · Journal of Medical Virology · doi:10.1002/jmv.27317 · Cited by 85
Animal models for SARS‐CoV‐2 research: A comprehensive literature review
Pandey, K., Acharya, A., Mohan, M., Ng, C. L., Reid, S. P., & Byrareddy, S. N. (2020) · Transboundary and Emerging Diseases · doi:10.1111/tbed.13907 · Cited by 82
The temporal progression of lung immune remodeling during breast cancer metastasis
McGinnis, C. S., Miao, Z., Superville, D. A., Yao, W., Goga, A., Reticker-Flynn, N. E., Winkler, J., & Satpathy, A. T. (2024) · Cancer Cell · doi:10.1016/j.ccell.2024.05.004 · Cited by 80
Hautz, T., Salcher, S., Fodor, M., Sturm, G., Ebner, S., Mair, A., Trebo, M., Untergasser, G., Sopper, S., Cardini, B., et al. (2023) · Nature Communications · doi:10.1038/s41467-023-37674-8 · Cited by 74
LaSalle, T. J., Gonye, A. L. K., Freeman, S. S., Kapłonek, P., Gushterova, I., Kays, K. R., Manakongtreecheep, K., Tantivit, J., Rojas-López, M., Russo, B. C., et al. (2021) · Cell Reports Medicine · doi:10.1016/j.xcrm.2022.100779 · Cited by 71
Immunosenescence and inflamm-ageing in COVID-19
Zinatizadeh, M. R., Zarandi, P. K., Ghiasi, M., Kooshki, H., Mohammadi, M., Amani, J., & Rezaei, N. (2022) · Ageing Research Reviews · doi:10.1016/j.arr.2022.101818 · Cited by 69
Programmed cell death: the pathways to severe COVID-19?
Bader, S. M., Cooney, J. P., Pellegrini, M., & Doerflinger, M. (2022) · Biochemical Journal · doi:10.1042/bcj20210602 · Cited by 55
Immunopathology and Immunopathogenesis of COVID-19, what we know and what we should learn
Shahgolzari, M., Yavari, A., Arjeini, Y., Miri, S. M., Darabi, A., Nejad, A. S. M., & Keshavarz, M. (2021) · Gene Reports · doi:10.1016/j.genrep.2021.101417 · Cited by 50
Myeloid cell interferon responses correlate with clearance of SARS-CoV-2
Singh, D. K., Aladyeva, E., Das, S., Singh, B., Esaulova, E., Swain, A., Ahmed, M., Cole, J., Moodley, C., Mehra, S., et al. (2022) · Nature Communications · doi:10.1038/s41467-022-28315-7 · Cited by 47
Self-citationIsraeli, M., Finkel, Y., Yahalom-Ronen, Y., Paran, N., Chitlaru, T., Israeli, O., Cohen-Gihon, I., Aftalion, M., Falach, R., Rotem, S., et al. (2022) · Nature Communications · doi:10.1038/s41467-022-29896-z · Cited by 46
Hyperactive immature state and differential CXCR2 expression of neutrophils in severe COVID-19
Rice, C. M., Lewis, P. A., Ponce-Garcia, F. M., Gibbs, W., Groves, S., Cela, D., Hamilton, F., Arnold, D., Hyams, C. J., Oliver, E., et al. (2022) · Life Science Alliance · doi:10.26508/lsa.202201658 · Cited by 46
Gour, N., Yong, H. M., Magesh, A., Atakkatan, A., Andrade, F., Lajoie, S., & Dong, X. (2024) · Immunity · doi:10.1016/j.immuni.2024.01.003 · Cited by 43
Type I Interferon-Mediated Regulation of Antiviral Capabilities of Neutrophils
Stegelmeier, A. A., Darzianiazizi, M., Hanada, K., Sharif, S., Wootton, S. K., Bridle, B. W., & Karimi, K. (2021) · International Journal of Molecular Sciences · doi:10.3390/ijms22094726 · Cited by 41
Cumplido-Laso, G., Benitez, D. A., Mulero‐Navarro, S., & Carvajal-González, J. M. (2023) · International Journal of Molecular Sciences · doi:10.3390/ijms241914789 · Cited by 36
SARS-CoV-2 immunity in animal models
Chen, Z., Yuan, Y., Hu, Q., Zhu, A., Chen, F., Li, S., Guan, X., Lv, C., Tang, T., He, Y., et al. (2024) · Cellular and Molecular Immunology · doi:10.1038/s41423-023-01122-w · Cited by 39
Abyadeh, M., Mirshahvaladi, S., Kashani, S. A., Paulo, J. A., Amirkhani, A., Mehryab, F., Seydi, H., Moradpour, N., Jodeiryjabarzade, S., Mirzaei, M., et al. (2024) · Journal of Extracellular Biology · doi:10.1002/jex2.159 · Cited by 37
The Notch Pathway: A Link Between COVID-19 Pathophysiology and Its Cardiovascular Complications
Breikaa, R. M., & Lilly, B. (2021) · Frontiers in Cardiovascular Medicine · doi:10.3389/fcvm.2021.681948 · Cited by 35
The role of dendritic cells in COVID-19 infection
Wang, X., Guan, F., Miller, H. I., Byazrova, M. G., Candotti, F., Benlagha, K., Câmara, N. O. S., Lei, J., Filatov, A. V., & Liu, C. (2023) · Emerging Microbes & Infections · doi:10.1080/22221751.2023.2195019 · Cited by 34
Age-related differences in immune dynamics during SARS-CoV-2 infection in rhesus macaques
Speranza, E. E., Purushotham, J. N., Port, J. R., Schwarz, B. H., Flagg, M., Williamson, B. N., Feldmann, F., Singh, M., Pérez-Pérez, L., Sturdevant, G. L., et al. (2022) · Life Science Alliance · doi:10.26508/lsa.202101314 · Cited by 29
COVID-19 Research: Lessons from Non-Human Primate Models
Albrecht, L., Bishop, E., Jay, B., Lafoux, B., Minoves, M., & Passaes, C. (2021) · Vaccines · doi:10.3390/vaccines9080886 · Cited by 30
Ahmadi, E., Bagherpour, Z., Zarei, E., & Omidkhoda, A. (2022) · Pathology - Research and Practice · doi:10.1016/j.prp.2022.153782 · Cited by 29
Comparing the Cytokine Storms of COVID-19 and Pandemic Influenza
Pacheco-Hernández, L. M., Ramírez-Noyola, J. A., Gómez-García, I. A., Ignacio-Cortés, S., Zúñiga, J., & Choreño-Parra, J. A. (2022) · Journal of Interferon & Cytokine Research · doi:10.1089/jir.2022.0029 · Cited by 29
Self-citationInfection and Immune Memory: Variables in Robust Protection by Vaccines Against SARS-CoV-2
Ahluwalia, P. K., Vaibhav, K., Ahluwalia, M., Mondal, A. K., Sahajpal, N., Rojiani, A. M., & Kolhe, R. B. (2021) · Frontiers in Immunology · doi:10.3389/fimmu.2021.660019 · Cited by 25
Overview of Nonhuman Primate Models of SARS-CoV-2 Infection
Trichel, A. M. (2021) · Comparative Medicine · doi:10.30802/aalas-cm-20-000119 · Cited by 28
Neutrophil subsets and their differential roles in viral respiratory diseases
Zhang, Y., Wang, Q., Mackay, C. R., Ng, L. G., & Kwok, I. (2022) · Journal of Leukocyte Biology · doi:10.1002/jlb.1mr1221-345r · Cited by 26
Immunotherapy in the context of sepsis-induced immunological dysregulation
Wu, Y., Wang, L., Li, Y., Cao, Y., Wang, M., Deng, Z., & Kang, H. (2024) · Frontiers in Immunology · doi:10.3389/fimmu.2024.1391395 · Cited by 27
Brechbühl, J., Lopes, A. C., Wood, D., Bouteiller, S., de Vallière, A., Verdumo, C., & Broillet, M.-C. (2021) · Communications Biology · doi:10.1038/s42003-021-02410-9 · Cited by 21
Baindara, P., Sarker, M. B., Earhart, A., Mandal, S. M., & Schrum, A. G. (2022) · Frontiers in Cellular and Infection Microbiology · doi:10.3389/fcimb.2022.928704 · Cited by 21
McClune, M. E., Ebohon, O., Dressler, J. M., Davis, M. M., Tupik, J. D., Lochhead, R. B., Booth, C. J., Steere, A. C., & Jutras, B. L. (2025) · Science Translational Medicine · doi:10.1126/scitranslmed.adr2955 · Cited by 21
Enriquez, A. B., Sia, J. K., Dkhar, H. K., Goh, S. L., Quezada, M. J., Stallings, K. L., & Rengarajan, J. (2021) · iScience · doi:10.1016/j.isci.2022.104305 · Cited by 23
The role of neutrophils in chorioamnionitis
Zhang, C., Cao, J., Xu, M., Wu, D., Li, W., & Chang, Y. (2023) · Frontiers in Immunology · doi:10.3389/fimmu.2023.1198831 · Cited by 22
Ethanol Consumption Induces Nonspecific Inflammation and Functional Defects in Alveolar Macrophages
Lewis, S. A., Doratt, B. M., Sureshchandra, S., Jankeel, A., Newman, N., Shen, W., Grant, K. A., & Messaoudi, I. (2022) · American Journal of Respiratory Cell and Molecular Biology · doi:10.1165/rcmb.2021-0346oc · Cited by 17
Schoberleitner, I., Faserl, K., Tripp, C. H., Pechriggl, E. J., Sigl, S., Brunner, A., Zelger, B. G., Hermann‐Kleiter, N., Baier, L., Steinkellner, T., et al. (2024) · Frontiers in Immunology · doi:10.3389/fimmu.2024.1342895 · Cited by 17
Mucosal immune responses in COVID19 - a living review
Pearson, C. F., Jeffery, R., Ahern, D., Almuttaqi, H., Alonzi, D. S., Alrubayyi, A., Alsaleh, G., Bart, V. M. T., Batchelor, V., Bayliss, R., et al. (2021) · Oxford Open Immunology · doi:10.1093/oxfimm/iqab002 · Cited by 16
Pham, T. L., He, J., Kakazu, A. H., Calandria, J. M., Do, K. V., Nshimiyimana, R., Lam, T. F., Petasis, N. A., Bazán, H. E. P., & Bazan, N. G. (2021) · Scientific Reports · doi:10.1038/s41598-021-92293-x · Cited by 25
COVID-19 and fibrosis: Mechanisms, clinical relevance, and future perspectives
Saifi, M. A., Bansod, S., & Godugu, C. (2022) · Drug Discovery Today · doi:10.1016/j.drudis.2022.103345 · Cited by 15
Assessing the potential relevance of CEACAM6 as a blood transcriptional biomarker
Rinchai, D., & Chaussabel, D. (2022) · F1000Research · doi:10.12688/f1000research.126721.1 · Cited by 14
Mary, A., Hénaut, L., Macq, P.-Y., Badoux, L., Cappe, A., Porée, T., Eckes, M., Dupont, H., & Brazier, M. (2020) · Frontiers in Pharmacology · doi:10.3389/fphar.2020.592543 · Cited by 14
Antiviral response and immunopathogenesis of interleukin 27 in COVID-19
Valdés‐López, J. F., & Inchima, S. U. (2023) · Archives of Virology · doi:10.1007/s00705-023-05792-9 · Cited by 15
Morphologically intact airways in lung fibrosis have an abnormal proteome
Herrera, J. A., Dingle, L. A., Monetero, M. A., Venkateswaran, R. V., Blaikley, J. F., Granato, F., Pearson, S., Lawless, C., & Thornton, D. J. (2023) · Respiratory Research · doi:10.1186/s12931-023-02400-x · Cited by 12
Ghimire, R., Shrestha, R., Amaradhi, R., Patton, T., Whitley, C., Chanda, D., Liu, L., Ganesh, T., More, S., & Channappanavar, R. (2025) · Journal of Virology · doi:10.1128/jvi.01668-24 · Cited by 13
Coburn, M., Eskandari‐Sedighi, G., Hasselmann, J., England, W., Shabestari, S. K., Mansour, K., McQuade, A., Mgerian, M., Chadarevian, J. P., Tu, C. H., et al. (2025) · Alzheimer s & Dementia · doi:10.1002/alz.70930 · Cited by 11
Mortazavi‐Jahromi, S. S., & Aslani, M. (2022) · International Immunopharmacology · doi:10.1016/j.intimp.2022.109040 · Cited by 13
Anti-cancer Peptide Recognition Based on Grouped Sequence and Spatial Dimension Integrated Networks
You, H., Yu, L., Tian, S., Ma, X., Xing, Y., Song, J., & Wu, W. (2021) · Interdisciplinary Sciences Computational Life Sciences · doi:10.1007/s12539-021-00481-0 · Cited by 11
Comparative Pathogenesis of Severe Acute Respiratory Syndrome Coronaviruses
Zhang, J., Rissmann, M., Kuiken, T., & Haagmans, B. L. (2023) · Annual Review of Pathology Mechanisms of Disease · doi:10.1146/annurev-pathol-052620-121224 · Cited by 10
Hossain, M. A., Sohel, M., Sultana, T., Hasan, M. I., Khan, M. S., Kibria, K. M. K., Mahmud, S. M. H., & Rahman, M. H. (2023) · Informatics in Medicine Unlocked · doi:10.1016/j.imu.2023.101289 · Cited by 10
The Role of Neutrophil in COVID-19 — Positive or Negative
Rong, N., Wei, X., & Liu, J. (2024) · Journal of Innate Immunity · doi:10.1159/000535541 · Cited by 11
Li, C., Xiao, N., Song, W., Lam, A. H.-C., Liu, F., Cui, X., Ye, Z., Chen, Y., Ren, P., Cai, J., et al. (2024) · EBioMedicine · doi:10.1016/j.ebiom.2024.105363 · Cited by 9
Understanding COVID-19: From Dysregulated Immunity to Vaccination Status Quo
Escobedo, R. A., Singh, D. K., & Kaushal, D. (2021) · Frontiers in Immunology · doi:10.3389/fimmu.2021.765349 · Cited by 10
Self-citationFuzo, C. A., Fraga‐Silva, T. F. D. C., Maruyama, S. R., Bastos, V. A. F., Rogerio, L. A., Takamiya, N. T., Silva-Neto, P. V. D., Pimentel, V. E., Toro, D. M., Pérez, M. M., et al. (2023) · Immunology · doi:10.1111/imm.13631 · Cited by 9
Developing dendritic cell for SARS-CoV-2 vaccine: Breakthrough in the pandemic
Jonny, J., Putranto, T. A., Irfon, R., & Sitepu, E. C. (2022) · Frontiers in Immunology · doi:10.3389/fimmu.2022.989685 · Cited by 13
Sundar, S., Piramanayagam, S., & Natarajan, J. (2022) · Virus Genes · doi:10.1007/s11262-022-01898-5 · Cited by 8
COVID‐19 case fatality rate and tuberculosis in a metropolitan setting
Rojas-Bolívar, D., Intimayta‐Escalante, C., Cardenas‐Jara, A., Jandarov, R., & Huaman, M. A. (2021) · Journal of Medical Virology · doi:10.1002/jmv.26868 · Cited by 8
Sen, P., & Kaur, H. (2022) · Human Gene · doi:10.1016/j.humgen.2022.201135 · Cited by 7
Bay, P., Rodriguez, C., Caruso, S., Démontant, V., Boizeau, L., Soulier, A., Woerther, P., Dessap, A. M., Pawlotsky, J., de Prost, N., et al. (2023) · Journal of Medical Virology · doi:10.1002/jmv.29268 · Cited by 7
Lei, H. (2024) · Viruses · doi:10.3390/v16020201 · Cited by 7
Proteomic and Metabolomic Characterization of SARS-CoV-2-Infected Cynomolgus Macaque at Early Stage
Wang, T., Miao, F., Lv, S., Li, L., Feng, W., Hou, L., Sun, R., Li, W., Zhang, J., Zhang, C., et al. (2022) · Frontiers in Immunology · doi:10.3389/fimmu.2022.954121 · Cited by 7
Systematic analysis of alternative splicing in time course data using Spycone
Lio, C. T., Grabert, G., Louadi, Z., Fenn, A. M., Baumbach, J., Kacprowski, T., List, M., & Tsoy, O. V. (2022) · Bioinformatics · doi:10.1093/bioinformatics/btac846 · Cited by 7
Pesenti, L., Formiga, R. D. O., Tamassia, N., Gardiman, E., de la Héronnière, F. C., Gasperini, S., Chicher, J., Kühn, L., Hammann, P., Gall, M. L., et al. (2025) · Journal of Innate Immunity · doi:10.1159/000543633 · Cited by 6
Najjar, R., Rogel, N., Pineda, J. M. B., Wang, X., Tran, M., Bays, A. M., & Mustelin, T. (2024) · Lupus Science & Medicine · doi:10.1136/lupus-2023-001059 · Cited by 6
Peter, A. E., Sandeep, B. V., Rao, B. G., & Kalpana, V. L. (2021) · Frontiers in Nanotechnology · doi:10.3389/fnano.2021.644023 · Cited by 7
Animal Models of COVID-19: Nonhuman Primates
Singh, D. K., Cole, J., Escobedo, R. A., Alfson, K. J., Singh, B., Lee, T., Alvarez, X. A., Ganatra, S., Carrion, R., & Kaushal, D. (2022) · Methods in molecular biology · doi:10.1007/978-1-0716-2111-0_15 · Cited by 5
Self-citationFan, S., He, X., Zhu, Z., Chen, L., Zou, Y., Chen, Z., Yu, J., Chen, W., Guan, H., & Ma, J. (2023) · Cell & Bioscience · doi:10.1186/s13578-023-01047-x · Cited by 5
Abyadeh, M., Yadav, V. K., & Kaya, A. (2023) · Journal of Alzheimer s Disease · doi:10.3233/jad-230684 · Cited by 4
The Temporal Progression of Immune Remodeling During MetastasisPreprint
McGinnis, C. S., Miao, Z., Reticker-Flynn, N. E., Winkler, J., & Satpathy, A. T. (2023) · bioRxiv (Cold Spring Harbor Laboratory) · doi:10.1101/2023.05.04.539153 · Cited by 5
17β-estradiol inhibits Notch1 activation in murine macrophage cell line RAW 264.7
Severi, P., Ascierto, A., Marracino, L., Talla, A. W. O., Aquila, G., Martino, V., Dalessandro, F., Scarpante, I., Minghini, G., Haffreingue, L., et al. (2024) · Molecular Biology Reports · doi:10.1007/s11033-024-10058-x · Cited by 4
Chen, M., Zhu, W., Chen, Y., Shang, J., Wang, W., Yan, X., Liu, P., & Zhou, Y. (2025) · European Journal of Histochemistry · doi:10.4081/ejh.2025.4228 · Cited by 4
NK cells modulate in vivo control of SARS-CoV-2 replication and suppression of lung damage
Balachandran, H., Kroll, K. W., Terry, K., Manickam, C., Jones, R. A., Woolley, G., Hayes, T., Martinot, A. J., Sharma, A., Lewis, M. G., et al. (2024) · PLoS Pathogens · doi:10.1371/journal.ppat.1012439 · Cited by 5
Assessing the potential relevance of CEACAM6 as a blood transcriptional biomarker
Rinchai, D., & Chaussabel, D. (2024) · F1000Research · doi:10.12688/f1000research.126721.2 · Cited by 4
Garcia‐Vilanova, A., Allué‐Guardia, A., Chacon, N. M., Akhter, A., Singh, D. K., Kaushal, D., Restrepo, B. I., Schlesinger, L. S., Turner, J., Weintraub, S. T., et al. (2024) · GeroScience · doi:10.1007/s11357-024-01264-3 · Cited by 3
Self-citationCrosstalk Between Coagulopathy and Inflammation in Obesity-Related Severe COVID-19 Infection
Talebabadi, N., Tohit, E. R. M., Abdullah, M., Zahari-Sham, S. Y., Zailan, N. F. Z., Nordin, S. A., Ismail, I. Z., Gazali, A. M., & Hassan, M. (2025) · Hemato · doi:10.3390/hemato6010004 · Cited by 2
Gérardin, P., Santos, R. M., Clerc, S. L., Bruneau, L., Maillot, A., Labib, T., Rahmouni, M., Spadoni, J., Meyniel, J.-P., Cornet, C., et al. (2025) · Travel Medicine and Infectious Disease · doi:10.1016/j.tmaid.2025.102825 · Cited by 2
Bridges, K., Awany, D., Gela, A., Mwambene, T.-D., Kurtz, S. L., Baker, R. E., Elkins, K. L., Sassetti, C. M., Scriba, T. J., & Lauffenburger, D. A. (2025) · JCI Insight · doi:10.1172/jci.insight.194450 · Cited by 2
Jang, E.-A., Han, H.-J., Tin, T. D., Cho, E., Lee, S., & Kwak, S. H. (2023) · Journal of Experimental & Biomedical Sciences/Biomedical Science Letters · doi:10.15616/bsl.2023.29.4.211 · Cited by 2
Israeli, M., Finkel, Y., Yahalom-Ronen, Y., Paran, N., Chitlaru, T., Israeli, O., Cohen-Gihon, I., Aftalion, M., Falach, R., Elia, U., et al. (2021) · bioRxiv (Cold Spring Harbor Laboratory) · doi:10.1101/2021.07.19.452809 · Cited by 2
Genetic variant in the AGT gene (rs699-GG) is associated with severe COVID-19 in Brazilian patients
Farias, P. C. S., Cabral, L. P., Neves, P. A. F., Januário, C. A. B., Cordeiro, B. M. P. C., da Silva, J. W., BASEGGIO, C., Júnior, S. D. S. L. P., de Araújo, P. S. R., de Lorena, V. M. B., et al. (2024) · Anais da Academia Brasileira de Ciências · doi:10.1590/0001-3765202420240274 · Cited by 1
Acute respiratory viral infections in monkeys
Dogadov, D. I., Kyuregyan, K. K., Артурович, М. А., Михайловна, Г. А., Викторовна, Ш. Е., & Михайлов, М. И. (2025) · Problems of Virology · doi:10.36233/0507-4088-293 · Cited by 1
Gunasekara, S., Shatnawi, S., More, S., Ludwig, B., Narayanan, S. S., Selvan, M. T., Miller, C., & Rudd, J. M. (2025) · Frontiers in Immunology · doi:10.3389/fimmu.2025.1547918 · Cited by 1
Cardoso, R. D. C., de Matos, M. D., Duarte, L., Guimenes, B. D., Pavani, G. K., Gutman, E. G., Ferreira, H. F. A., Pereira, V. C. S. R., Domingues, V. B., Farinhas, J. G. D., et al. (2025) · Multiple Sclerosis and Related Disorders · doi:10.1016/j.msard.2025.106912 · Cited by 1
Adıgüzel, Y., & Shoenfeld, Y. (2023) · Elsevier eBooks · doi:10.1016/b978-0-443-18566-3.00017-7 · Cited by 1
Lou, S., Li, T., & Gerstein, M. (2021) · bioRxiv (Cold Spring Harbor Laboratory) · doi:10.1101/2021.12.05.471290
Xu, R., Zong, Y., Lin, Y., Liu, Z., Zhang, Z., & Kuang, X. (2022) · Research Square · doi:10.21203/rs.3.rs-1308161/v1
The innate immune response to SARS-CoV-2
Takashima, K., & Oshiumi, H. (2021) · Uirusu · doi:10.2222/jsv.71.33
scSniper: Single-cell Deep Neural Network-based Identification of Prominent BiomarkersPreprint
Li, M., Chen, Y., & Ding, J. (2023) · bioRxiv (Cold Spring Harbor Laboratory) · doi:10.1101/2023.11.22.568389
Li, C., Xiao, N., Song, W., Lam, A. H.-C., Liu, F., Cui, X., Ye, Z., Chen, Y., Ren, P., Cai, J., et al. (2024) · bioRxiv (Cold Spring Harbor Laboratory) · doi:10.1101/2024.05.13.593878
Wen, C., Yang, D., Guo, H., Dong, C., Peng, Q., Zhao, J., Wang, R., Li, Y., Li, Y., Yang, S., et al. (2024) · Research Square · doi:10.21203/rs.3.rs-4964121/v1
Zou, H., Huang, C., Feng, Q., Yu, B., Liu, J., Shu, X., Nie, X., Zhang, H., & Zou, X. (2024) · Frontiers in Genetics · doi:10.3389/fgene.2024.1483098
Aging changes the underlying mechanism of JAK2 modulation in neutrophil functionPreprint
Feldmann, J. W., Kays, M., McGinnis, F., Herron, E., Sati, N., Woods, C., & Coulibaly, A. P. (2025) · bioRxiv (Cold Spring Harbor Laboratory) · doi:10.1101/2025.04.21.649782
Inflammaging, Neuroinflammation, and Synaptic Damage in Alzheimer's Disease
Carnevale, L. N., & Lipton, S. A. (2025) · Elsevier eBooks · doi:10.1016/b978-0-323-95702-1.00491-7
COVID-19 Vaccines Development: Challenges and Future Perspective
Chowdhury, S. K., Mridha, N. K., Khan, A. A., Baildya, N., Mandal, M., & Ghosh, N. N. (2025) · International Journal of Clinical Virology · doi:10.29328/journal.ijcv.1001064
Aging changes the mechanism that underlies JAK2 modulation of neutrophil function
Feldmann, J. W., Kays, M., McGinnis, F., Herron, E., Sati, N., Woods, C., & Coulibaly, A. P. (2025) · The Journal of Immunology · doi:10.1093/jimmun/vkaf323
Metadata
- Authors
- Rosa, B. A., Ahmed, M., Singh, D. K., Choreño-Parra, J. A., Cole, J., Jiménez-Álvarez, L. A., Rodríguez-Reyna, T. S., Singh, B., Gonzalez, O., Carrion, R., Schlesinger, L. S., Martin, J., Zúñiga, J., Mitreva, M., Kaushal, D., & Khader, S. A.
- Affiliations
- Washington University in St. Louis (US)
- Texas Biomedical Research Institute (US)
- Instituto Nacional de Enfermedades Respiratorias (MX)
- Corresponding author
- Mitreva, Makedonka
- Kaushal, Deepak
- Khader, Shabaana A.
- ORCID
- Venue
- Communications Biology
- Published
- 2021-03-05
- Volume
- 4
- Issue
- 1
- Pages
- 290-290
- ISSN
- 2399-3642 (ISSN-L)
- PMC
- PMC7935909
- OpenAlex
- W3135408003
- Cited by
- 106
- References
- 87
- Citations by year
- 2026: 3 · 2025: 16 · 2024: 19 · 2023: 18 · 2022: 25 · 2021: 21
- FWCI
- 6.57
- Type
- journal article
- Language
- en
- Open access
- gold
- doi.org
- Locations
- Communications Biology (publishedVersion, cc-by)
- bioRxiv (Cold Spring Harbor Laboratory) (acceptedVersion, cc-by-nc-nd)
- PubMed Central (publishedVersion, cc-by)
- PubMed (publishedVersion)
- PubMed Central (submittedVersion, cc-by-nc-nd)
- DOAJ (DOAJ: Directory of Open Access Journals) (submittedVersion, cc-by-sa)
- Greater South Information System
- Funders
- U.S. Department of Health and Human Services (HHSO100201700020C)
- Washington University in St. Louis
- Regeneron Pharmaceuticals
- Texas Biomedical Research Institute
- Consejo Nacional de Ciencia y Tecnología (FORDECYT/10SE/2020/05/14-06, FORDECYT/10SE/2020/05/14-07, CVU-737347)
- Institute of Nuclear Energy Research
- Secretaría de Estado de Ciencia, Tecnología e Innovación
- National Institutes of Health (P51OD011103, P51 OD111033, COVID-19, U42OD010442, P51OD011133)
- DHHS Office of the Secretary
- Biomedical Advanced Research and Development Authority (HHSO100201700020C)
- National Institute of Allergy and Infectious Diseases (R01AI134236, R01AI123780)
- Topics
- Health Sciences › Medicine › Infectious Diseases › SARS-CoV-2 and COVID-19 Research
- Health Sciences › Medicine › Infectious Diseases › COVID-19 Clinical Research Studies
- Life Sciences › Immunology and Microbiology › Immunology › interferon and immune responses
- Keywords
- SARS-CoV-2, COVID-19 pandemic, interferon signaling, neutrophil degranulation, lung transcriptome, rhesus macaque model, age-related susceptibility, type I interferon, Notch signaling, innate immunity, collagen synthesis, neutrophil-to-lymphocyte ratio, immunopathogenesis
About these checks
Registry, retraction, Cites and statistics results are computed, not judged, with one exception: a printed reference that no index lists is read once by a model before it counts as a citation error. Claims are extracted by a model and kept only when their quote appears verbatim in the text; each cited source is then checked, with a model’s help, for whether it says what the claim relies on. Those verdicts can be wrong — read the claim’s quote and the cited source before relying on one.
Statistics and arithmetic are recomputed, not judged.
Confidence bands are shown only for fields calibrated on our annotated test set. None is calibrated yet, so no band is shown.
What counts as a claim ›How we measure confidence ›How we check this ›
Are you an author, or do you see a problem with this page? Request a review
