Student or educator? Sign up with your school email and get 6 months of Pro free.
Cited by 5Cancer Genomics and DiagnosticsCellular Mechanics and InteractionsProtein Kinase Regulation and GTPase Signaling

The DOI matches its Crossref record; 109 of the 109 references it cites were found in a registry or an index.

Pan-cancer analyses suggest kindlin-associated global mechanochemical alterations

Open access

Published version of a preprint

Abstract

Kindlins serve as mechanosensitive adapters, transducing extracellular mechanical cues to intracellular biochemical signals and thus, their perturbations potentially lead to cancer progressions. Despite the kindlin involvement in tumor development, understanding their genetic and mechanochemical characteristics across different cancers remains elusive. Here, we thoroughly examined genetic alterations in kindlins across more than 10,000 patients with 33 cancer types. Our findings reveal cancer-specific alterations, particularly prevalent in advanced tumor stage and during metastatic onset. We observed a significant co-alteration between kindlins and mechanochemical proteome in various tumors through the activation of cancer-related pathways and adverse survival outcomes. Leveraging normal mode analysis, we predicted structural consequences of cancer-specific kindlin mutations, highlighting potential impacts on stability and downstream signaling pathways. Our study unraveled alterations in epithelial–mesenchymal transition markers associated with kindlin activity. This comprehensive analysis provides a resource for guiding future mechanistic investigations and therapeutic strategies targeting the roles of kindlins in cancer treatment.

Overview

The claims and statistics of this paper haven’t been checked yet.

Run the check — free, no account needed. It reads the open-access text and checks the sources it cites.

A few free checks a day · papers already verified open instantly · results are public

Integrity signals

Registry

Crossref · 10.1038/s42003-024-06044-5

Cites

109 of 109 references verified0 citation errors · 0 not checkable

Statistics

Figures

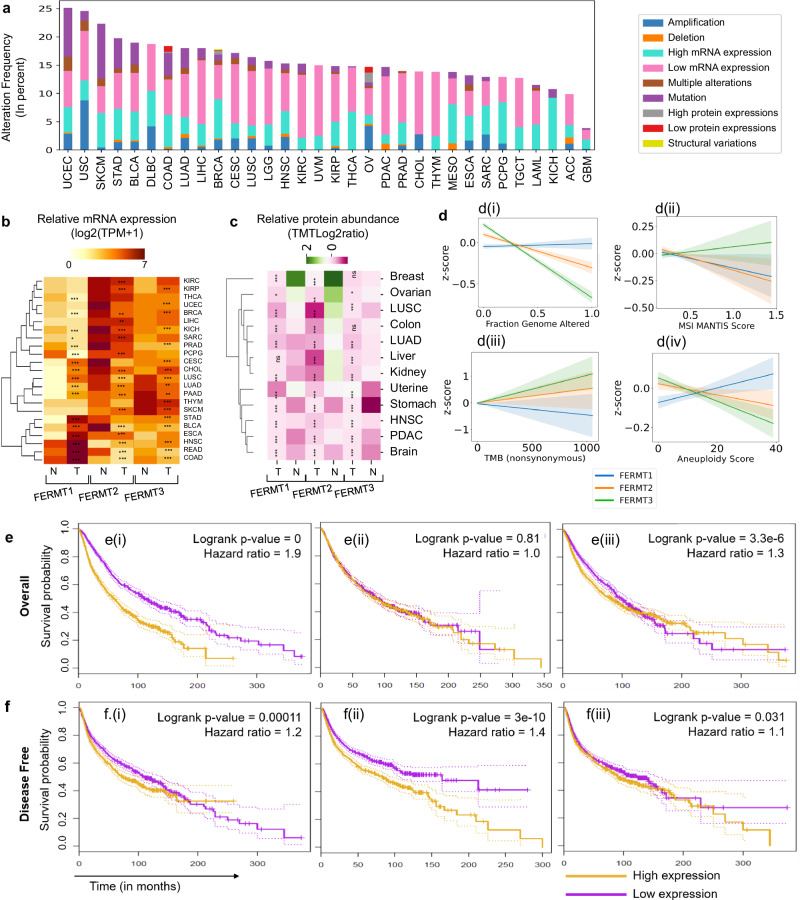
Fig. 1 A comprehensive framework of various alterations in the Kindlin family and their impact on prognostic outcomes across different cancer types. a Frequency of kindlin alterations in patients with various cancer types. The color codes used in the figure correspond to different types of alterations, as visually depicted. b Heatmap representing the comparison of kindlin mRNA expression between normal and tumor samples; the expression scale is log2 (TPM + 1); a darker color represents a more positive mRNA expression level (paired Student’s t test p < 0.05 indicates significance, n = 10953). ***p < 0.0005; **p < 0.005; *p < 0.05; absence of * = no significance; paired pvalues were obtained by Student’s t test. c Heatmap representing the comparison of kindlin protein expression between normal and tumor samples; purple represents overexpression, and green represents underexpression (paired Student’s t test p < 0.05 indicates significance; n = 1272). ***p < 0.0005; **p < 0.005; *p < 0.05; ns = not significant; paired p values were obtained by Student’s t test. d Correlations of genomic parameters with kindlin mRNA expression z scores. The parameters used were d(i) the fraction of the genome altered, d(ii) the MSI MANTIS score, d(iii) the tumor mutation burden (TMB), and d(iv) the aneuploidyscores. Corresponding color shadings indicate 95% CI. e Kaplan‒Mayer plot of patients in the high and low kindlin mRNA expression sample groups according to comparative quartile (0.75–0.25) for OS. e(i) FERMT1 (logrank p value = 0; hazard ratio = 1.9); e(ii) FERMT2 (logrank p = 0.81; hazard ratio = 1); e(iii) FERMT3 (logrank p value, 3.336 × 10⁻⁶; hazard ratio, 1.3). f Kaplan–Mayer plot of the comparative quartile (0.75–0.25) disease-free survival in the high and low kindlin mRNA expression sample groups in the case of f(i) FERMT1 (logrank p = 0.00011; hazard ratio = 1.2); f(ii) FERMT2 (logrank p value, 3.01 × 10⁻¹⁰; hazard ratio, 1.4); f(iii). FERMT3 (logrank p = 0.032; hazard ratio = 1.1). For the high quartile, we set the cutoff at 75%, and for the low quartile, we set the cutoff at 25%. The dotted lines on the survival probability curves represent the 95% confidence intervals.
Fig. 1 A comprehensive framework of various alterations in the Kindlin family and their impact on prognostic outcomes across different cancer types. a Frequency of kindlin alterations in patients with various cancer types. The color codes used in the figure correspond to different types of alterations, as visually depicted. b Heatmap representing the comparison of kindlin mRNA expression between normal and tumor samples; the expression scale is log2 (TPM + 1); a darker color represents a more positive mRNA expression level (paired Student’s t test p < 0.05 indicates significance, n = 10953). ***p < 0.0005; **p < 0.005; *p < 0.05; absence of * = no significance; paired pvalues were obtained by Student’s t test. c Heatmap representing the comparison of kindlin protein expression between normal and tumor samples; purple represents overexpression, and green represents underexpression (paired Student’s t test p < 0.05 indicates significance; n = 1272). ***p < 0.0005; **p < 0.005; *p < 0.05; ns = not significant; paired p values were obtained by Student’s t test. d Correlations of genomic parameters with kindlin mRNA expression z scores. The parameters used were d(i) the fraction of the genome altered, d(ii) the MSI MANTIS score, d(iii) the tumor mutation burden (TMB), and d(iv) the aneuploidyscores. Corresponding color shadings indicate 95% CI. e Kaplan‒Mayer plot of patients in the high and low kindlin mRNA expression sample groups according to comparative quartile (0.75–0.25) for OS. e(i) FERMT1 (logrank p value = 0; hazard ratio = 1.9); e(ii) FERMT2 (logrank p = 0.81; hazard ratio = 1); e(iii) FERMT3 (logrank p value, 3.336 × 10⁻⁶; hazard ratio, 1.3). f Kaplan–Mayer plot of the comparative quartile (0.75–0.25) disease-free survival in the high and low kindlin mRNA expression sample groups in the case of f(i) FERMT1 (logrank p = 0.00011; hazard ratio = 1.2); f(ii) FERMT2 (logrank p value, 3.01 × 10⁻¹⁰; hazard ratio, 1.4); f(iii). FERMT3 (logrank p = 0.032; hazard ratio = 1.1). For the high quartile, we set the cutoff at 75%, and for the low quartile, we set the cutoff at 25%. The dotted lines on the survival probability curves represent the 95% confidence intervals.CC BY · PubMed Central
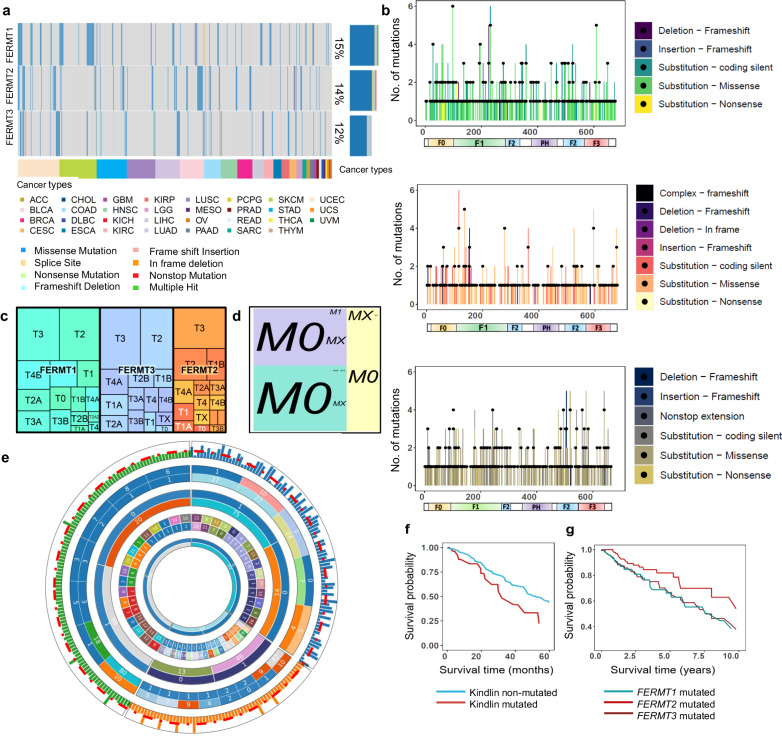
Fig. 2 A comprehensive analysis of Kindlin mutations within the TCGA pancancer cohort. a The mutation frequency, represented as a percentage of samples, for coding mutations in Kindlin across pancancer samples. Different types of mutations are indicated by distinct colors in the respective patient samples, while the colors at the lower horizontal bar represent the specific types of cancer. b The distribution of somatic mutations across all three Kindlins, highlighting the specific types of mutations with corresponding color-coding in patient samples. c, d Tumor stage-specific and metastatic stage-specific mutations in Kindlins, respectively. The size of each quadrilateral and the corresponding text size for the tumor or metastatic stage indicate the extent of the kindlin alterations involved. Each shade corresponds to different kindlins. e Panorama of the effect of noncoding mutations on the kindlin expression profile. Tracks from the inside toward the outside: type of kindlin, cancer type, impact of the mutation, and noncoding mutation type. Comparative plot of Z scores for differentially expressed mutated (noncoding) kindlin transcripts (significance cutoff z score ± 1.96, p < 0.05). Each track consists of two circles, with an inward circle indicating the number of samples per condition and an outward circle indicating the given condition/type. The following conditions are represented by the numbers for each track: track 1 (kindlin name): ‘FERMT1’: 0, ‘FERMT2’: 1; ‘FERMT3’: 2; track 2 (cancer type): Bladder cancer: 0; Blood cancer: 1; Brain cancer: 2; Breast cancer: 3; Breast cancer: 4; Cervical cancer: 5; Colon Cancer: 6; Breast cancer: 7; Endometrial cancer: 8; Gastric cancer: 9; Head and Neck cancer: 10; Liver cancer: 11; Lung cancer: 12; Malignant Lymphoma: 13; Oral cancer: 14; Ovarian cancer: 15; Pancreatic cancer: 16; Pediatric Brain Tumor: 17; Prostate cancer: 18; Rectal cancer: 19; Renal cancer: 20; Renal cancer: 21; Skin cancer: 22; track 3 (mutation type): 3UTR: 0; 5UTR: 1; Downstream: 2; Exon: 3; Intron: 4; Splice Region: 5; Start Gained: 6; Start Lost: 7; Stop Gained: 8; Stop Lost: 9; Upstream: 10; mutation impact: High:For ease of visualization, the expression z scores are rescaled from 0 to 1. The red line passing through the last track indicates a z score = 0. f Comparative survival time versus survival probability curve for the kindlin-mutated and nonmutated sample cohorts. (p = 0.0003, hazard ratio = 1.932). g Comparison of survival versus survival probability curve for patients in the different kindlin-mutated sample cohorts. (Kruskal‒Wallis rank sum p value: FERMT1–FERMT2, 0.0058; FERMT2–FERMT3, 0.0002; FERMT1–FERMT3, 0.2945).
Fig. 2 A comprehensive analysis of Kindlin mutations within the TCGA pancancer cohort. a The mutation frequency, represented as a percentage of samples, for coding mutations in Kindlin across pancancer samples. Different types of mutations are indicated by distinct colors in the respective patient samples, while the colors at the lower horizontal bar represent the specific types of cancer. b The distribution of somatic mutations across all three Kindlins, highlighting the specific types of mutations with corresponding color-coding in patient samples. c, d Tumor stage-specific and metastatic stage-specific mutations in Kindlins, respectively. The size of each quadrilateral and the corresponding text size for the tumor or metastatic stage indicate the extent of the kindlin alterations involved. Each shade corresponds to different kindlins. e Panorama of the effect of noncoding mutations on the kindlin expression profile. Tracks from the inside toward the outside: type of kindlin, cancer type, impact of the mutation, and noncoding mutation type. Comparative plot of Z scores for differentially expressed mutated (noncoding) kindlin transcripts (significance cutoff z score ± 1.96, p < 0.05). Each track consists of two circles, with an inward circle indicating the number of samples per condition and an outward circle indicating the given condition/type. The following conditions are represented by the numbers for each track: track 1 (kindlin name): ‘FERMT1’: 0, ‘FERMT2’: 1; ‘FERMT3’: 2; track 2 (cancer type): Bladder cancer: 0; Blood cancer: 1; Brain cancer: 2; Breast cancer: 3; Breast cancer: 4; Cervical cancer: 5; Colon Cancer: 6; Breast cancer: 7; Endometrial cancer: 8; Gastric cancer: 9; Head and Neck cancer: 10; Liver cancer: 11; Lung cancer: 12; Malignant Lymphoma: 13; Oral cancer: 14; Ovarian cancer: 15; Pancreatic cancer: 16; Pediatric Brain Tumor: 17; Prostate cancer: 18; Rectal cancer: 19; Renal cancer: 20; Renal cancer: 21; Skin cancer: 22; track 3 (mutation type): 3UTR: 0; 5UTR: 1; Downstream: 2; Exon: 3; Intron: 4; Splice Region: 5; Start Gained: 6; Start Lost: 7; Stop Gained: 8; Stop Lost: 9; Upstream: 10; mutation impact: High:For ease of visualization, the expression z scores are rescaled from 0 to 1. The red line passing through the last track indicates a z score = 0. f Comparative survival time versus survival probability curve for the kindlin-mutated and nonmutated sample cohorts. (p = 0.0003, hazard ratio = 1.932). g Comparison of survival versus survival probability curve for patients in the different kindlin-mutated sample cohorts. (Kruskal‒Wallis rank sum p value: FERMT1–FERMT2, 0.0058; FERMT2–FERMT3, 0.0002; FERMT1–FERMT3, 0.2945).CC BY · PubMed Central
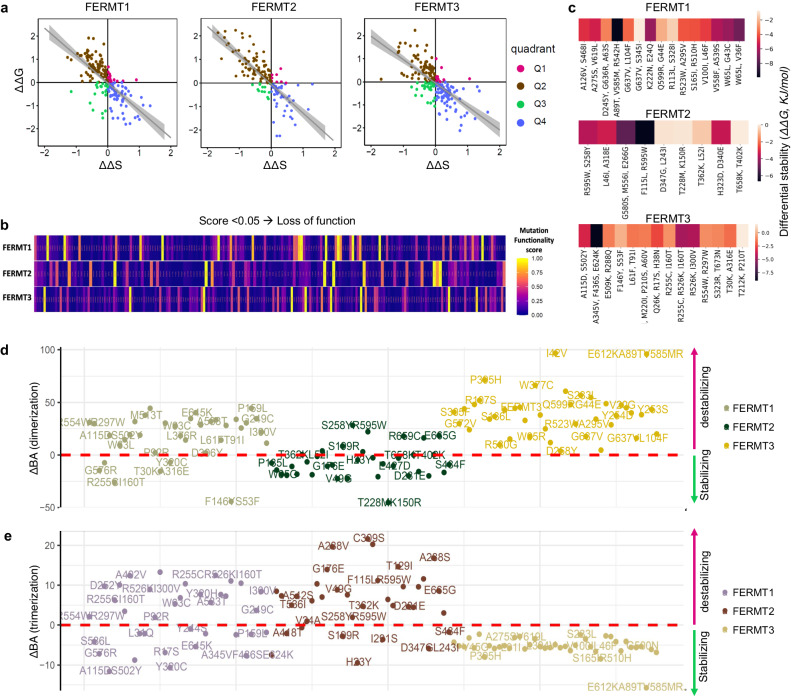
Fig. 3 Assessment of the effect of pancancer missense mutations on the physical properties of kindlins, including single or multiple mutation variants. a ΔΔG vs. ΔΔS plots to evaluate the stability of the mutants in comparison to their flexibility for Kindlin1 (FERMT1), Kindlin2 (FERMT2), and Kindlin3 (FERMT3). The ΔG and ΔΔS values are provided in units of kJ/mol and unitless, respectively. The plots were divided into four quadrants, namely, Q1, Q2, Q3, and Q4, each corresponding to a different mutant population. Q1, represented in pink, signifies an increase in both stability and flexibility. Q2, shown in brown, indicates an increase in stability but a decrease in flexibility. Q3, marked in green, denotes a decrease in both stability and flexibility. Q4, represented in blue, suggested a decrease in stability but an increase in flexibility. Regression lines with 95% confidence intervals are displayed in gray to further illustrate these trends. b Pancancer Kindlin mutants were categorized based on their potential impact on functional activity using the SIFT algorithm. Mutations with values less than 0.05 were classified as loss-of-function mutants, while the remaining mutations were considered neutral mutants.c.Assessment of the effect of the pancancer monomeric structural variants of kindlins on stability compared with that of the wild type using ΔΔG values measured in kJ/mol. d Effect of pancancer mutations on kindlin dimerization affinity compared to that of wild-type structures; calculated as ΔBAdimerization (KJ/mol) and plotted for highly stabilizing or destabilizing mutants. e Effect of pancancer mutations on kindlin trimerization affinity compared to that of wild-type structures; calculated as ΔBAtrimerization (KJ/mol) and plotted for highly stabilizing or destabilizing mutants.
Fig. 3 Assessment of the effect of pancancer missense mutations on the physical properties of kindlins, including single or multiple mutation variants. a ΔΔG vs. ΔΔS plots to evaluate the stability of the mutants in comparison to their flexibility for Kindlin1 (FERMT1), Kindlin2 (FERMT2), and Kindlin3 (FERMT3). The ΔG and ΔΔS values are provided in units of kJ/mol and unitless, respectively. The plots were divided into four quadrants, namely, Q1, Q2, Q3, and Q4, each corresponding to a different mutant population. Q1, represented in pink, signifies an increase in both stability and flexibility. Q2, shown in brown, indicates an increase in stability but a decrease in flexibility. Q3, marked in green, denotes a decrease in both stability and flexibility. Q4, represented in blue, suggested a decrease in stability but an increase in flexibility. Regression lines with 95% confidence intervals are displayed in gray to further illustrate these trends. b Pancancer Kindlin mutants were categorized based on their potential impact on functional activity using the SIFT algorithm. Mutations with values less than 0.05 were classified as loss-of-function mutants, while the remaining mutations were considered neutral mutants.c.Assessment of the effect of the pancancer monomeric structural variants of kindlins on stability compared with that of the wild type using ΔΔG values measured in kJ/mol. d Effect of pancancer mutations on kindlin dimerization affinity compared to that of wild-type structures; calculated as ΔBAdimerization (KJ/mol) and plotted for highly stabilizing or destabilizing mutants. e Effect of pancancer mutations on kindlin trimerization affinity compared to that of wild-type structures; calculated as ΔBAtrimerization (KJ/mol) and plotted for highly stabilizing or destabilizing mutants.CC BY · PubMed Central
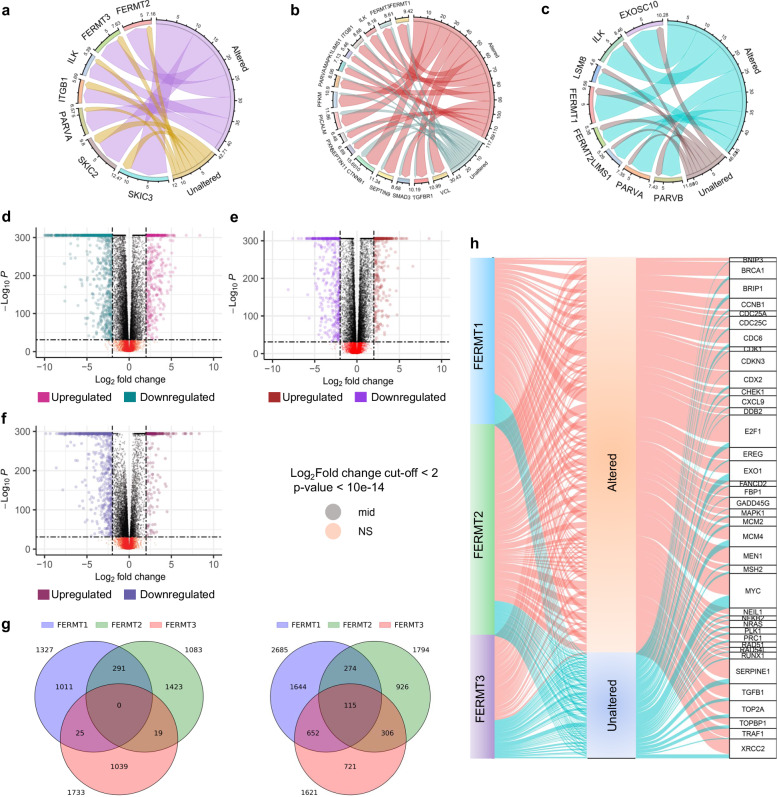
Fig. 4 Coalteration analysis revealing global genomic and specific cancerhallmark differences between the kindlin-altered and unaltered cohorts. The alteration frequencies, expressed as percentages, of direct interactors associated with their corresponding Kindlins in both Kindlin-altered and unaltered cancer samples within theTCGA cohort: FERMT1 (a), FERMT2 (b), and FERMT3 (c). The numbers corresponding to each chord represent the percentage of samples in which respective genes are coaltered. Different colored chords are shown for kindlin altered and unaltered samples in each diagram. Differential gene expression analysis of samples with altered expression compared with unaltered expression for Kindlin 1 (d), Kindlin 2 (e), and Kindlin 3 (f). g Common and uniquely over-expressed (left) and under-expressed (right) genes shown as Venn diagrams for all three kindlins. h Alteration frequencies, represented as percentages, of major cancer hallmark genes from the MsigDB, considering the corresponding kindlin-altered and unaltered cancer samples within the TCGA cohort. The connections between hallmark genes and their status columns are indicated by colored chords, with the width of the chords directly reflecting the number of samples that are either altered or unaltered.
Fig. 4 Coalteration analysis revealing global genomic and specific cancerhallmark differences between the kindlin-altered and unaltered cohorts. The alteration frequencies, expressed as percentages, of direct interactors associated with their corresponding Kindlins in both Kindlin-altered and unaltered cancer samples within theTCGA cohort: FERMT1 (a), FERMT2 (b), and FERMT3 (c). The numbers corresponding to each chord represent the percentage of samples in which respective genes are coaltered. Different colored chords are shown for kindlin altered and unaltered samples in each diagram. Differential gene expression analysis of samples with altered expression compared with unaltered expression for Kindlin 1 (d), Kindlin 2 (e), and Kindlin 3 (f). g Common and uniquely over-expressed (left) and under-expressed (right) genes shown as Venn diagrams for all three kindlins. h Alteration frequencies, represented as percentages, of major cancer hallmark genes from the MsigDB, considering the corresponding kindlin-altered and unaltered cancer samples within the TCGA cohort. The connections between hallmark genes and their status columns are indicated by colored chords, with the width of the chords directly reflecting the number of samples that are either altered or unaltered.CC BY · PubMed Central
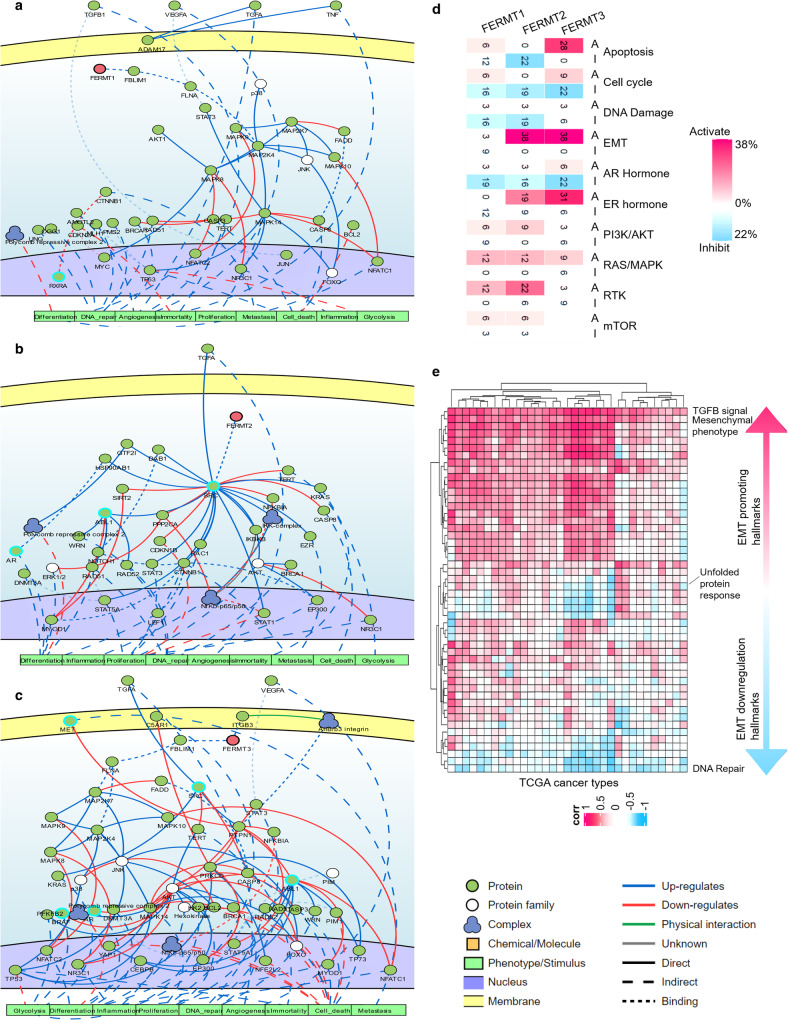
Fig. 5 Integrative pancancer modulation of Kindlin-mediated signaling pathways and their role in shaping cancer hallmarks. a–c Effect of kindlin alterations on pathways contributing to standard cancerhallmarks. The blue arrows denote pathway activation, and the red arrows signify pathway inactivation. a Kindlin1; b Kindlin2; c Kindlin3). d The impact of alterations in Kindlins on signature pathways across the TCGA pancancer cohort. These pathways included the cell cycle progression (CCP), DNA damage response (DDR), epithelial–mesenchymal transition (EMT), androgen receptor (AR), estrogen receptor (ER), and receptor tyrosine kinase pathway (RTK). e The correlation between Kindlin alterations and EMT hallmarks according to the combination of all three Kindlins. This correlation was measured using the Pearson correlation coefficient.
Fig. 5 Integrative pancancer modulation of Kindlin-mediated signaling pathways and their role in shaping cancer hallmarks. a–c Effect of kindlin alterations on pathways contributing to standard cancerhallmarks. The blue arrows denote pathway activation, and the red arrows signify pathway inactivation. a Kindlin1; b Kindlin2; c Kindlin3). d The impact of alterations in Kindlins on signature pathways across the TCGA pancancer cohort. These pathways included the cell cycle progression (CCP), DNA damage response (DDR), epithelial–mesenchymal transition (EMT), androgen receptor (AR), estrogen receptor (ER), and receptor tyrosine kinase pathway (RTK). e The correlation between Kindlin alterations and EMT hallmarks according to the combination of all three Kindlins. This correlation was measured using the Pearson correlation coefficient.CC BY · PubMed Central
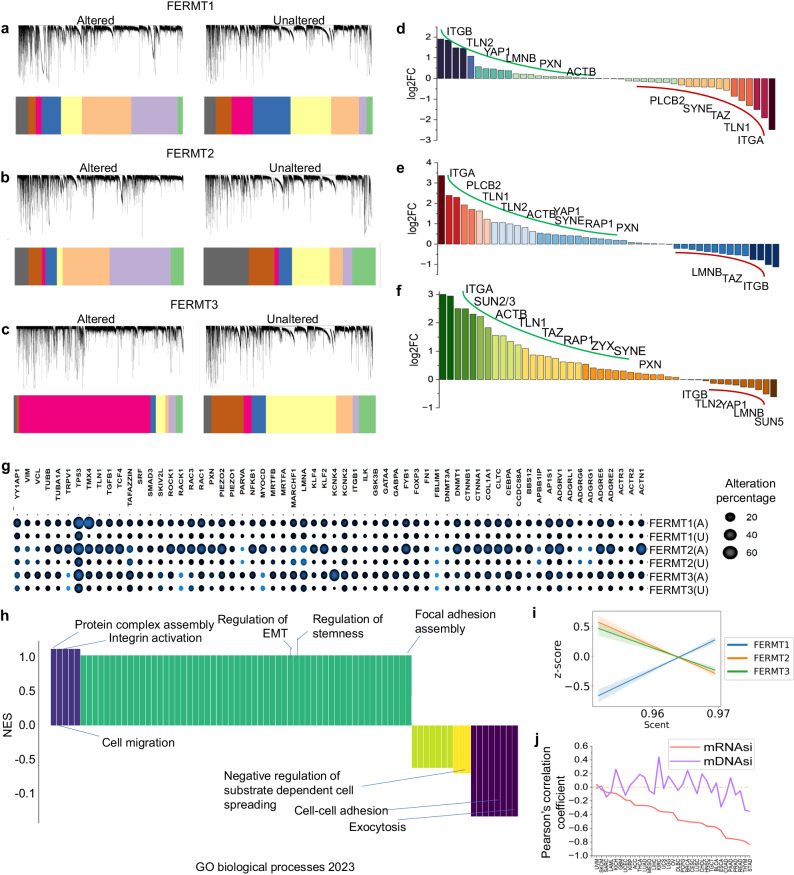
Fig. 6 Effect of Kindlin alteration-induced mechanochemical alterations in the pancancer cohort. a–c Protein‒protein interaction network-based WGCNA of Kindlin altered and unalteredsamples. The clustering dendrogram and expression heatmap of genes identifying the WGCNA modules are shown. Each module is colored separately but modules with similar genes in each plot are depicted using same color. Gene clustering was based on TOM-based dissimilarities. d–f DEseq analysis of mechanosensitive genes in kindlin-altered samples with respect to unaltered samples for kindlin-1 (d), kindlin-2 (e), and kindlin-3 (f). p < 0.005. g Comparative analysis of alteration frequencies, represented as percentages, of major proteins associated with the respective kindlins involved in mechanochemical signaling, considering their respective kindlin-altered and unaltered cancer samples from the TCGA cohort. The size of the circles corresponds to the percentage of altered or unaltered samples, while the colors signify the pvalues, which are provided alongside the image. We considered p values less than 0.05 to indicate statistical significance. h Gene set enrichment analysis of Kindlins in the TCGA pancancer cohort, focusing on GObiological processes. The results are represented by the NES (normalized enrichment score). i Correlations between kindlin alterations and cellular potency (scent) in the pancancer cohort. Corresponding color shadings indicate 95% CI. j The correlation of the mRNAsi- and mDNAsi-based stemness scores with kindlin alterations in the pancancer cohort.
Fig. 6 Effect of Kindlin alteration-induced mechanochemical alterations in the pancancer cohort. a–c Protein‒protein interaction network-based WGCNA of Kindlin altered and unalteredsamples. The clustering dendrogram and expression heatmap of genes identifying the WGCNA modules are shown. Each module is colored separately but modules with similar genes in each plot are depicted using same color. Gene clustering was based on TOM-based dissimilarities. d–f DEseq analysis of mechanosensitive genes in kindlin-altered samples with respect to unaltered samples for kindlin-1 (d), kindlin-2 (e), and kindlin-3 (f). p < 0.005. g Comparative analysis of alteration frequencies, represented as percentages, of major proteins associated with the respective kindlins involved in mechanochemical signaling, considering their respective kindlin-altered and unaltered cancer samples from the TCGA cohort. The size of the circles corresponds to the percentage of altered or unaltered samples, while the colors signify the pvalues, which are provided alongside the image. We considered p values less than 0.05 to indicate statistical significance. h Gene set enrichment analysis of Kindlins in the TCGA pancancer cohort, focusing on GObiological processes. The results are represented by the NES (normalized enrichment score). i Correlations between kindlin alterations and cellular potency (scent) in the pancancer cohort. Corresponding color shadings indicate 95% CI. j The correlation of the mRNAsi- and mDNAsi-based stemness scores with kindlin alterations in the pancancer cohort.CC BY · PubMed Central

Verification

Claims the paper makes

The claims and statistics of this paper haven’t been checked yet.

Run the check — free, no account needed. It reads the open-access text and checks the sources it cites.

A few free checks a day · papers already verified open instantly · results are public

Self-check

Percentages, sums and reported differences re-computed from the paper’s own numbers.

The self-check needs the paper’s full text.

Citations

Cites

Show all 109 references

Metadata

Authors
Chowdhury, D., Mistry, A., Maity, D., Bhatia, R., Priyadarshi, S., Wadan, S., Chakraborty, S., & Haldar, S.
Affiliations
  • S.N. Bose National Centre for Basic Sciences (IN)
  • Ashoka University (IN)
Corresponding author
  • Chowdhury, Debojyoti
  • Haldar, Shubhasis
Venue
Communications Biology
Published
2024-03-28
Volume
7
Issue
1
Pages
372-372
ISSN
2399-3642 (ISSN-L)
OpenAlex
W4393270433
Cited by
5
References
109
Citations by year
2026: 3 · 2025: 1 · 2024: 1
FWCI
1.00
Type
journal article
Language
en
Open access
Licence
Locations
  • Communications Biology (publishedVersion, cc-by)
  • Research Square (acceptedVersion, cc-by)
  • PubMed Central (publishedVersion, cc-by)
  • PubMed (publishedVersion)
  • ePrints Soton (University of Southampton) (acceptedVersion)
  • DOAJ (DOAJ: Directory of Open Access Journals) (submittedVersion, cc-by-sa)
Funders
Department of Biotechnology, Ministry of Science and Technology
Topics
  • Life Sciences › Biochemistry, Genetics and Molecular Biology › Cancer Research › Cancer Genomics and Diagnostics
  • Life Sciences › Biochemistry, Genetics and Molecular Biology › Cell Biology › Cellular Mechanics and Interactions
  • Life Sciences › Biochemistry, Genetics and Molecular Biology › Molecular Biology › Protein Kinase Regulation and GTPase Signaling
Keywords
kindlin, mechanotransduction, cancer, pan-cancer analysis, genetic alterations, metastasis, tumor stage, normal mode analysis, protein stability, epithelial-mesenchymal transition, patient survival, cancer pathways
MeSH terms
Humans, Membrane Proteins, Neoplasm Proteins, Neoplasms

About these checks

Registry, retraction, Cites and statistics results are computed, not judged, with one exception: a printed reference that no index lists is read once by a model before it counts as a citation error. Claims are extracted by a model and kept only when their quote appears verbatim in the text; each cited source is then checked, with a model’s help, for whether it says what the claim relies on. Those verdicts can be wrong — read the claim’s quote and the cited source before relying on one.

Statistics and arithmetic are recomputed, not judged.

Confidence bands are shown only for fields calibrated on our annotated test set. None is calibrated yet, so no band is shown.

What counts as a claim ›How we measure confidence ›How we check this ›

Are you an author, or do you see a problem with this page? Request a review

How to cite

Cite CoChat for the checks on this page, and the paper for its own findings.

This page
CoChat. (2026). Citation check: Pan-cancer analyses suggest kindlin-associated global mechanochemical alterations. https://app.cochat.ai/papers/10.1038/s42003-024-06044-5
The paper
Chowdhury, D., Mistry, A., Maity, D., Bhatia, R., Priyadarshi, S., Wadan, S., Chakraborty, S., & Haldar, S. (2024). Pan-cancer analyses suggest kindlin-associated global mechanochemical alterations. Communications Biology. https://doi.org/10.1038/s42003-024-06044-5

Data sources

Bibliographic data: Semantic Scholar, OpenAlex, Crossref.

Contains information from the Semantic Scholar Academic Graph Datasets, made available under the ODC Attribution License (ODC-BY 1.0).

Semantic Scholar’s data is described in: Kinney, R., et al. (2023). The Semantic Scholar Open Data Platform. arXiv:2301.10140.