

The DOI matches its Crossref record; 73 of the 73 references it cites were found in a registry or an index.
Quality Evaluation Based Simulation Selection (QEBSS) for analysis of conformational ensembles and dynamics of multidomain proteins
Open accessPublished version of a preprint
Abstract
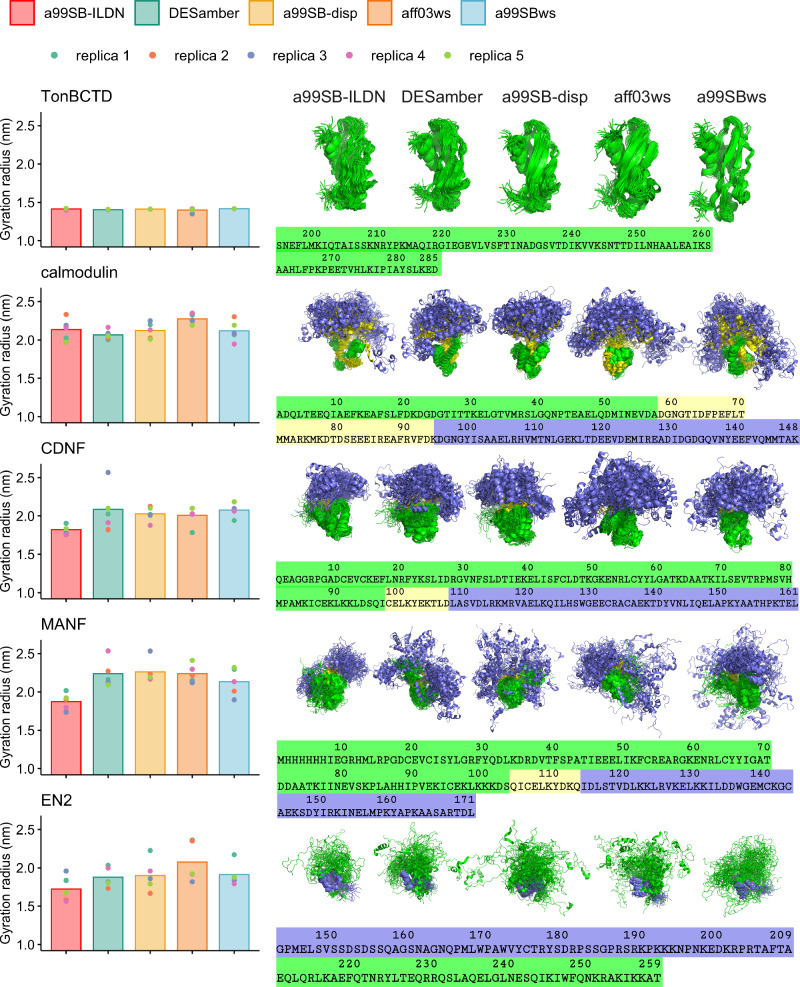
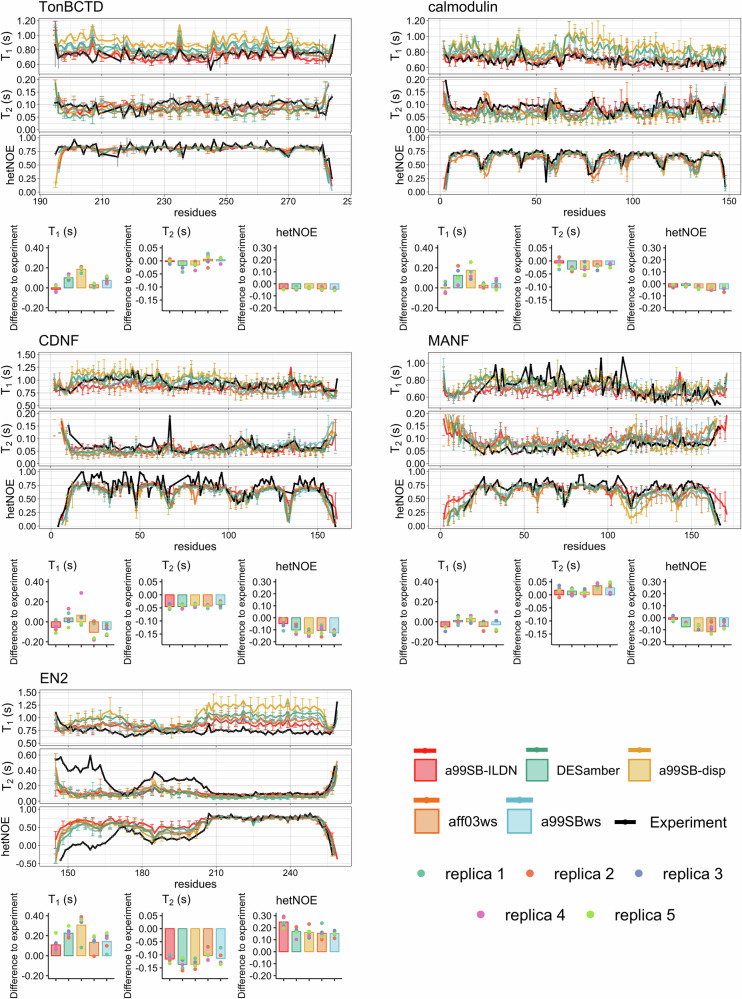
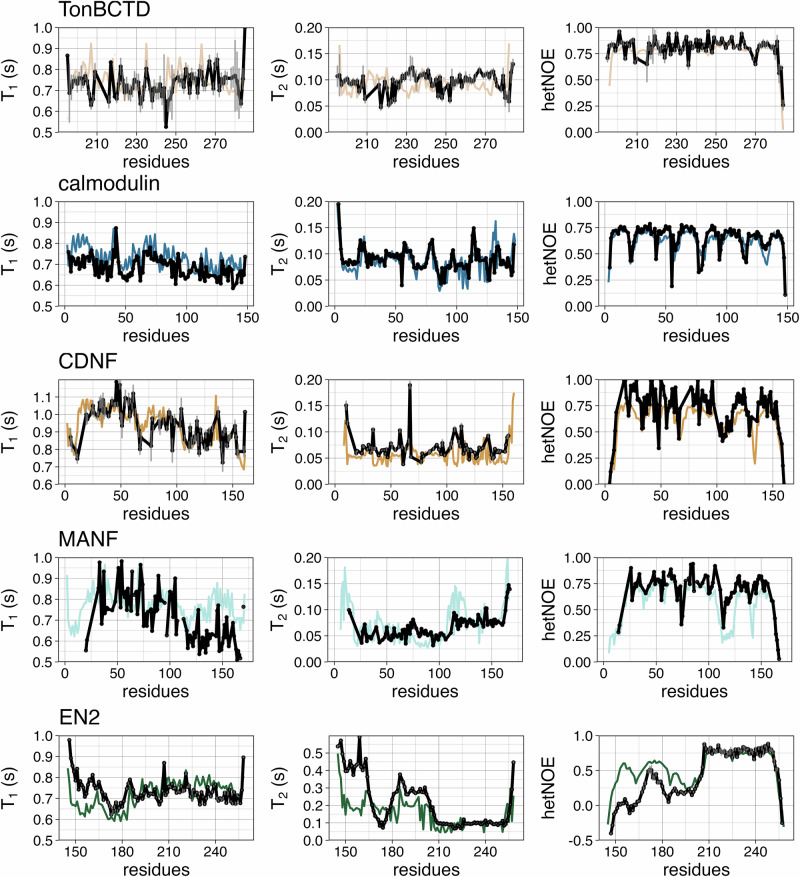
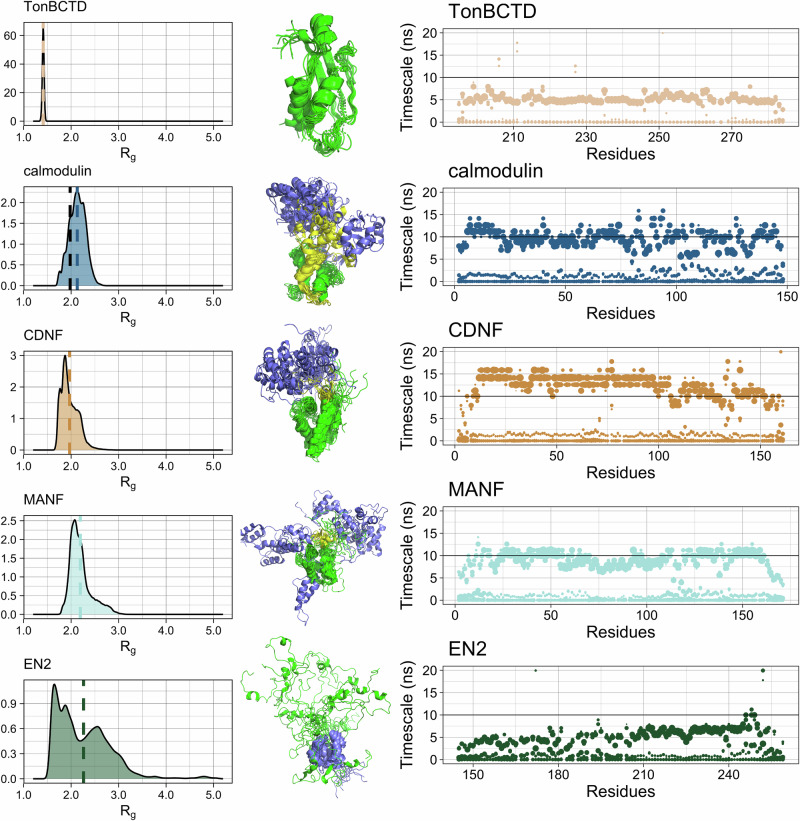
Multidomain proteins containing both folded and intrinsically disordered regions are crucial for biological processes, but characterizing their conformational ensembles and dynamics remains challenging. We introduce the Quality Evaluation Based Simulation Selection (QEBSS) protocol, which combines MD simulations with NMR-derived protein backbone 15 N T 1 and T 2 spin relaxation times and hetNOE values to interpret conformational ensembles and dynamics of multidomain proteins. We demonstrate the practical advantage of QEBSS by characterizing four flexible multidomain proteins: calmodulin, EN2, MANF, and CDNF. These biologically important proteins have been difficult to study due to their flexible nature. Our findings reveal new insights into their conformational landscapes and dynamics, providing mechanistic understanding of their biological functions. QEBSS offers quantitative quality evaluation of simulations and a systematic approach for resolving conformational ensembles of multidomain proteins with heterogeneous dynamics. Given the importance of such proteins in biology, biotechnology, and materials science, QEBSS should benefit fields from drug design to novel materials development.
Overview
The claims and statistics of this paper haven’t been checked yet.
Run the check — free, no account needed. It reads the open-access text and checks the sources it cites.
Integrity signals
Registry
Cites
Statistics
Figures
Verification
Claims the paper makes
The claims and statistics of this paper haven’t been checked yet.
Run the check — free, no account needed. It reads the open-access text and checks the sources it cites.
Self-check
Percentages, sums and reported differences re-computed from the paper’s own numbers.
The self-check needs the paper’s full text.
Citations
Cites
Highly accurate protein structure prediction with AlphaFold
Jumper, J., Evans, R., Pritzel, A., Green, T., Figurnov, M., Ronneberger, O., Tunyasuvunakool, K., Bates, R., Žídek, A., Potapenko, A., et al. (2021) · Nature · doi:10.1038/s41586-021-03819-2 · Cited by 43,764
Abraham, M. J., Murtola, T., Schulz, R., Páll, S., Smith, J. C., Hess, B., & Lindahl, E. (2015) · SoftwareX · doi:10.1016/j.softx.2015.06.001 · Cited by 27,190
Polymorphic transitions in single crystals: A new molecular dynamics method
Parrinello, M., & Rahman, A. (1981) · Journal of Applied Physics · doi:10.1063/1.328693 · Cited by 19,790
The Principles of Nuclear Magnetism
Abragam, A., & Hebel, L. C. (1961) · American Journal of Physics · doi:10.1119/1.1937646 · Cited by 15,792
Tissue-based map of the human proteome
Uhlén, M., Fagerberg, L., Hallström, B. M., Lindskog, C., Oksvold, P., Mardinoglu, A., Sivertsson, Å., Kampf, C., Sjöstedt, E., Asplund, A., et al. (2015) · Science · doi:10.1126/science.1260419 · Cited by 15,286
Improved side-chain torsion potentials for the Amber ff99SB protein force field
Lindorff-Larsen, K., Piana, S., Palmo, K., Maragakis, P., Klepeis, J., Dror, R., & Shaw, D. (2010) · Proteins: Structure, Function, and Bioinformatics · doi:10.1002/prot.22711 · Cited by 6,056
A general purpose model for the condensed phases of water: TIP4P/2005
Abascal, J. L. F., & Vega, C. (2005) · The Journal of Chemical Physics · doi:10.1063/1.2121687 · Cited by 3,934
Development of an improved four-site water model for biomolecular simulations: TIP4P-Ew
Horn, H. W., Swope, W. C., Pitera, J. W., Madura, J. D., Dick, T. J., Hura, G. L., & Head-Gordon, T. (2004) · The Journal of Chemical Physics · doi:10.1063/1.1683075 · Cited by 2,121
Fusion protein linkers: Property, design and functionality
Chen, X., Zaro, J. L., & Shen, W.-C. (2013) · Advanced Drug Delivery Reviews · doi:10.1016/j.addr.2012.09.039 · Cited by 2,056
Kay, L. E., Torchia, D. A., & Bax, A. (1989) · Biochemistry · doi:10.1021/bi00449a003 · Cited by 1,768
Cited by
Rapid Interpretation of Protein Backbone Rotation Dynamics Directly from Spin Relaxation Data
Nencini, R., Mantzari, E., Sandelin, A. E., & Ollila, O. H. S. (2024) · The Journal of Physical Chemistry Letters · doi:10.1021/acs.jpclett.4c01800 · Cited by 3
Self-citation
Metadata
- Authors
- Sandelin, A. E., Nencini, R., Yasar, E., Fudo, S., Stratoulias, V., Kajander, T., & Ollila, O. H. S.
- Affiliations
- University of Helsinki (FI)
- Corresponding author
- Ollila, O. H. Samuli
- ORCID
- Venue
- Communications Chemistry
- Published
- 2025-08-10
- Volume
- 8
- Issue
- 1
- Pages
- 241-241
- ISSN
- 2399-3669 (ISSN-L)
- PMC
- PMC12335556
- OpenAlex
- W4413094454
- Cited by
- 5
- References
- 73
- Citations by year
- 2026: 3 · 2025: 1
- FWCI
- 1.20
- Type
- journal article
- Language
- en
- Open access
- gold
- doi.org
- Licence
- cc-by
- creativecommons.org/licenses/by/4.0 (tdm)
- creativecommons.org/licenses/by/4.0 (vor)
- Locations
- Communications Chemistry (publishedVersion, cc-by)
- ChemRxiv (acceptedVersion, cc-by-nc)
- PubMed Central (publishedVersion, cc-by)
- PubMed (publishedVersion)
- DOAJ (DOAJ: Directory of Open Access Journals) (submittedVersion, cc-by-sa)
- Työväentutkimus Vuosikirja (submittedVersion)
- Funders
- Emil Aaltosen Säätiö
- Topics
- Life Sciences › Biochemistry, Genetics and Molecular Biology › Molecular Biology › Protein Structure and Dynamics
- Physical Sciences › Chemistry › Spectroscopy › Advanced NMR Techniques and Applications
- Physical Sciences › Chemistry › Physical and Theoretical Chemistry › Advanced Physical and Chemical Molecular Interactions
- Keywords
- multidomain proteins, intrinsically disordered regions, conformational ensembles, protein dynamics, calmodulin, EN2, MANF, CDNF, flexible proteins
About these checks
Registry, retraction, Cites and statistics results are computed, not judged, with one exception: a printed reference that no index lists is read once by a model before it counts as a citation error. Claims are extracted by a model and kept only when their quote appears verbatim in the text; each cited source is then checked, with a model’s help, for whether it says what the claim relies on. Those verdicts can be wrong — read the claim’s quote and the cited source before relying on one.
Statistics and arithmetic are recomputed, not judged.
Confidence bands are shown only for fields calibrated on our annotated test set. None is calibrated yet, so no band is shown.
What counts as a claim ›How we measure confidence ›How we check this ›
Are you an author, or do you see a problem with this page? Request a review
Data sources
Bibliographic data: Semantic Scholar, OpenAlex, Crossref.
Contains information from the Semantic Scholar Academic Graph Datasets, made available under the ODC Attribution License (ODC-BY 1.0).
Semantic Scholar’s data is described in: Kinney, R., et al. (2023). The Semantic Scholar Open Data Platform. arXiv:2301.10140.
