

The DOI matches its Crossref record; 4 of the 4 references it cites were found in a registry or an index.
Topological photonic crystal nanocavity laser
Abstract
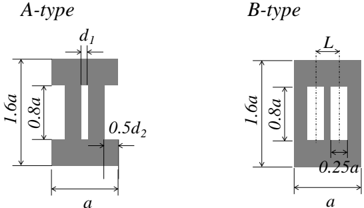
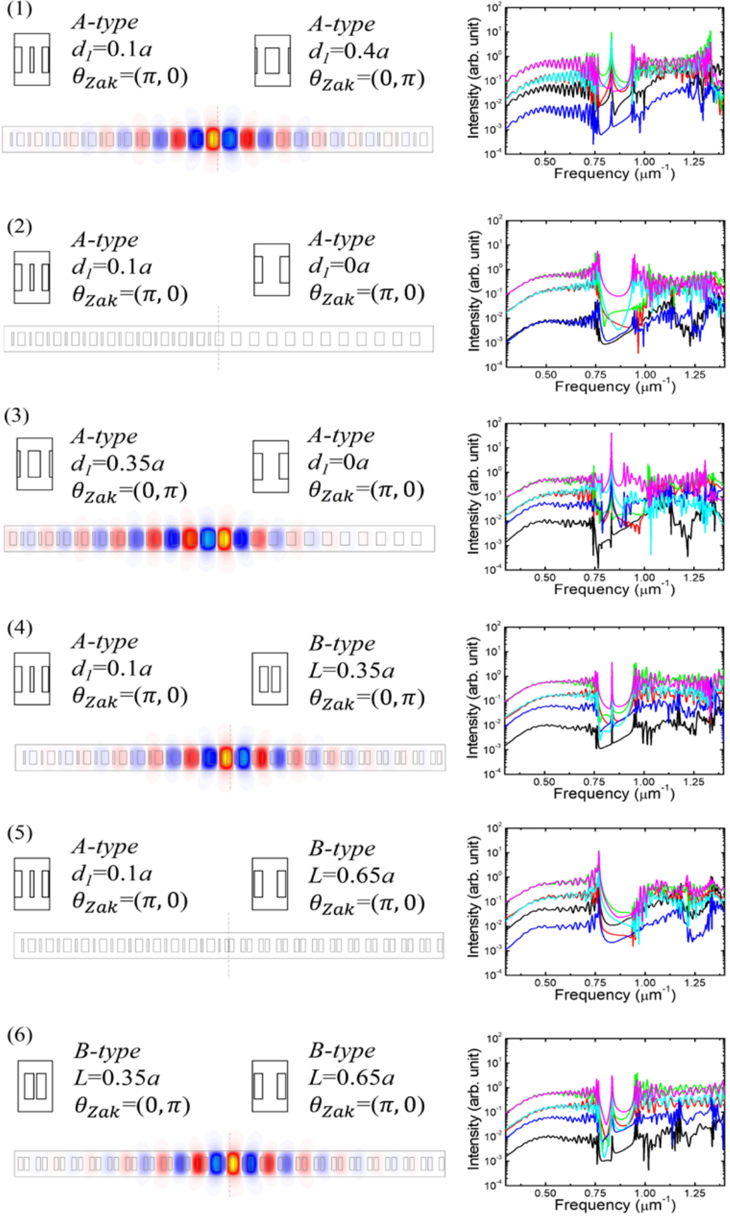
Topological edge states exist at the interfaces between two topologically distinct materials. The presence and number of such modes are deterministically predicted from the bulk band topologies, known as the bulk-edge correspondence. This principle is highly useful for predictably controlling optical modes in resonators made of photonic crystals (PhCs), leading to the recent demonstrations of microscale topological lasers. Meanwhile, zero-dimensional topological trapped states in the nanoscale remained unexplored, despite its importance for enhancing light–matter interactions and for wide applications including single-mode nanolasers. Here, we report a topological PhC nanocavity with a near-diffraction-limited mode volume and its application to single-mode lasing. The topological origin of the nanocavity, formed at the interface between two topologically distinct PhCs, guarantees the existence of only one mode within its photonic bandgap. The observed lasing accompanies a high spontaneous emission coupling factor stemming from the nanoscale confinement. These results encompass a way to greatly downscale topological photonics.
Overview
The claims and statistics of this paper haven’t been checked yet.
Run the check — free, no account needed. It reads the open-access text and checks the sources it cites.
Integrity signals
Registry
Cites
Statistics
Figures
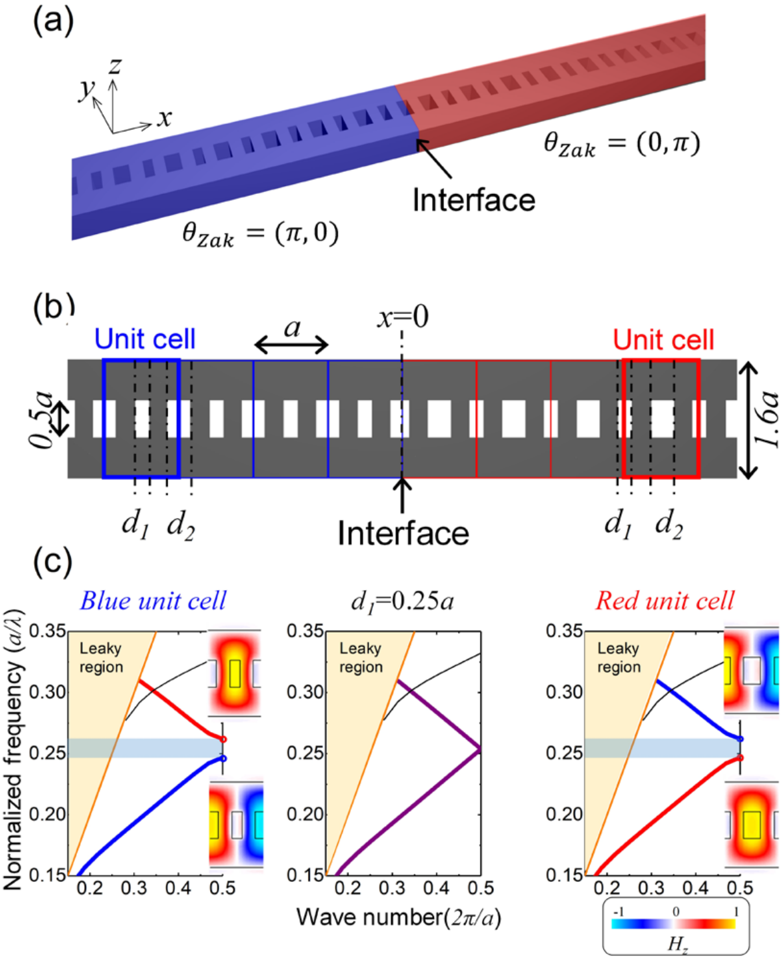
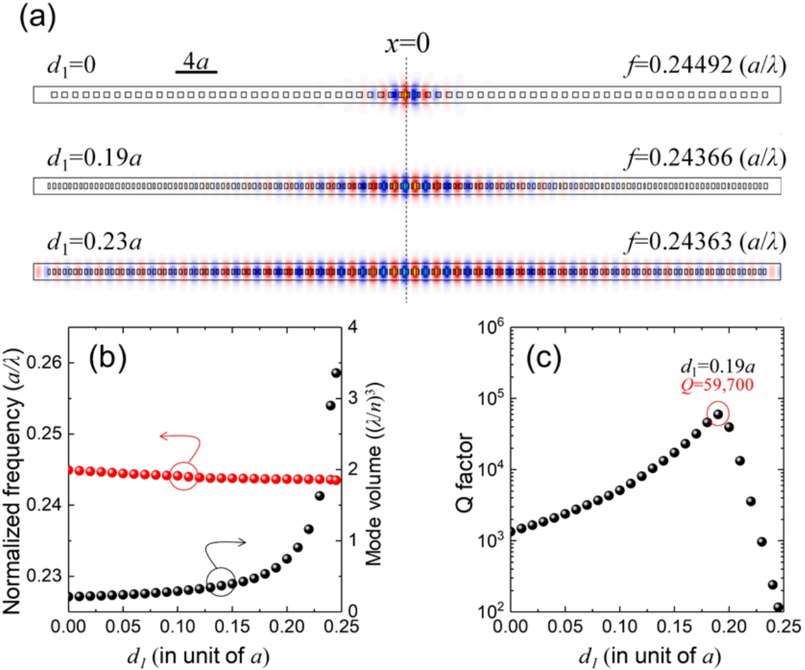
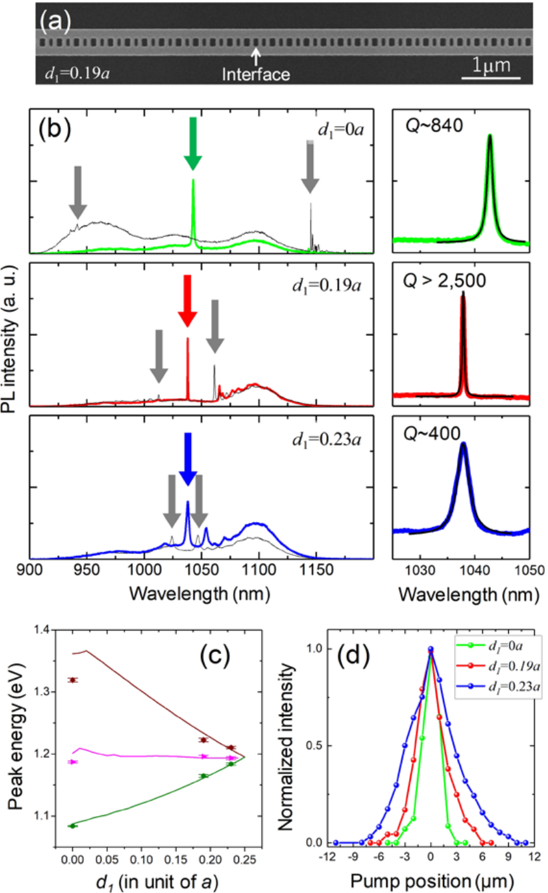
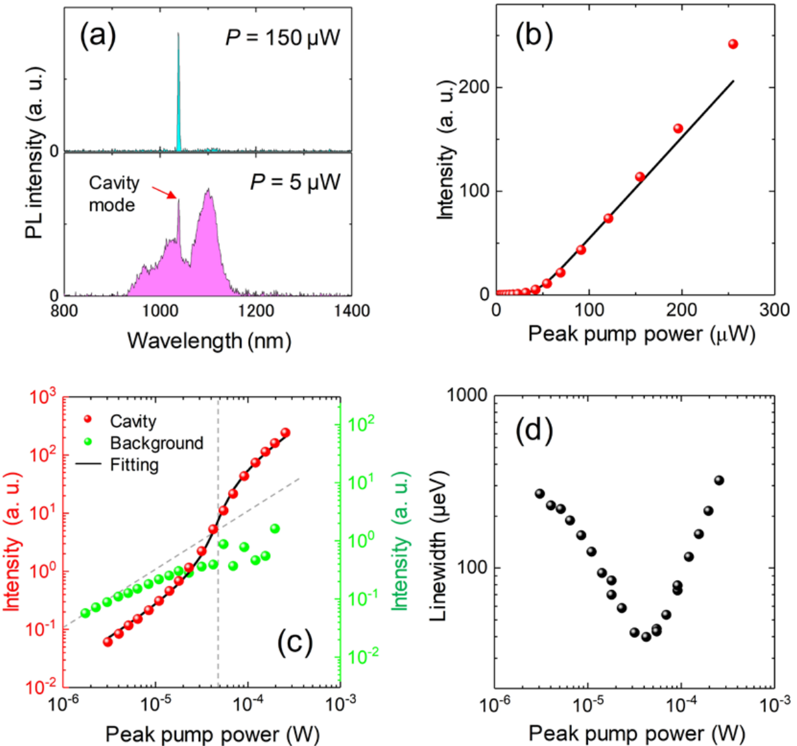
Verification
Claims the paper makes
The claims and statistics of this paper haven’t been checked yet.
Run the check — free, no account needed. It reads the open-access text and checks the sources it cites.
Claims other papers make about this one
Each is checked against this paper’s own text: does it say what the citing paper says it does?
The source backs part of the claim, not all of it — or backs it for a different population, condition or comparison.
In the citing paper
“In all cases, for suitable pump geometries, a single-mode laser emission occurred into the edge states of the chain.”
From Topological photonics (2019) · cites this paper as Ota et al., 2018
Experimental — accuracy not yet measured
Self-check
Percentages, sums and reported differences re-computed from the paper’s own numbers.
The self-check needs the paper’s full text.
Citations
Cites
Ozawa, T., Price, H. M., Amo, A., Goldman, N., Hafezi, M., Lu, L., Rechtsman, M. C., Schuster, D., Simon, J., Zilberberg, O., et al. (2019) · Reviews of Modern Physics · doi:10.1103/revmodphys.91.015006 · Cited by 3,722
Observation of unidirectional backscattering-immune topological electromagnetic states
Wang, Z., Chong, Y., Joannopoulos, J. D., & Soljačić, M. (2009) · Nature · doi:10.1038/nature08293 · Cited by 3,123
Smallest possible electromagnetic mode volume in a dielectric cavity
Coccioli, R., Boroditsky, M., Yablonovitch, E., Rahmat-Samii, Y., & Kim, K. W. (1998) · IEE Proceedings - Optoelectronics · doi:10.1049/ip-opt:19982468 · Cited by 178
Photonic simulation of topological excitations in metamaterials
Tan, W., Sun, Y., Chen, H., & Shen, S.-Q. (2014) · Scientific Reports · doi:10.1038/srep03842 · Cited by 86
Research works printed but not linked: 36
- Hatsugai, Y. Chern number and edge states in the integer quantum Hall effect. Phys. Rev. Lett. 71, 3697–3700 (1993). · DOI · Paper page
- Su, W. P., Schrieffer, J. R. & Heeger, A. J. Solitons in polyacetylene. Phys. Rev. Lett. 42, 1698–1701 (1979). · DOI · Paper page
- Gao, W. S., Xiao, M., Chan, C. T. & Tam, W. Y. Determination of Zak phase by reflection phase in 1D photonic crystals. Opt. Lett. 40, 5259 (2015). · DOI
- St-Jean, P. et al. Lasing in topological edge states of a one-dimensional lattice. Nat. Photonics 11, 651–656 (2017). · DOI · Paper page
- Zhao, H. et al. Topological hybrid silicon microlasers. Nat. Commun. 9, 981 (2018). · DOI · Paper page
- Parto, M. et al. Edge-mode lasing in 1D topological active arrays. Phys. Rev. Lett. 120, 113901 (2018). · DOI · Paper page
- Poli, C., Bellec, M., Kuhl, U., Mortessagne, F. & Schomerus, H. Selective enhancement of topologically induced interface states in a dielectric resonator chain. Nat. Commun. 6, 6710 (2015). · DOI
- Slobozhanyuk, A. P., Poddubny, A. N., Miroshnichenko, A. E., Belov, P. A. & Kivshar, Y. S. Subwavelength topological edge states in optically resonant dielectric structures. Phys. Rev. Lett. 114, 123901 (2015). · DOI
- Xiao, M. et al. Geometric phase and band inversion in periodic acoustic systems. Nat. Phys. 11, 240–244 (2015). · DOI
- Xiao, Y.-X., Ma, G., Zhang, Z.-Q. & Chan, C. T. Topological subspace-induced bound state in the continuum. Phys. Rev. Lett. 118, 166803 (2017). · DOI
- Kim, I., Iwamoto, S. & Arakawa, Y. Topologically protected elastic waves in one-dimensional phononic crystals of continuous media. Appl. Phys. Express 11, 017201 (2018). · DOI
- Haldane, F. D. M. & Raghu, S. Possible realization of directional optical waveguides in photonic crystals with broken time-reversal symmetry. Phys. Rev. Lett. 100, 013904 (2008). · DOI · Paper page
- Lu, L., Joannopoulos, J. D. & Soljačić, M. Topological photonics. Nat. Photonics 8, 821–829 (2014). · DOI · Paper page
- Asano, T., Ochi, Y., Takahashi, Y., Kishimoto, K. & Noda, S. Photonic crystal nanocavity with a Q factor exceeding eleven million. Opt. Express 25, 1769 (2017). · DOI
- Hu, S. et al. Experimental realization of deep subwavelength confinement in dielectric optical resonators. arXiv 1707, 04672 (2017).
- Deotare, P. B., McCutcheon, M. W., Frank, I. W., Khan, M. & Lončar, M. High quality factor photonic crystal nanobeam cavities. Appl. Phys. Lett. 94, 121106 (2009). · DOI
- Oulton, R. F. et al. Plasmon lasers at deep subwavelength scale. Nature 461, 629–632 (2009). · DOI
- Bahari, B. et al. Nonreciprocal lasing in topological cavities of arbitrary geometries. Science 358, 636–640 (2017). · DOI · Paper page
- Bandres, M. A. et al. Topological insulator laser: experiments. Science 359, eaar4005 (2018). · DOI · Paper page
- Zak, J. Berrys phase for energy bands in solids. Phys. Rev. Lett. 62, 2747–2750 (1989). · DOI · Paper page
- Khajavikhan, M. et al. Thresholdless nanoscale coaxial lasers. Nature 482, 204–207 (2012). · DOI
- Ota, Y., Kakuda, M., Watanabe, K., Iwamoto, S. & Arakawa, Y. Thresholdless quantum dot nanolaser. Opt. Express 25, 19981 (2017). · DOI
- Takiguchi, M. et al. Systematic study of thresholdless oscillation in high-β buried multiple-quantum-well photonic crystal nanocavity lasers. Opt. Express 24, 3441 (2016). · DOI
- Zhang, Y. et al. Photonic crystal nanobeam lasers. Appl. Phys. Lett. 97, 051104 (2010). · DOI
- Xiao, M., Zhang, Z. Q. & Chan, C. T. Surface impedance and bulk band geometric phases in one-dimensional systems. Phys. Rev. X 4, 021017 (2014).
- Zak, J. Symmetry criterion for surface states in solids. Phys. Rev. B 32, 2218–2226 (1985). · DOI
- Kalozoumis, P. A. et al. Finite size effects on topological interface states in one-dimensional scattering systems. arXiv 1712, 08763 (2017).
- Lalouat, L. et al. Subwavelength imaging of light confinement in high-Q/small-V photonic crystal nanocavity. Appl. Phys. Lett. 92, 111111 (2008). · DOI
- Bjork, G. & Yamamoto, Y. Analysis of semiconductor microcavity lasers using rate equations. IEEE J. Quantum Electron. 27, 2386–2396 (1991). · DOI
- Notomi, M. & Taniyama, H. On-demand ultrahigh-Q cavity formation and photon pinning via dynamic waveguide tuning. Opt. Express 16, 18657 (2008). · DOI
- Schomerus, H. Topologically protected midgap states in complex photonic lattices. Opt. Lett. 38, 1912 (2013). · DOI
- Malzard, S., Poli, C. & Schomerus, H. Topologically protected defect states in open photonic systems with non-hermitian charge-conjugation and parity-time symmetry. Phys. Rev. Lett. 115, 200402 (2015). · DOI · Paper page
- Leykam, D., Bliokh, K. Y., Huang, C., Chong, Y. D. & Nori, F. Edge modes, degeneracies, and topological numbers in non-Hermitian systems. Phys. Rev. Lett. 118, 28–30 (2017). · DOI
- Harari, G. et al. Topological insulator laser: theory. Science 359, eaar4003 (2018). · DOI · Paper page
- Malzard, S. & Schomerus, H. Nonlinear mode competition and symmetry-protected power oscillations in topological lasers. New J. Phys. 20, 063044 (2018). · DOI
- Longhi, S., Kominis, Y. & Kovanis, V. Presence of temporal dynamical instabilities in topological insulator lasers. Europhys. Lett. 122, 14004 (2018). · DOI · Paper page
Cited by
Sorted by citations
Ozawa, T., Price, H. M., Amo, A., Goldman, N., Hafezi, M., Lu, L., Rechtsman, M. C., Schuster, D., Simon, J., Zilberberg, O., et al. (2019) · Reviews of Modern Physics · doi:10.1103/revmodphys.91.015006 · Cited by 3,722
Topological Insulator Laser Using Valley-Hall Photonic Crystals
Gong, Y., Wong, S., Bennett, A. J., Huffaker, D. L., & Oh, S. S. (2020) · ACS Photonics · doi:10.1021/acsphotonics.0c00521 · Cited by 191
Metadata
- Authors
- Ota, Y., Katsumi, R., Watanabe, K., Iwamoto, S., & Arakawa, Y.
- Venue
- Communications Physics
- Published
- 2018-11-22
- Volume
- 1
- Issue
- 1
- ISSN
- 2399-3650
- Cited by
- 239
- References
- 4
- Language
- en
About these checks
Registry, retraction, Cites and statistics results are computed, not judged, with one exception: a printed reference that no index lists is read once by a model before it counts as a citation error. Claims are extracted by a model and kept only when their quote appears verbatim in the text; each cited source is then checked, with a model’s help, for whether it says what the claim relies on. Those verdicts can be wrong — read the claim’s quote and the cited source before relying on one.
Statistics and arithmetic are recomputed, not judged.
Confidence bands are shown only for fields calibrated on our annotated test set. None is calibrated yet, so no band is shown.
What counts as a claim ›How we measure confidence ›How we check this ›
Are you an author, or do you see a problem with this page? Request a review
