Cited by 68

The DOI matches its Crossref record; 12 of the 12 references it cites were found in a registry or an index.

Gut microbiota-dependent increase in phenylacetic acid induces endothelial cell senescence during aging

Saeedi Saravi, Seyed Soheil, Pugin, Benoit, Constancias, Florentin, Shabanian, Khatereh, Spalinger, Marianne, Thomas, Aurélien, Le Gludic, Sylvain, Shabanian, Taraneh, Karsai, Gergely, Colucci, Manuel, Menni, Cristina, Attaye, Ilias, Zhang, Xinyuan, Allemann, Meret Sarah, Lee, Pratintip, Visconti, Alessia, Falchi, Mario, Alimonti, Andrea, Ruschitzka, Frank, Paneni, Francesco, Beer, Jürg H.·2025·Nature Aging

Published version of a preprint

Abstract

Endothelial cell senescence is a key driver of cardiovascular aging, yet little is known about the mechanisms by which it is induced in vivo. Here we show that the gut bacterial metabolite phenylacetic acid (PAA) and its byproduct, phenylacetylglutamine (PAGln), are elevated in aged humans and mice. Metagenomic analyses reveal an age-related increase in PAA-producing microbial pathways, positively linked to the bacterium Clostridium sp. ASF356 ( Clos ). We demonstrate that colonization of young mice with Clos increases blood PAA levels and induces endothelial senescence and angiogenic incompetence. Mechanistically, we find that PAA triggers senescence through mitochondrial H 2 O 2 production, exacerbating the senescence-associated secretory phenotype. By contrast, we demonstrate that fecal acetate levels are reduced with age, compromising its function as a Sirt1-dependent senomorphic, regulating proinflammatory secretion and redox homeostasis. These findings define PAA as a mediator of gut–vascular crosstalk in aging and identify sodium acetate as a potential microbiome-based senotherapy to promote healthy aging.

Overview

The claims and statistics of this paper haven’t been checked yet.

Run the check — free, no account needed. It reads the open-access text and checks the sources it cites.

A few free checks a day · papers already verified open instantly · results are public

Integrity signals

Registry

Crossref · 10.1038/s43587-025-00864-8

Cites

12 of 12 references verified0 citation errors · 0 not checkable

Statistics

Figures

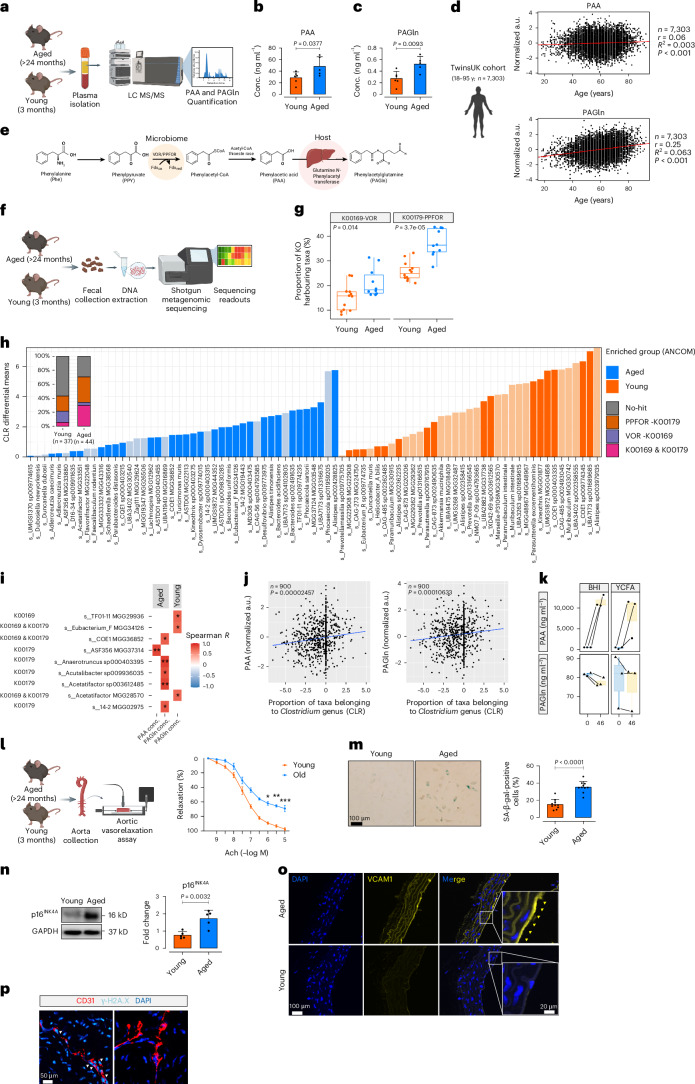
Fig. 1 Reflection of age in plasma levels of gut microbiota-derived metabolites PAA and PAGln. a, Schematic of quantification of plasma PAA and PAGln in young (3-month-old) and aged (>24-month-old) C57BL/6J male and female mice. b,c, Plasma PAA (b) and PAGln (c) levels were measured by LC–MS/MS in mice (n = 6). d, Correlation between plasma PAA (left) and PAGln (right) concentrations and chronological age in the TwinsUK cohort (n = 7,303, male and female). e, Schema for PAA production from dietary phenylalanine (Phe) via the bacterial VOR/PPFOR system. f, Shotgun metagenomics workflow for analyzing mouse fecal microbiomes. g, Distribution of VOR and PPFOR gene homologs (%) in microbiomes of aged and young mice (n = 5–6). KOO169, VOR; KOO179, PPFOR). h, Bar plot depicting age-associated abundance of fecal microbiota profiles at strain level (dark colors represent taxa harboring VOR or PPFOR homologs). The leftmost bar plot demonstrates the proportion of VOR, PPFOR or VOR + PPFOR detected in taxa enriched in aged (n = 44) versus young (n = 37) mice. i, Heatmap shows correlations between plasma PAA or PAGln levels and gut bacteria among the top enriched taxa in aged versus young mice (n = 5–6). j, Correlation between plasma PAA (left) and PAGln (right) concentrations and abundance (%) of Clostridium taxa in human participants (n = 900, TwinsUK; male and female). k, PAA (top) and PAGln (below) concentrations in the supernatants of anaerobic cultures from Clostridium sp. ASF356 (n = 8). l, Schematic of ex vivo force tension myography. Aortic rings exhibit vasorelaxation responses (%) to acetylcholine (Ach) (n = 10). m, SA-β-gal staining of ECs from the ascending aortas of mice (n = 5–6) and quantification of SA-β-gal+ cells (%). n,o, Immunoblots and immunofluorescence represent the expression of p16INK4a (n) and VCAM1 (o) in aortic ECs (n = 5–6). p, γ-H2A.X immunostaining in CD31+ ECs (n = 5–6). Scale bars, 20, 50 and 100 μm. Error bars represent s.d. (b,c,m,n) or s.e.m. (g,k,l) or 95% confidence intervals (d). Statistical analysis was performed using a two-tailed unpaired Student’s t-test (b,c,l–n), two-tailed Pearson correlation analysis (d), two-tailed Mann–Whitney U-test (g,k), ANCOM method for microbial abundance analysis (h), two-sided Spearman’s rank correlation test (i) and linear mixed model CLR transformation (j). Data are shown as median with min–max; boxes represent interquartile range (IQR); center lines represent the median; whiskers extend from the min to max values (g,k). Images created with BioRender.com (a,d–f,l). *P < 0.05, **P < 0.01, ***P < 0.001. Source data
Fig. 1 Reflection of age in plasma levels of gut microbiota-derived metabolites PAA and PAGln. a, Schematic of quantification of plasma PAA and PAGln in young (3-month-old) and aged (>24-month-old) C57BL/6J male and female mice. b,c, Plasma PAA (b) and PAGln (c) levels were measured by LC–MS/MS in mice (n = 6). d, Correlation between plasma PAA (left) and PAGln (right) concentrations and chronological age in the TwinsUK cohort (n = 7,303, male and female). e, Schema for PAA production from dietary phenylalanine (Phe) via the bacterial VOR/PPFOR system. f, Shotgun metagenomics workflow for analyzing mouse fecal microbiomes. g, Distribution of VOR and PPFOR gene homologs (%) in microbiomes of aged and young mice (n = 5–6). KOO169, VOR; KOO179, PPFOR). h, Bar plot depicting age-associated abundance of fecal microbiota profiles at strain level (dark colors represent taxa harboring VOR or PPFOR homologs). The leftmost bar plot demonstrates the proportion of VOR, PPFOR or VOR + PPFOR detected in taxa enriched in aged (n = 44) versus young (n = 37) mice. i, Heatmap shows correlations between plasma PAA or PAGln levels and gut bacteria among the top enriched taxa in aged versus young mice (n = 5–6). j, Correlation between plasma PAA (left) and PAGln (right) concentrations and abundance (%) of Clostridium taxa in human participants (n = 900, TwinsUK; male and female). k, PAA (top) and PAGln (below) concentrations in the supernatants of anaerobic cultures from Clostridium sp. ASF356 (n = 8). l, Schematic of ex vivo force tension myography. Aortic rings exhibit vasorelaxation responses (%) to acetylcholine (Ach) (n = 10). m, SA-β-gal staining of ECs from the ascending aortas of mice (n = 5–6) and quantification of SA-β-gal+ cells (%). n,o, Immunoblots and immunofluorescence represent the expression of p16INK4a (n) and VCAM1 (o) in aortic ECs (n = 5–6). p, γ-H2A.X immunostaining in CD31+ ECs (n = 5–6). Scale bars, 20, 50 and 100 μm. Error bars represent s.d. (b,c,m,n) or s.e.m. (g,k,l) or 95% confidence intervals (d). Statistical analysis was performed using a two-tailed unpaired Student’s t-test (b,c,l–n), two-tailed Pearson correlation analysis (d), two-tailed Mann–Whitney U-test (g,k), ANCOM method for microbial abundance analysis (h), two-sided Spearman’s rank correlation test (i) and linear mixed model CLR transformation (j). Data are shown as median with min–max; boxes represent interquartile range (IQR); center lines represent the median; whiskers extend from the min to max values (g,k). Images created with BioRender.com (a,d–f,l). *P < 0.05, **P < 0.01, ***P < 0.001. Source dataCC BY · PubMed Central
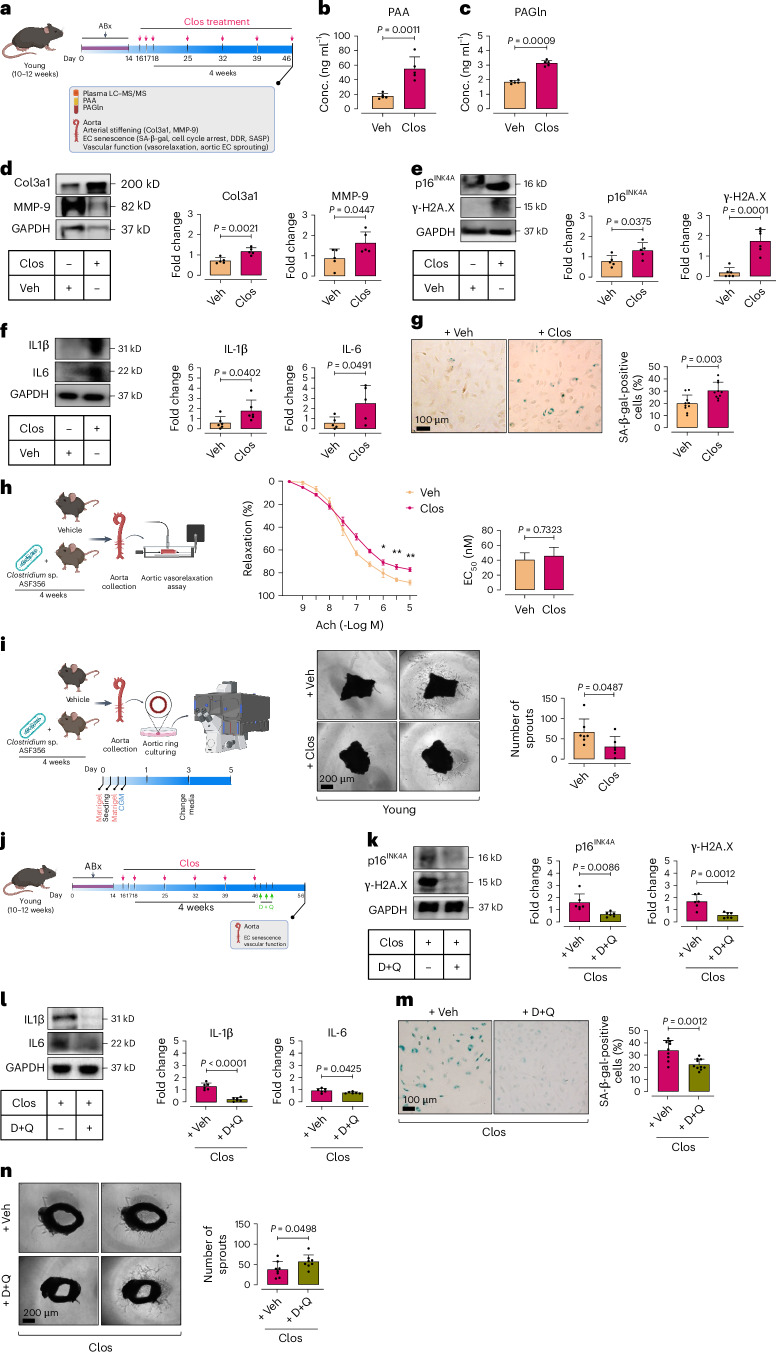
Fig. 2 Clostridium sp. ASF356 induces EC senescence in aortas of colonized mice. a, Schematic of the experimental setting: 10–12-week-old C57BL/6J male mice were pretreated with antibiotics (ABx) for 2 weeks, then colonized with Clostridium sp. ASF356 (Clos) by oral gavage for 4 weeks. b,c, LC–MS/MS quantification demonstrates plasma PAA (b) and PAGln (c) levels in mice (n = 5–6). d, Immunoblotting represents the expression of arterial stiffening biomarkers collagen 3a1 (Col3a1) and matrix metalloproteinase-9 (MMP-9) in aortas of mice (n = 5–6). e–g, ECs isolated from mouse aortas were subjected to characterization of cellular senescence hallmarks, including proliferative arrest marker p16INK4A and DDR marker γ-H2A.X (e), the SASP components IL-1β and IL-6 (f) and SA-β-gal activity (g) (n = 5–6). h, Schematic of ex vivo force tension myography. Aortic rings from Clos-colonized mice showed impaired vasorelaxation responses (%) to acetylcholine (n = 5–6). i, Schematic of aortic endothelial sprouting assays. Confocal micrographs of aortic rings illustrate angiogenic capacity of ECs. Quantitative plot for numbers of aortic endothelial sprouts (n = 5–6) (right). j, Schematic of the experimental setting: 10–12-week-old C57BL/6J male mice underwent ABx pre-treatment (2 weeks) and Clos colonization (4 weeks), followed by senolytic dasatinib (D) + quercetin (Q) treatment (D, 5 mg kg−1; Q, 50 mg kg−1, daily by oral gavage for 3 consecutive days). k–m, Senescence hallmarks, including p16INK4A and γ-H2A.X (k), IL-1β and IL-6 (l) and SA-β-gal activity (m), were examined in ECs isolated from aortas of mice (n = 6). n, Confocal micrographs of aortic rings illustrate the effects of D + Q on aortic endothelial sprouting capacity in Clos-colonized mice. Quantitative plot for numbers of endothelial sprouts (n = 8) (right). Data were determined in eight micrographs and represent triplicated biologically independent experiments (i,n). Scale bars, 100 and 200 μm. Error bars represent s.d. (b–g,i,k–n) or s.e.m. (h). P values were calculated using a two-tailed unpaired Student’s t-test (b–i,k–n). Images created with BioRender.com (a,h–j). *P < 0.05, **P < 0.01. Source data
Fig. 2 Clostridium sp. ASF356 induces EC senescence in aortas of colonized mice. a, Schematic of the experimental setting: 10–12-week-old C57BL/6J male mice were pretreated with antibiotics (ABx) for 2 weeks, then colonized with Clostridium sp. ASF356 (Clos) by oral gavage for 4 weeks. b,c, LC–MS/MS quantification demonstrates plasma PAA (b) and PAGln (c) levels in mice (n = 5–6). d, Immunoblotting represents the expression of arterial stiffening biomarkers collagen 3a1 (Col3a1) and matrix metalloproteinase-9 (MMP-9) in aortas of mice (n = 5–6). e–g, ECs isolated from mouse aortas were subjected to characterization of cellular senescence hallmarks, including proliferative arrest marker p16INK4A and DDR marker γ-H2A.X (e), the SASP components IL-1β and IL-6 (f) and SA-β-gal activity (g) (n = 5–6). h, Schematic of ex vivo force tension myography. Aortic rings from Clos-colonized mice showed impaired vasorelaxation responses (%) to acetylcholine (n = 5–6). i, Schematic of aortic endothelial sprouting assays. Confocal micrographs of aortic rings illustrate angiogenic capacity of ECs. Quantitative plot for numbers of aortic endothelial sprouts (n = 5–6) (right). j, Schematic of the experimental setting: 10–12-week-old C57BL/6J male mice underwent ABx pre-treatment (2 weeks) and Clos colonization (4 weeks), followed by senolytic dasatinib (D) + quercetin (Q) treatment (D, 5 mg kg−1; Q, 50 mg kg−1, daily by oral gavage for 3 consecutive days). k–m, Senescence hallmarks, including p16INK4A and γ-H2A.X (k), IL-1β and IL-6 (l) and SA-β-gal activity (m), were examined in ECs isolated from aortas of mice (n = 6). n, Confocal micrographs of aortic rings illustrate the effects of D + Q on aortic endothelial sprouting capacity in Clos-colonized mice. Quantitative plot for numbers of endothelial sprouts (n = 8) (right). Data were determined in eight micrographs and represent triplicated biologically independent experiments (i,n). Scale bars, 100 and 200 μm. Error bars represent s.d. (b–g,i,k–n) or s.e.m. (h). P values were calculated using a two-tailed unpaired Student’s t-test (b–i,k–n). Images created with BioRender.com (a,h–j). *P < 0.05, **P < 0.01. Source dataCC BY · PubMed Central
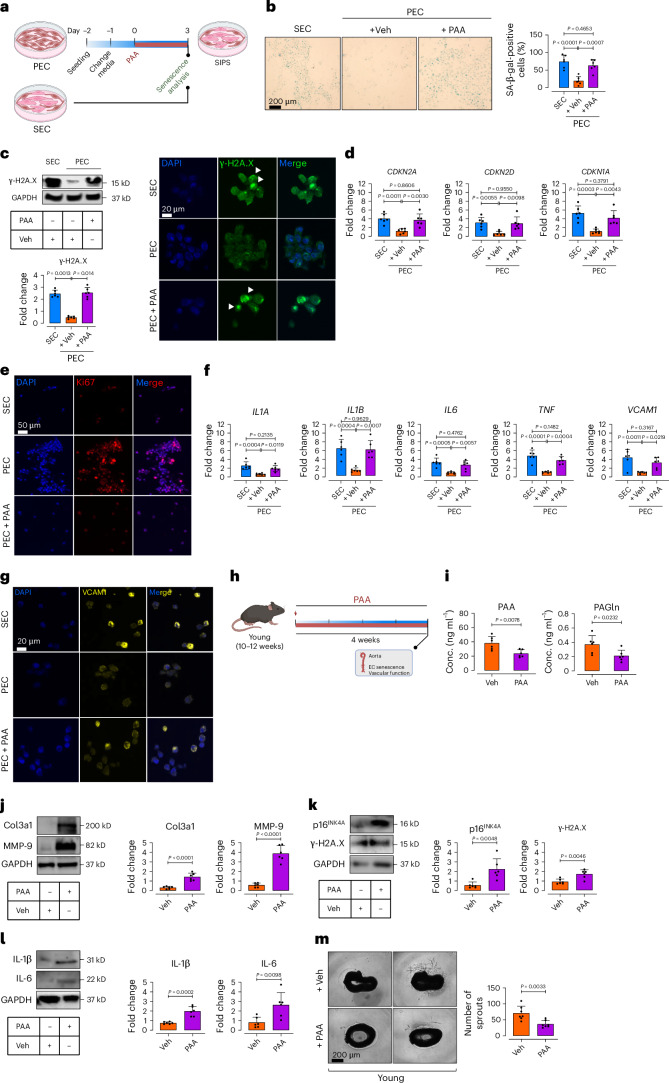
Fig. 3 PAA induces endothelial cell senescence. a, Schematic diagram of the experimental setting: PECs at p4–5 were treated with PAA (10 μM) for 72 h and then subjected to senescence hallmarks profiling. b, SA-β-gal staining shows senescence-associated lysosomal alterations in PECs treated with PAA versus vehicle versus replicative SECs. Quantitative plots are shown for SA-β-gal-positive cells (%) (n = 6) (right). c, Immunoblots (top) and γ-H2A.X immunostaining (bottom) represent DDR (n = 6). d, qPCR shows transcriptional changes of CDK inhibitors CDKN2A, CDKN2D and CDKN1A (n = 6). e, Immunostaining reveals the expression of proliferation marker Ki67 (n = 6). f, qPCR demonstrates transcriptional alterations of SASP genes IL1A, IL1B, IL6, TNF and VCAM1 (n = 6). g, VCAM1 immunostaining shows its expression in ECs (n = 6). Data from in vitro cellular experiments represent triplicate biologically independent experiments. h, Schematic diagram of the experimental setting: 10–12-week-old C57BL/6J male mice were treated with PAA (50 mg kg−1) via daily intraperitoneal (i.p.) injections for 4 weeks. Aortas were collected for characterization of EC senescence and angiogenic capacity. i, Plasma levels of PAA (left) and PAGln (right) were quantified by LC–MS/MS in mice (n = 6). j–l, Immunoblots represent the expression of tissue remodeling markers Col3a1 and MMP-9 (j) and senescence hallmarks including p16INK4a and γ-H2A.X (k) and IL-1β and IL-6 (l) in mouse aortas (n = 6). m, Confocal micrographs of aortic rings illustrate angiogenic incompetence in PAA- versus Veh-treated young mice. Quantitative plot represents the number of aortic endothelial sprouts (n = 8) (right). Data were determined in eight micrographs and represent triplicated biologically independent experiments. Scale bar, 20, 50 and 200 μm. Error bars represent s.d. (b–d,f,i–m). P values were calculated using one-way ANOVA followed by Tukey’s post hoc test (b–d,f) and a two-tailed unpaired Student’s t-test (j–m). Images created with BioRender.com (a,h). Source data
Fig. 3 PAA induces endothelial cell senescence. a, Schematic diagram of the experimental setting: PECs at p4–5 were treated with PAA (10 μM) for 72 h and then subjected to senescence hallmarks profiling. b, SA-β-gal staining shows senescence-associated lysosomal alterations in PECs treated with PAA versus vehicle versus replicative SECs. Quantitative plots are shown for SA-β-gal-positive cells (%) (n = 6) (right). c, Immunoblots (top) and γ-H2A.X immunostaining (bottom) represent DDR (n = 6). d, qPCR shows transcriptional changes of CDK inhibitors CDKN2A, CDKN2D and CDKN1A (n = 6). e, Immunostaining reveals the expression of proliferation marker Ki67 (n = 6). f, qPCR demonstrates transcriptional alterations of SASP genes IL1A, IL1B, IL6, TNF and VCAM1 (n = 6). g, VCAM1 immunostaining shows its expression in ECs (n = 6). Data from in vitro cellular experiments represent triplicate biologically independent experiments. h, Schematic diagram of the experimental setting: 10–12-week-old C57BL/6J male mice were treated with PAA (50 mg kg−1) via daily intraperitoneal (i.p.) injections for 4 weeks. Aortas were collected for characterization of EC senescence and angiogenic capacity. i, Plasma levels of PAA (left) and PAGln (right) were quantified by LC–MS/MS in mice (n = 6). j–l, Immunoblots represent the expression of tissue remodeling markers Col3a1 and MMP-9 (j) and senescence hallmarks including p16INK4a and γ-H2A.X (k) and IL-1β and IL-6 (l) in mouse aortas (n = 6). m, Confocal micrographs of aortic rings illustrate angiogenic incompetence in PAA- versus Veh-treated young mice. Quantitative plot represents the number of aortic endothelial sprouts (n = 8) (right). Data were determined in eight micrographs and represent triplicated biologically independent experiments. Scale bar, 20, 50 and 200 μm. Error bars represent s.d. (b–d,f,i–m). P values were calculated using one-way ANOVA followed by Tukey’s post hoc test (b–d,f) and a two-tailed unpaired Student’s t-test (j–m). Images created with BioRender.com (a,h). Source dataCC BY · PubMed Central
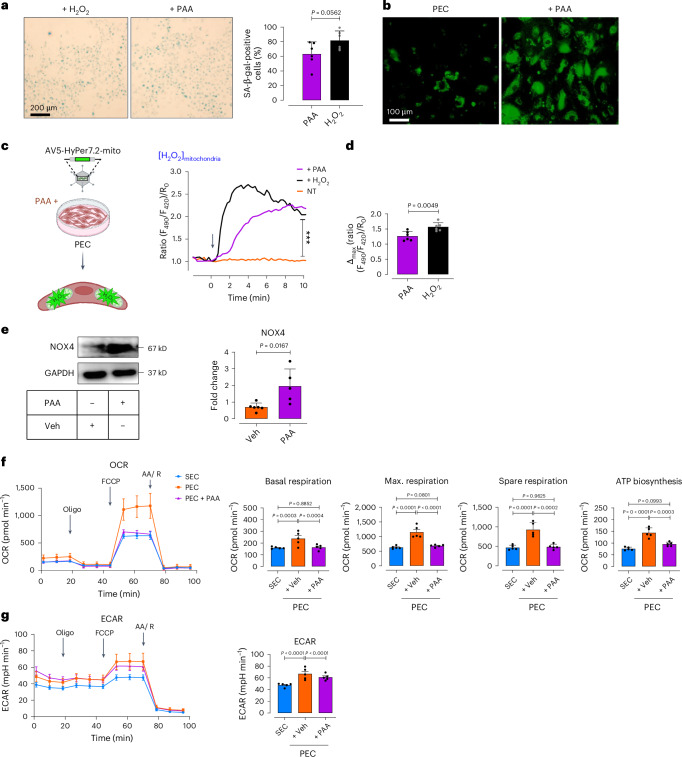
Fig. 4 PAA regulates premature EC senescence by H2O2-mediated mitochondrial impairment. a, SA-β-gal staining shows senescence-associated lysosomal alterations in Veh-treated PECs compared to PECs incubated with exogenous H2O2 (50 μM). Quantitative plots for SA-β-gal-positive cells (%) are shown (n = 6). b, CellRox Green staining reveals the generation of intracellular ROS, including H2O2, (as green fluorescence) in the presence or absence of PAA. c, Schematic diagram of the experimental setting: PECs were transduced with adenovirus 5 (AV5)-HyPer7.2 targeted to the cell mitochondria for further ratiometric fluorescence imaging to detect mitochondrial H2O2 generation in the presence of PAA. Right, the curves demonstrate significantly higher H2O2 responses in the mitochondria of HyPer7.2- transfected PECs following treatment with either PAA (n = 25) or exogenous H2O2 (n = 27) compared to vehicle (n = 24). d, Bar chart shows maximal mitochondrial H2O2 responses to PAA or exogenous H2O2 (n = 6). e, Immunoblot analysis demonstrates the expression of NOX4 in PECs (n = 5–6). f, Mitochondrial respiratory rates in PECs treated with either PAA or vehicle and in replicative SECs were measured using Seahorse flux analyzer by Cell Mito Stress kit (n = 5). Bar charts reveal oxygen consumption rate (OCR) represented by maximal, basal, and spare reserve, and ATP biosynthesis in PAA-exposed PECs compared to PECs incubated with vehicle. g, Glycolysis was measured by ECARs in vehicle- or PAA-treated PECs and replicative SECs under basal conditions (n = 5). Bar chart depicts ECAR in Veh-treated PECs compared to PAA-exposed PECs or replicative SECs (right). Data from in vitro cellular experiments represent triplicate biologically independent experiments. Scale bars, 100 and 200 μm. Error bars represent s.d. (a,d–g) or s.e.m. (c,f,g). P values were calculated using a two-tailed unpaired Student’s t-test (a,e), two-tailed Mann–Whitney U-test (d) and one-way ANOVA followed by Tukey’s post hoc test (c,f,g). Images created with BioRender.com (c). ***P < 0.001. Source data
Fig. 4 PAA regulates premature EC senescence by H2O2-mediated mitochondrial impairment. a, SA-β-gal staining shows senescence-associated lysosomal alterations in Veh-treated PECs compared to PECs incubated with exogenous H2O2 (50 μM). Quantitative plots for SA-β-gal-positive cells (%) are shown (n = 6). b, CellRox Green staining reveals the generation of intracellular ROS, including H2O2, (as green fluorescence) in the presence or absence of PAA. c, Schematic diagram of the experimental setting: PECs were transduced with adenovirus 5 (AV5)-HyPer7.2 targeted to the cell mitochondria for further ratiometric fluorescence imaging to detect mitochondrial H2O2 generation in the presence of PAA. Right, the curves demonstrate significantly higher H2O2 responses in the mitochondria of HyPer7.2- transfected PECs following treatment with either PAA (n = 25) or exogenous H2O2 (n = 27) compared to vehicle (n = 24). d, Bar chart shows maximal mitochondrial H2O2 responses to PAA or exogenous H2O2 (n = 6). e, Immunoblot analysis demonstrates the expression of NOX4 in PECs (n = 5–6). f, Mitochondrial respiratory rates in PECs treated with either PAA or vehicle and in replicative SECs were measured using Seahorse flux analyzer by Cell Mito Stress kit (n = 5). Bar charts reveal oxygen consumption rate (OCR) represented by maximal, basal, and spare reserve, and ATP biosynthesis in PAA-exposed PECs compared to PECs incubated with vehicle. g, Glycolysis was measured by ECARs in vehicle- or PAA-treated PECs and replicative SECs under basal conditions (n = 5). Bar chart depicts ECAR in Veh-treated PECs compared to PAA-exposed PECs or replicative SECs (right). Data from in vitro cellular experiments represent triplicate biologically independent experiments. Scale bars, 100 and 200 μm. Error bars represent s.d. (a,d–g) or s.e.m. (c,f,g). P values were calculated using a two-tailed unpaired Student’s t-test (a,e), two-tailed Mann–Whitney U-test (d) and one-way ANOVA followed by Tukey’s post hoc test (c,f,g). Images created with BioRender.com (c). ***P < 0.001. Source dataCC BY · PubMed Central
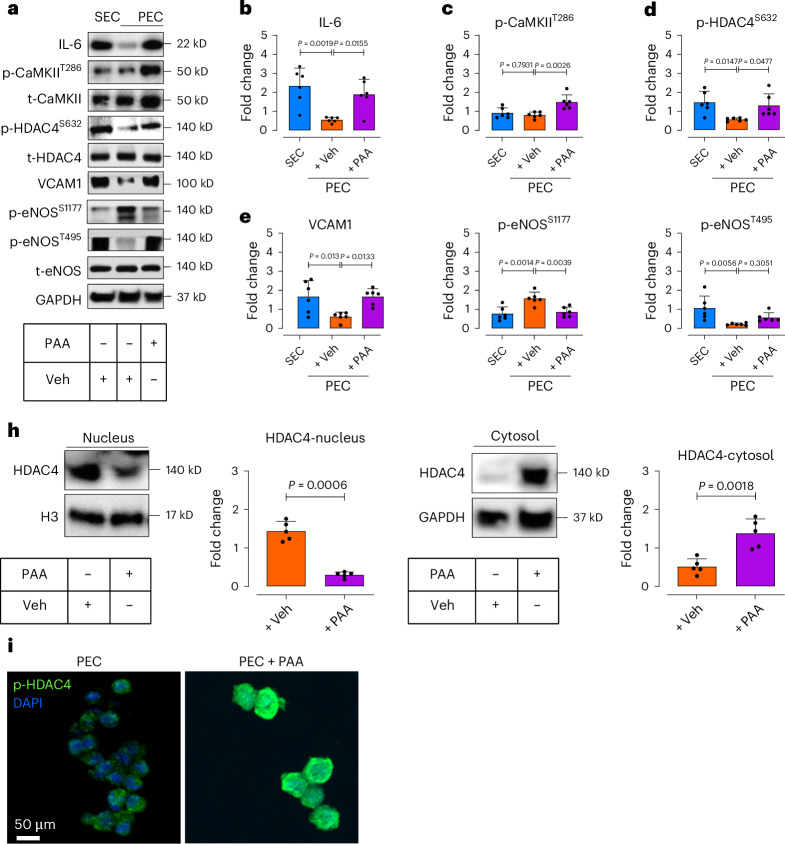
Fig. 5 PAA induces EC senescence through the SASP-epigenetic regulation. a–g, Immunoblotting represents the expression of IL-6 (b), CaMKII-mediated phosphorylation of HDAC4 at Ser632 (c,d), VCAM1 expression (e), post-transcriptional modifications of eNOS at Ser1177 and Thr495 (f,g) in response to PAA in PECs (n = 6). h, Immunoblots and quantitative plots reveal translocation of HDAC4, represented as decreased expression in the nucleus (left) and increased expression in the cytosol (right) in PECs in response to PAA (n = 5). i, p-HDAC4 immunostaining illustrates HDAC4 phosphorylation, facilitating its translocation toward the cell cytosol in PECs exposed to PAA (n = 6). Scale bar, 50 μm. Data from in vitro cellular experiments represent triplicate biologically independent experiments. Error bars represent s.d. (b–h). P values were calculated using one-way ANOVA followed by Tukey’s post hoc test (b–g) and a two-tailed unpaired Student’s t-test (h). Source data
Fig. 5 PAA induces EC senescence through the SASP-epigenetic regulation. a–g, Immunoblotting represents the expression of IL-6 (b), CaMKII-mediated phosphorylation of HDAC4 at Ser632 (c,d), VCAM1 expression (e), post-transcriptional modifications of eNOS at Ser1177 and Thr495 (f,g) in response to PAA in PECs (n = 6). h, Immunoblots and quantitative plots reveal translocation of HDAC4, represented as decreased expression in the nucleus (left) and increased expression in the cytosol (right) in PECs in response to PAA (n = 5). i, p-HDAC4 immunostaining illustrates HDAC4 phosphorylation, facilitating its translocation toward the cell cytosol in PECs exposed to PAA (n = 6). Scale bar, 50 μm. Data from in vitro cellular experiments represent triplicate biologically independent experiments. Error bars represent s.d. (b–h). P values were calculated using one-way ANOVA followed by Tukey’s post hoc test (b–g) and a two-tailed unpaired Student’s t-test (h). Source dataCC BY · PubMed Central
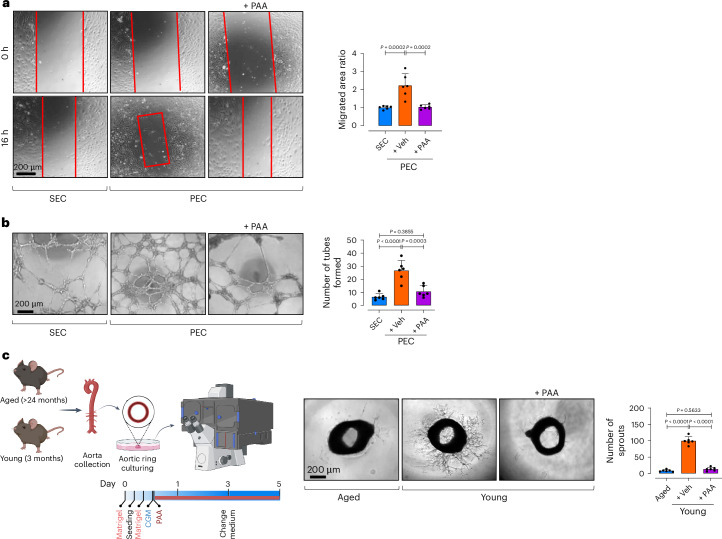
Fig. 6 PAA reduces EC proliferation and angiogenesis. a, Confocal micrographs depict cell migration, represented as areas of uncovered surface, in PECs treated with PAA or vehicle and in replicative SECs. Bar chart represents the ratio of cell migrated area (n = 6) (right). b, Confocal images represent two-dimensional Matrigel tube formation of ECs. Quantitative plot shows numbers of tubes formed by ECs (n = 6) (right). c, Confocal micrographs of aortic rings from aged and young mice represent angiogenic capacity in response to PAA or vehicle. Quantitative plot is shown for numbers of aortic endothelial sprouts (n = 6) (right). Error bars represent s.d. (a–c). P values were calculated using one-way ANOVA followed by Tukey’s post hoc test (a–c). Image created with BioRender.com (c). Source data
Fig. 6 PAA reduces EC proliferation and angiogenesis. a, Confocal micrographs depict cell migration, represented as areas of uncovered surface, in PECs treated with PAA or vehicle and in replicative SECs. Bar chart represents the ratio of cell migrated area (n = 6) (right). b, Confocal images represent two-dimensional Matrigel tube formation of ECs. Quantitative plot shows numbers of tubes formed by ECs (n = 6) (right). c, Confocal micrographs of aortic rings from aged and young mice represent angiogenic capacity in response to PAA or vehicle. Quantitative plot is shown for numbers of aortic endothelial sprouts (n = 6) (right). Error bars represent s.d. (a–c). P values were calculated using one-way ANOVA followed by Tukey’s post hoc test (a–c). Image created with BioRender.com (c). Source dataCC BY · PubMed Central
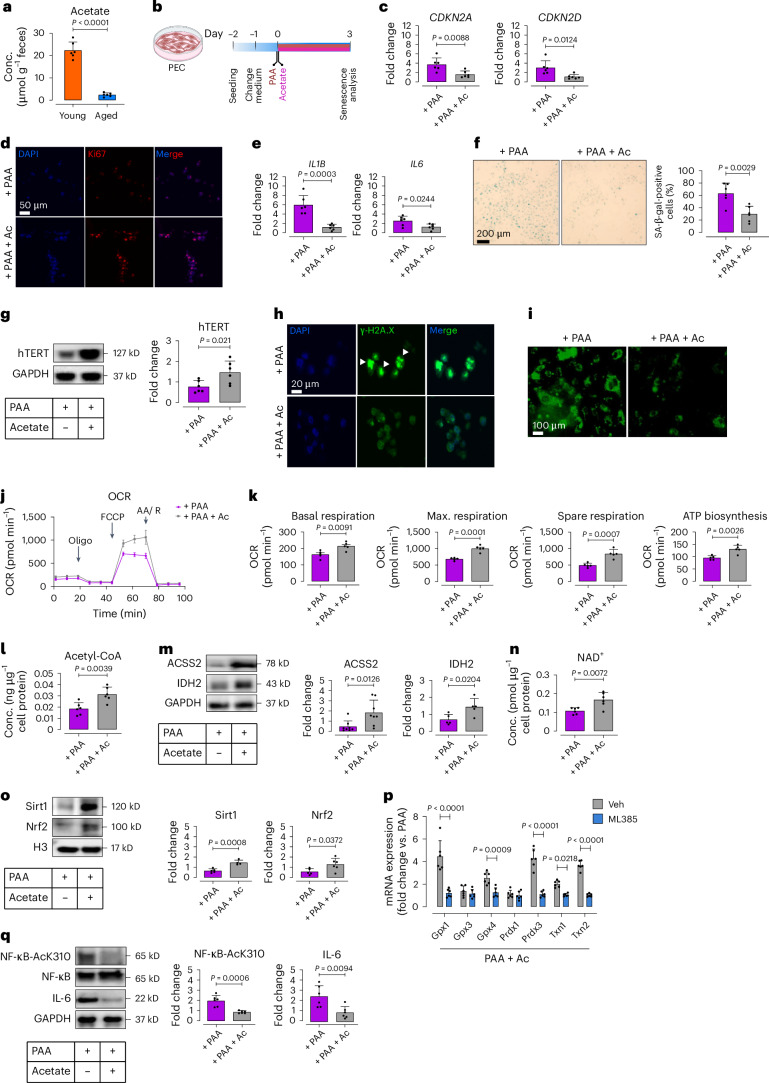
Fig. 7 Acetate rescues PAA-induced EC senescence through senomorphic effects. a, Bar charts represent fecal acetate levels in aged mice compared to young mice, as quantified by HPLC-RI (n = 6). b, Schematic of experimental setting. PECs were co-treated with PAA (10 μM) and sodium acetate (3 μM) for 72 h, followed by senescence analysis. c, qPCR analyses reveal transcriptional changes of CDK inhibitors CDKN2A and CDKN2D (n = 6). d, Ki67 immunostaining represents its expression (n = 6). e, Bar charts represent transcriptional changes of the SASP components IL1Β and IL6, as assessed by qPCR (n = 6). f, Representative images of SA-β-gal staining (left) and bar chart (right) demonstrate senescence-associated lysosomal alterations (n = 6). g, Immunoblots reveal the expression of hTERT, indicating telomere length restoration (n = 6). h, Representative immunostaining images show γ-H2A.X foci, as a DDR marker (n = 6). i, CellRox Green staining demonstrates intracellular ROS generation (n = 6). j,k, Seahorse bioenergetic analysis reveals mitochondrial OCR in PAA- versus acetate + PAA-treated PECs. Bar charts show basal and maximal OCR, spare reserve, and ATP production (n = 5). l, Fluorometric assay reveals cellular acetyl-coA concentrations (n = 6). m, Immunoblots represent the expression of acetyl-coA synthetase 2 (ACSS2) and isocitrate dehydrogenase 2 (IDH2) (n = 5–8). n, Bar charts demonstrate NAD+ levels, as quantified by colorimetric assay (n = 6). o, Immunoblots represent the expression of NAD+-dependent Sirt1 and the redox regulator Nrf2 (n = 5). p, qPCR analysis reveals transcription of the Nrf2-regulated antioxidant enzymes glutathione peroxidase 1 and 4 (Gpx1 and Gpx4), peroxiredoxin 3 (Prdx3), and thioredoxin 1 and 2 (Txn1 and Txn2) in PAA + sodium acetate-exposed PECs in the presence or absence of the pharmacological Nrf2 inhibitor, ML385 (5 μM for 24 h) (n = 6). q, Immunoblots demonstrate the acetylation level of the heterodimeric subunit of NF-κB at Lys310, along with the expression of its downstream inflammatory cytokine IL-6 (n = 6). Scale bars, 20, 50 and 100 μm. Error bars represent s.d. (a,c,e–g,k–q) or s.e.m. (j,k). Data represent triplicate biologically independent experiments. P values were calculated using a two-tailed unpaired Student’s t-test (a,c,e–g,k–o,q) and one-way ANOVA followed by Tukey’s post hoc test (p). Image created with BioRender.com (b). Source data
Fig. 7 Acetate rescues PAA-induced EC senescence through senomorphic effects. a, Bar charts represent fecal acetate levels in aged mice compared to young mice, as quantified by HPLC-RI (n = 6). b, Schematic of experimental setting. PECs were co-treated with PAA (10 μM) and sodium acetate (3 μM) for 72 h, followed by senescence analysis. c, qPCR analyses reveal transcriptional changes of CDK inhibitors CDKN2A and CDKN2D (n = 6). d, Ki67 immunostaining represents its expression (n = 6). e, Bar charts represent transcriptional changes of the SASP components IL1Β and IL6, as assessed by qPCR (n = 6). f, Representative images of SA-β-gal staining (left) and bar chart (right) demonstrate senescence-associated lysosomal alterations (n = 6). g, Immunoblots reveal the expression of hTERT, indicating telomere length restoration (n = 6). h, Representative immunostaining images show γ-H2A.X foci, as a DDR marker (n = 6). i, CellRox Green staining demonstrates intracellular ROS generation (n = 6). j,k, Seahorse bioenergetic analysis reveals mitochondrial OCR in PAA- versus acetate + PAA-treated PECs. Bar charts show basal and maximal OCR, spare reserve, and ATP production (n = 5). l, Fluorometric assay reveals cellular acetyl-coA concentrations (n = 6). m, Immunoblots represent the expression of acetyl-coA synthetase 2 (ACSS2) and isocitrate dehydrogenase 2 (IDH2) (n = 5–8). n, Bar charts demonstrate NAD+ levels, as quantified by colorimetric assay (n = 6). o, Immunoblots represent the expression of NAD+-dependent Sirt1 and the redox regulator Nrf2 (n = 5). p, qPCR analysis reveals transcription of the Nrf2-regulated antioxidant enzymes glutathione peroxidase 1 and 4 (Gpx1 and Gpx4), peroxiredoxin 3 (Prdx3), and thioredoxin 1 and 2 (Txn1 and Txn2) in PAA + sodium acetate-exposed PECs in the presence or absence of the pharmacological Nrf2 inhibitor, ML385 (5 μM for 24 h) (n = 6). q, Immunoblots demonstrate the acetylation level of the heterodimeric subunit of NF-κB at Lys310, along with the expression of its downstream inflammatory cytokine IL-6 (n = 6). Scale bars, 20, 50 and 100 μm. Error bars represent s.d. (a,c,e–g,k–q) or s.e.m. (j,k). Data represent triplicate biologically independent experiments. P values were calculated using a two-tailed unpaired Student’s t-test (a,c,e–g,k–o,q) and one-way ANOVA followed by Tukey’s post hoc test (p). Image created with BioRender.com (b). Source dataCC BY · PubMed Central
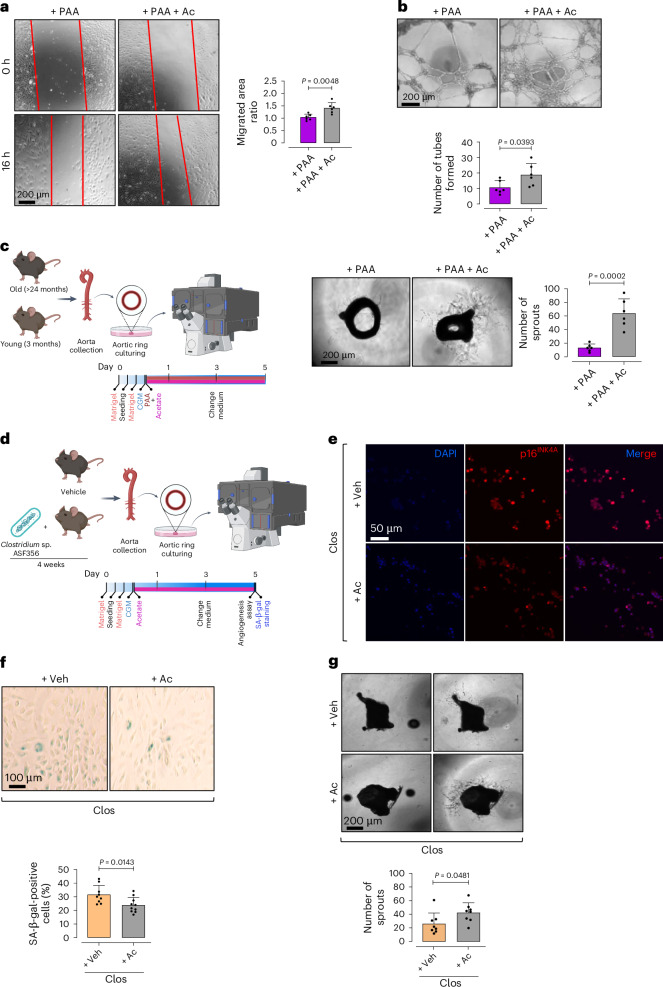
Fig. 8 Acetate rescues PAA-induced angiogenic incompetence. a–c, Confocal micrographs depict the effects of sodium acetate on endothelial angiogenic capacity, represented by cell migration (a), tube formation (b) and aortic endothelial sprouting (c). Quantitative plots represent migrated area ratio (a), numbers of tubes formed (b) and numbers of endothelial sprouts from aortic rings (c) in acetate + PAA-treated group compared to PAA-exposed group (n = 5–6). d, Schematic diagram of the experimental setting. Aortas were collected from Clos-colonized mice for ex vivo aortic EC sprouting assay or isolation of ECs, followed by p16INK4A immunostaining and SA-β-gal staining, in the presence or absence of sodium acetate. e,f, Immunostaining reveals the expression of proliferative arrest marker p16INK4A (e) and SA-β-gal positivity, represented as SA-β-gal+ cells (%) (f) (n = 5–6). g, Confocal micrographs of aortic rings represent angiogenic capacity in aortas obtained from Clos-colonized mice in response to sodium acetate versus vehicle. Quantitative plot is shown for the number of aortic endothelial sprouts (n = 5–6) (right). Scale bars, 50, 100 and 200 μm. Error bars represent s.d. (a–c,f,g). Data represent triplicate biologically independent experiments. P values were calculated using a two-tailed unpaired Student’s t-test. Images created with BioRender.com (c,d). Source data
Fig. 8 Acetate rescues PAA-induced angiogenic incompetence. a–c, Confocal micrographs depict the effects of sodium acetate on endothelial angiogenic capacity, represented by cell migration (a), tube formation (b) and aortic endothelial sprouting (c). Quantitative plots represent migrated area ratio (a), numbers of tubes formed (b) and numbers of endothelial sprouts from aortic rings (c) in acetate + PAA-treated group compared to PAA-exposed group (n = 5–6). d, Schematic diagram of the experimental setting. Aortas were collected from Clos-colonized mice for ex vivo aortic EC sprouting assay or isolation of ECs, followed by p16INK4A immunostaining and SA-β-gal staining, in the presence or absence of sodium acetate. e,f, Immunostaining reveals the expression of proliferative arrest marker p16INK4A (e) and SA-β-gal positivity, represented as SA-β-gal+ cells (%) (f) (n = 5–6). g, Confocal micrographs of aortic rings represent angiogenic capacity in aortas obtained from Clos-colonized mice in response to sodium acetate versus vehicle. Quantitative plot is shown for the number of aortic endothelial sprouts (n = 5–6) (right). Scale bars, 50, 100 and 200 μm. Error bars represent s.d. (a–c,f,g). Data represent triplicate biologically independent experiments. P values were calculated using a two-tailed unpaired Student’s t-test. Images created with BioRender.com (c,d). Source dataCC BY · PubMed Central
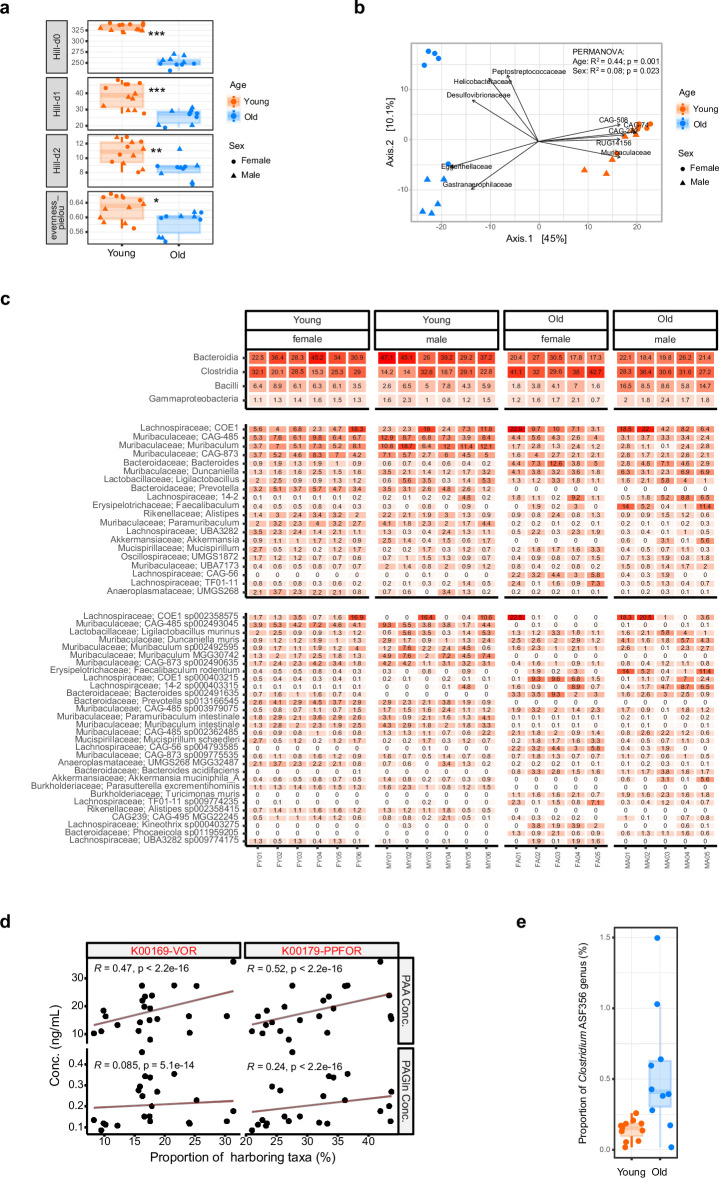
Extended Data Fig. 1 Age-associated gut microbiota alterations. a, Box plots representing alpha diversity in feces of female and male, old and young C57BL/6J mice measured by Hill-d0 to 2 and Pielou’s evenness indices (n = 5–6). b, Principal coordinate analysis (PCoA) plot showing beta diversity based on the community level changes in old and young mice (n = 5–6). c, Heatmap depicting differentially abundant microbial profiles at the strain level (each color represents one bacterial taxa) in the fecal microbiota of female and male, old versus young mice (n = 5–6). d, Gene–metabolite interactions explain a positive correlation of the proportion (%) of either VOR- or PPFOR-harboring taxa and plasma PAA levels in aged mice. Nevertheless, the lowermost chart shows non-significant association of VOR or PPFOR homologs and plasma PAGln levels in these mice (n = 5–6). e, Distribution of the Clostridium genus in mouse microbiomes. The box plots show the higher proportion (%) of taxa belonging to the Clostridium genus in the microbiome of aged mice compared to young mice (n = 5–6). Error bars represent SEM (a, b, d, e). Data were analyzed using Kruskal–Wallis statistical test (a), Atchinson distance and permutational multivariate analysis of variance (PERMANOVA) (b), partial Spearman’s correlation test tests (d), and two-tailed unpaired Student’s t-test (e). (*P < 0.05, **P < 0.01, ***P < 0.001). Source data are provided as a Source Data file. Source data
Extended Data Fig. 1 Age-associated gut microbiota alterations. a, Box plots representing alpha diversity in feces of female and male, old and young C57BL/6J mice measured by Hill-d0 to 2 and Pielou’s evenness indices (n = 5–6). b, Principal coordinate analysis (PCoA) plot showing beta diversity based on the community level changes in old and young mice (n = 5–6). c, Heatmap depicting differentially abundant microbial profiles at the strain level (each color represents one bacterial taxa) in the fecal microbiota of female and male, old versus young mice (n = 5–6). d, Gene–metabolite interactions explain a positive correlation of the proportion (%) of either VOR- or PPFOR-harboring taxa and plasma PAA levels in aged mice. Nevertheless, the lowermost chart shows non-significant association of VOR or PPFOR homologs and plasma PAGln levels in these mice (n = 5–6). e, Distribution of the Clostridium genus in mouse microbiomes. The box plots show the higher proportion (%) of taxa belonging to the Clostridium genus in the microbiome of aged mice compared to young mice (n = 5–6). Error bars represent SEM (a, b, d, e). Data were analyzed using Kruskal–Wallis statistical test (a), Atchinson distance and permutational multivariate analysis of variance (PERMANOVA) (b), partial Spearman’s correlation test tests (d), and two-tailed unpaired Student’s t-test (e). (*P < 0.05, **P < 0.01, ***P < 0.001). Source data are provided as a Source Data file. Source dataCC BY · PubMed Central
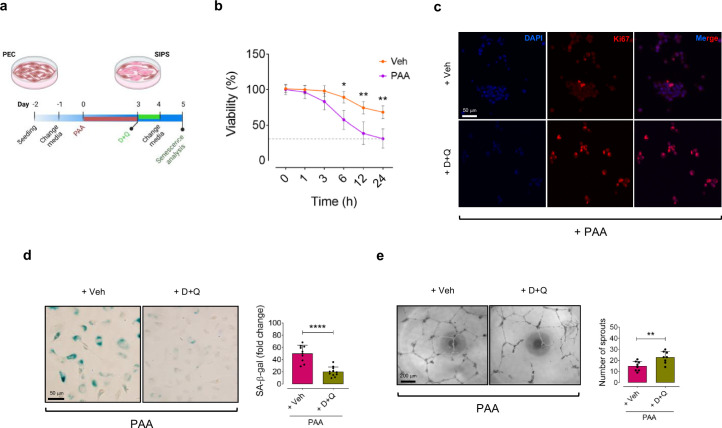
Extended Data Fig. 2 D + Q reduces senescence in PAA-exposed ECs. a, Schematic diagram of the experimental setting: PECs were treated with PAA (10 μM, for 72 h) in the presence or absence of Dasatinib+Quercetin (D + Q: 500 nM + 20 μM, for 24 h), followed by assessment of senescence phenotype and tube formation. b, Cell counts demonstrate that D + Q significantly reduces the viability percentage (%) of PAA-exposed PECs over Veh-treated PECs. The cells at passages 3 to 5 were characterized as PEC (n = 6). c,d, D + Q ameliorates PAA-induced senescence phenotype in HAECs: (c) Ki67 immunostaining shows that D + Q markedly increases the number of Ki67+ PECs (n = 6); (d) Representative images of SA-β-gal staining demonstrates that D + Q significantly decreases the number of SA-β-gal+ cells (%) (n = 6). e, Confocal images represent the 2D matrigel tube formation of PAA-exposed PECs treated with D + Q or vehicle. Right, quantitative plot shows a significantly higher number of tubes formed by D + Q-treated PECs compared to vehicle counterparts (n = 8). Scale bar, 50 and 200 μm. Experiments were triplicated independently. Statistical analysis was performed with a one-way ANOVA followed by Tukey’s post hoc test (b) and a two-tailed unpaired Student’s t-test (c, d). Images created with BioRender.com (a). (*P < 0.05, **P < 0.01, ****P < 0.0001). Source data
Extended Data Fig. 2 D + Q reduces senescence in PAA-exposed ECs. a, Schematic diagram of the experimental setting: PECs were treated with PAA (10 μM, for 72 h) in the presence or absence of Dasatinib+Quercetin (D + Q: 500 nM + 20 μM, for 24 h), followed by assessment of senescence phenotype and tube formation. b, Cell counts demonstrate that D + Q significantly reduces the viability percentage (%) of PAA-exposed PECs over Veh-treated PECs. The cells at passages 3 to 5 were characterized as PEC (n = 6). c,d, D + Q ameliorates PAA-induced senescence phenotype in HAECs: (c) Ki67 immunostaining shows that D + Q markedly increases the number of Ki67+ PECs (n = 6); (d) Representative images of SA-β-gal staining demonstrates that D + Q significantly decreases the number of SA-β-gal+ cells (%) (n = 6). e, Confocal images represent the 2D matrigel tube formation of PAA-exposed PECs treated with D + Q or vehicle. Right, quantitative plot shows a significantly higher number of tubes formed by D + Q-treated PECs compared to vehicle counterparts (n = 8). Scale bar, 50 and 200 μm. Experiments were triplicated independently. Statistical analysis was performed with a one-way ANOVA followed by Tukey’s post hoc test (b) and a two-tailed unpaired Student’s t-test (c, d). Images created with BioRender.com (a). (*P < 0.05, **P < 0.01, ****P < 0.0001). Source dataCC BY · PubMed Central
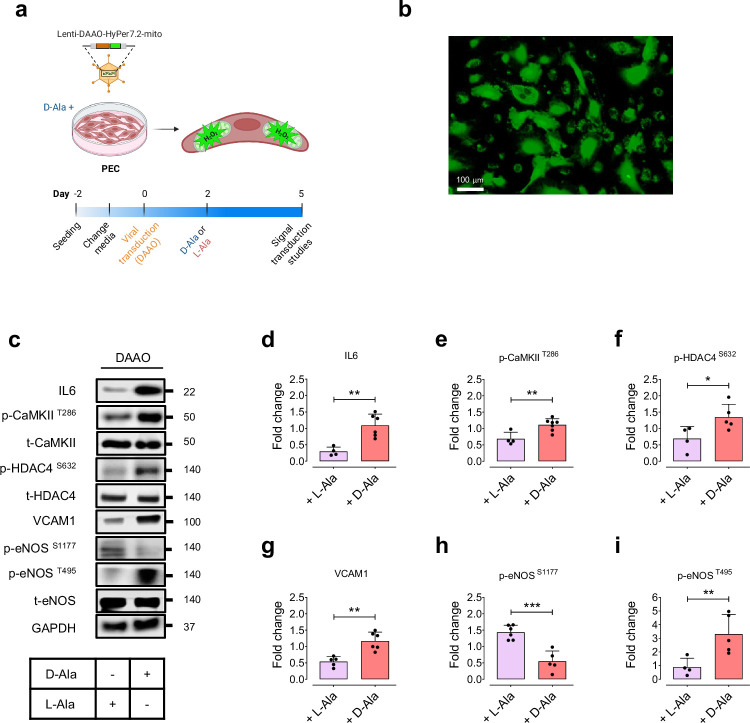
Extended Data Fig. 3 Chemogenetic mitochondrial H2O2 regulates endothelial NO signaling through IL-6-HDAC4 pathway. a, Schematic diagram of the experimental setting: PECs were transduced with lentiviral vectors encoding D-amino acid oxidase (DAAO)-HyPer7.2 targeted to the cell mitochondria for generation of mitochondrial H2O2 in the presence of D-alanine (10 mM) for 72 h. b, Representative widefield ratiometric HyPer7.2 images of PECs transduced with Lenti-DAAO-HyPer7.2-mito constructs. c-i, Immunoblots (c) and quantitative plots show that chemogenetic mitochondrial H2O2, produced by DAAO in response to D-alanine but not L-alanine, orchestrates IL-6-mediated CaMKII-HDAC4 phosphorylation and the subsequent VCAM1-regulated eNOS phosphorylation at Ser1177 and Thr495 in PECs (n = 4–6). Scale bar, 100 μm. Error bars represent SD (d–i). Data represent triplicated biologically independent experiments. P values were calculated using a two-tailed unpaired Student’s t-test (d–i). Images created with BioRender.com (a). (*P < 0.05, **P < 0.01, ***P < 0.001). Source data
Extended Data Fig. 3 Chemogenetic mitochondrial H2O2 regulates endothelial NO signaling through IL-6-HDAC4 pathway. a, Schematic diagram of the experimental setting: PECs were transduced with lentiviral vectors encoding D-amino acid oxidase (DAAO)-HyPer7.2 targeted to the cell mitochondria for generation of mitochondrial H2O2 in the presence of D-alanine (10 mM) for 72 h. b, Representative widefield ratiometric HyPer7.2 images of PECs transduced with Lenti-DAAO-HyPer7.2-mito constructs. c-i, Immunoblots (c) and quantitative plots show that chemogenetic mitochondrial H2O2, produced by DAAO in response to D-alanine but not L-alanine, orchestrates IL-6-mediated CaMKII-HDAC4 phosphorylation and the subsequent VCAM1-regulated eNOS phosphorylation at Ser1177 and Thr495 in PECs (n = 4–6). Scale bar, 100 μm. Error bars represent SD (d–i). Data represent triplicated biologically independent experiments. P values were calculated using a two-tailed unpaired Student’s t-test (d–i). Images created with BioRender.com (a). (*P < 0.05, **P < 0.01, ***P < 0.001). Source dataCC BY · PubMed Central
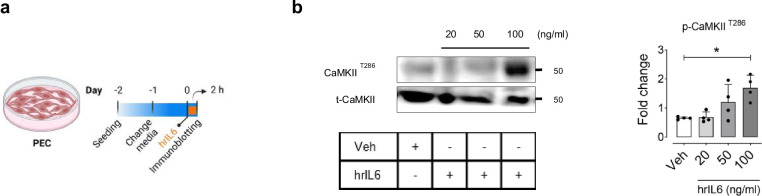
Extended Data Fig. 4 hrIL6 regulates CaMKII post-translation modification in ECs. a, Schematic diagram of the experimental setting: PECs were treated with the human recombinant IL-6 (hrIL6) at specific concentrations (0, 20, 50, 100 ng/ml) for 2 h. b, Immunoblots (Left) and quantitative plots (Right) demonstrate that hrIL6 dose-dependently increases CaMKII phosphorylation at Thr286 in PECs (n = 6). Error bars represent SD (b). Experiments were triplicated independently. P values were calculated using one-way ANOVA followed by Tukey’s post hoc test (b). Images created with BioRender.com (a). (***P < 0.001). Source data are provided as a Source Data file. Source data
Extended Data Fig. 4 hrIL6 regulates CaMKII post-translation modification in ECs. a, Schematic diagram of the experimental setting: PECs were treated with the human recombinant IL-6 (hrIL6) at specific concentrations (0, 20, 50, 100 ng/ml) for 2 h. b, Immunoblots (Left) and quantitative plots (Right) demonstrate that hrIL6 dose-dependently increases CaMKII phosphorylation at Thr286 in PECs (n = 6). Error bars represent SD (b). Experiments were triplicated independently. P values were calculated using one-way ANOVA followed by Tukey’s post hoc test (b). Images created with BioRender.com (a). (***P < 0.001). Source data are provided as a Source Data file. Source dataCC BY · PubMed Central
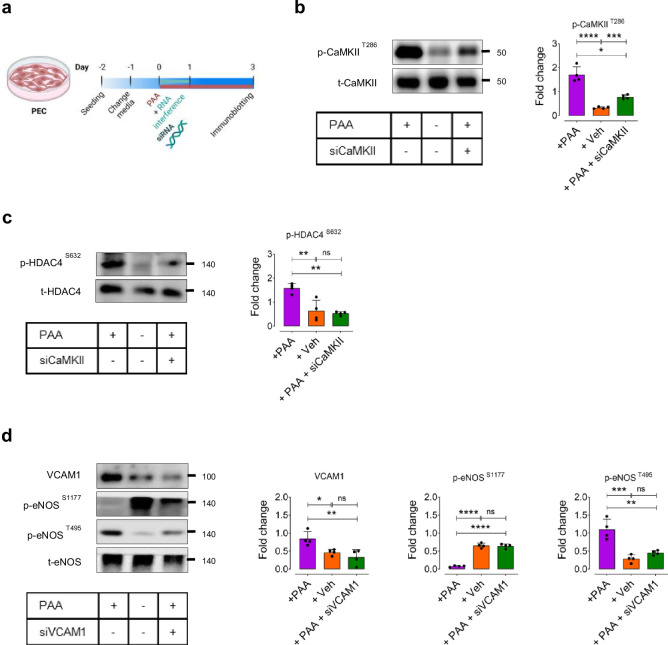
Extended Data Fig. 5 CaMKII-mediated SASP pathway underlies PAA-induced EC dysfunction. a, Schematic diagram of the experimental setting: PECs were transfected with siCaMKII or siVCAM1 (for 24 h) in the presence or absence of PAA (10 μM, for 72 h). b, c, Immunoblots (left) and quantitative plots (right) characterizing the effects of PAA on the PAA-induced post-translational modifications of CaMKII (b) and its downstream epigenetic regulator HDAC4 (c) using CaMKII knockdown approach in PECs (n = 4). d, Analysis of VCAM1 expression and eNOS phosphorylation at Ser1177 and Thr495 in siVCAM1-transfected PECs in the presence or absence of PAA (n = 4). Error bars represent SD (b–d). Data represent triplicated biologically independent experiments. P values were calculated using one-way ANOVA followed by Tukey’s post hoc test (b–d). Images created with BioRender.com (a). (*P < 0.05, **P < 0.01, ***P < 0.001, ****P < 0.0001, ns, not significant). Source data are provided as a Source Data file. Source data
Extended Data Fig. 5 CaMKII-mediated SASP pathway underlies PAA-induced EC dysfunction. a, Schematic diagram of the experimental setting: PECs were transfected with siCaMKII or siVCAM1 (for 24 h) in the presence or absence of PAA (10 μM, for 72 h). b, c, Immunoblots (left) and quantitative plots (right) characterizing the effects of PAA on the PAA-induced post-translational modifications of CaMKII (b) and its downstream epigenetic regulator HDAC4 (c) using CaMKII knockdown approach in PECs (n = 4). d, Analysis of VCAM1 expression and eNOS phosphorylation at Ser1177 and Thr495 in siVCAM1-transfected PECs in the presence or absence of PAA (n = 4). Error bars represent SD (b–d). Data represent triplicated biologically independent experiments. P values were calculated using one-way ANOVA followed by Tukey’s post hoc test (b–d). Images created with BioRender.com (a). (*P < 0.05, **P < 0.01, ***P < 0.001, ****P < 0.0001, ns, not significant). Source data are provided as a Source Data file. Source dataCC BY · PubMed Central
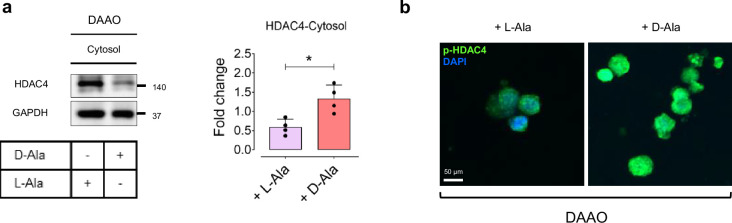
Extended Data Fig. 6 H2O2 orchestrates HDAC4 phosphorylation and its nuclear export. a, Immunoblots (Left) and quantitative plot (Right) reveal HDAC4 unclear export, represented as an increased expression in the cytosol in response to intracellular H2O2 generated by DAAO in the presence of D-alanine (10 mM, for 72 h) in PECs (n = 4). b, p-HDAC4 immunostaining shows that intracellular H2O2 markedly increases HDAC4 phosphorylation that facilitates its translocation towards the cell cytosol in PECs (n = 6). Scale bar, 50 μm. Error bars represent SD (a). Data represent triplicated biologically independent experiments. P values were calculated using a two-tailed unpaired Student’s t-test (a). (*P < 0.05). Source data are provided as a Source Data file. Source data
Extended Data Fig. 6 H2O2 orchestrates HDAC4 phosphorylation and its nuclear export. a, Immunoblots (Left) and quantitative plot (Right) reveal HDAC4 unclear export, represented as an increased expression in the cytosol in response to intracellular H2O2 generated by DAAO in the presence of D-alanine (10 mM, for 72 h) in PECs (n = 4). b, p-HDAC4 immunostaining shows that intracellular H2O2 markedly increases HDAC4 phosphorylation that facilitates its translocation towards the cell cytosol in PECs (n = 6). Scale bar, 50 μm. Error bars represent SD (a). Data represent triplicated biologically independent experiments. P values were calculated using a two-tailed unpaired Student’s t-test (a). (*P < 0.05). Source data are provided as a Source Data file. Source dataCC BY · PubMed Central
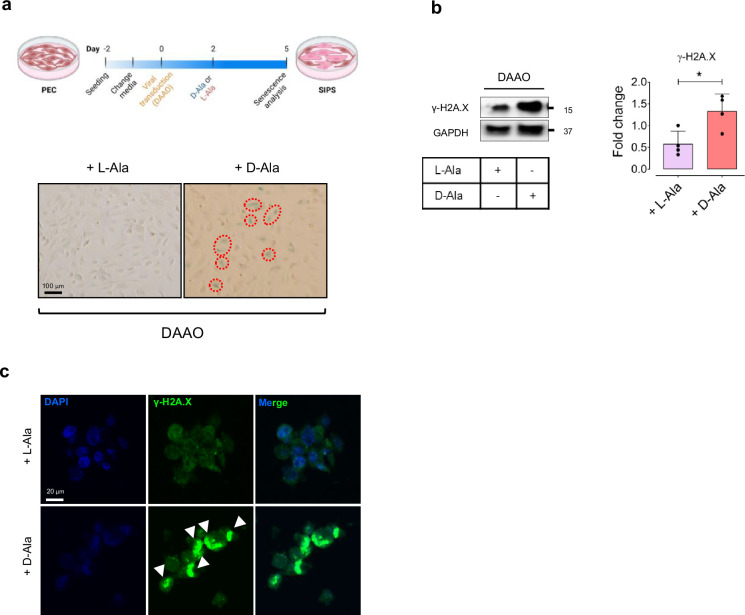
Extended Data Fig. 7 Chemogenetic H2O2 promotes EC senescence. a, Schematic diagram of the experimental setting: PECs were transduced with lentiviral vectors encoding D-amino acid oxidase (DAAO) targeted to the cell mitochondria for generation of mitochondrial H2O2 in the presence D-alanine (10 mM) for 72 h. Representative images of SA-β-gal staining demonstrates that DAAO-mediated mitochondrial H2O2 induced cellular senescence in PECs, as shown by increased SA-β-gal-positive cells (%) (n = 6). b,c, Immunoblots (b) and γ-H2A.X immunostaining images (c) reveal a marked increase in DDR following mitochondrial H2O2 production in DAAO-transduced PECs incubated with D-alanine (n = 4–6). Scale bar, 20 and 100 μm. Red circles indicate SA-β-gal-positive cells. Error bars represent SD (b). Data represent triplicated biologically independent experiments. P values were calculated using a two-tailed unpaired Student’s t-test (b). Images created with BioRender.com (a). (*P < 0.05). Source data are provided as a Source Data file. Source data
Extended Data Fig. 7 Chemogenetic H2O2 promotes EC senescence. a, Schematic diagram of the experimental setting: PECs were transduced with lentiviral vectors encoding D-amino acid oxidase (DAAO) targeted to the cell mitochondria for generation of mitochondrial H2O2 in the presence D-alanine (10 mM) for 72 h. Representative images of SA-β-gal staining demonstrates that DAAO-mediated mitochondrial H2O2 induced cellular senescence in PECs, as shown by increased SA-β-gal-positive cells (%) (n = 6). b,c, Immunoblots (b) and γ-H2A.X immunostaining images (c) reveal a marked increase in DDR following mitochondrial H2O2 production in DAAO-transduced PECs incubated with D-alanine (n = 4–6). Scale bar, 20 and 100 μm. Red circles indicate SA-β-gal-positive cells. Error bars represent SD (b). Data represent triplicated biologically independent experiments. P values were calculated using a two-tailed unpaired Student’s t-test (b). Images created with BioRender.com (a). (*P < 0.05). Source data are provided as a Source Data file. Source dataCC BY · PubMed Central
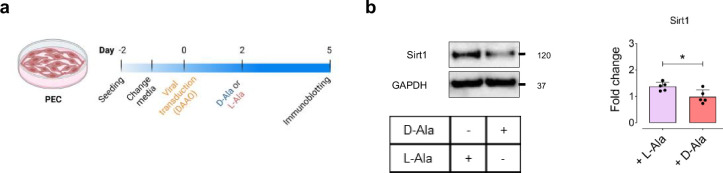
Extended Data Fig. 8 Mitochondrial H2O2 suppresses Sirt1 in ECs. a, Schematic diagram of the experimental setting: PECs were transduced with lentiviral vector encoding DAAO-mito, followed by treatment with D-alanine (10 mM) for 72 h for generation of H2O2 in cell mitochondria. b, Immunoblots (Left) and quantitative plots (Right) demonstrate that mitochondrial H2O2 significantly reduces Sirt1 expression in PECs (n = 5–6). Error bars represent SD (b). Data represent triplicated biologically independent experiments. P values were calculated using a two-tailed unpaired Student’s t-test (b). Images created with BioRender.com (a). (*P < 0.05). Source data are provided as a Source Data file. Source data
Extended Data Fig. 8 Mitochondrial H2O2 suppresses Sirt1 in ECs. a, Schematic diagram of the experimental setting: PECs were transduced with lentiviral vector encoding DAAO-mito, followed by treatment with D-alanine (10 mM) for 72 h for generation of H2O2 in cell mitochondria. b, Immunoblots (Left) and quantitative plots (Right) demonstrate that mitochondrial H2O2 significantly reduces Sirt1 expression in PECs (n = 5–6). Error bars represent SD (b). Data represent triplicated biologically independent experiments. P values were calculated using a two-tailed unpaired Student’s t-test (b). Images created with BioRender.com (a). (*P < 0.05). Source data are provided as a Source Data file. Source dataCC BY · PubMed Central
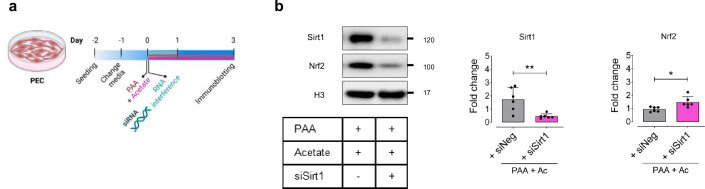
Extended Data Fig. 9 Acetate regulates Nrf2 by Sirt1 modulation in ECs. a, Schematic diagram of the experimental setting: PECs were transfected with siNeg or siSirt1 (for 24 h) in the presence of PAA plus sodium acetate (10 μM + 3 μM, for 72 h). b, Immunoblots (Left) and quantitative plots (Right) show that silencing of Sirt1 (by siSirt1) significantly reduces the expression of Sirt1 and Nrf2 (deacetylated form) in the nuclei of PECs treated with PAA plus sodium acetate compared to those transfected with siNeg (n = 6). Error bars represent SD (b). Data represent triplicated biologically independent experiments. P values were calculated using a two-tailed unpaired Student’s t-test (b). Images created with BioRender.com (a). (*P < 0.05, **P < 0.01). Source data are provided as a Source Data file. Source data
Extended Data Fig. 9 Acetate regulates Nrf2 by Sirt1 modulation in ECs. a, Schematic diagram of the experimental setting: PECs were transfected with siNeg or siSirt1 (for 24 h) in the presence of PAA plus sodium acetate (10 μM + 3 μM, for 72 h). b, Immunoblots (Left) and quantitative plots (Right) show that silencing of Sirt1 (by siSirt1) significantly reduces the expression of Sirt1 and Nrf2 (deacetylated form) in the nuclei of PECs treated with PAA plus sodium acetate compared to those transfected with siNeg (n = 6). Error bars represent SD (b). Data represent triplicated biologically independent experiments. P values were calculated using a two-tailed unpaired Student’s t-test (b). Images created with BioRender.com (a). (*P < 0.05, **P < 0.01). Source data are provided as a Source Data file. Source dataCC BY · PubMed Central
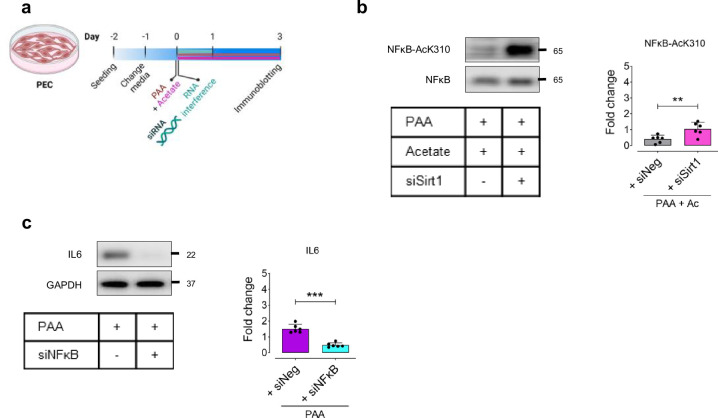
Extended Data Fig. 10 Acetate-mediated SASP downregulation is dependent on Sirt1 in ECs. a, Schematic diagram of the experimental setting: PECs were transfected with siNeg, siSirt1, or siNFκB (for 24 h) in the presence of PAA plus sodium acetate (10 μM + 3 μM, for 72 h) or PAA alone (10 μM, for 72 h). b, Immunoblots (top) and quantitative plots (bottom) demonstrate that Sirt1 knockdown markedly increases NFκB acetylation at Lys310 in PECs incubated with PAA plus sodium acetate compared to siNeg-transfected counterparts (n = 6). c, Immunoblots show that the SASP component IL-6 is downregulated in siNFκB-transfected PECs in the presence of PAA (n = 6). Error bars represent SD (b,c). Data represent triplicated biologically independent experiments. P values were calculated using a two-tailed unpaired Student’s t-test (b,c). Images created with BioRender.com (a). (**P < 0.01, ***P < 0.001). Source data are provided as a Source Data file. Source data
Extended Data Fig. 10 Acetate-mediated SASP downregulation is dependent on Sirt1 in ECs. a, Schematic diagram of the experimental setting: PECs were transfected with siNeg, siSirt1, or siNFκB (for 24 h) in the presence of PAA plus sodium acetate (10 μM + 3 μM, for 72 h) or PAA alone (10 μM, for 72 h). b, Immunoblots (top) and quantitative plots (bottom) demonstrate that Sirt1 knockdown markedly increases NFκB acetylation at Lys310 in PECs incubated with PAA plus sodium acetate compared to siNeg-transfected counterparts (n = 6). c, Immunoblots show that the SASP component IL-6 is downregulated in siNFκB-transfected PECs in the presence of PAA (n = 6). Error bars represent SD (b,c). Data represent triplicated biologically independent experiments. P values were calculated using a two-tailed unpaired Student’s t-test (b,c). Images created with BioRender.com (a). (**P < 0.01, ***P < 0.001). Source data are provided as a Source Data file. Source dataCC BY · PubMed Central

Verification

Claims the paper makes

The claims and statistics of this paper haven’t been checked yet.

Run the check — free, no account needed. It reads the open-access text and checks the sources it cites.

A few free checks a day · papers already verified open instantly · results are public

Claims other papers make about this one

Each is checked against this paper’s own text: does it say what the citing paper says it does?

Self-check

Percentages, sums and reported differences re-computed from the paper’s own numbers.

The self-check needs the paper’s full text.

Citations

Cites

Research works printed but not linked: 58

  1. Bloom, S. I. et al. Mechanisms and consequences of endothelial cell senescence. Nat. Rev. Cardiol. 20, 38–51 (2023). · DOI
  2. Yrrell, D. J. & Goldstein, D. R. Ageing and atherosclerosis: vascular intrinsic and extrinsic factors and potential role of IL-6. Nat. Rev. Cardiol. 18, 58–68 (2021). · DOI
  3. Donato, A. J. et al. Mechanisms of dysfunction in the aging vasculature and role in age-related disease. Circ. Res. 123, 825–848 (2018). · DOI
  4. Saeedi Saravi, S. S. & Feinberg, M. W. Can removal of zombie cells revitalize the aging cardiovascular system? Eur. Heart J. 45, 867–869 (2024). · DOI
  5. Allemann, M.S. et al. Targeting redox system for cardiovascular regeneration in aging. Aging Cell 22, e14020 (2023). · DOI
  6. Witkowski, M. et al. Gut microbiota and cardiovascular disease. Circ. Res. 127, 553–570 (2020). · DOI · Paper page
  7. Fromentin, S. et al. Microbiome and metabolome features of the cardiometabolic disease spectrum. Nat. Med. 28, 303–314 (2022). · DOI
  8. Chakaroun, R. M. et al. The potential of tailoring the gut microbiome to prevent and treat cardiometabolic disease. Nat. Rev. Cardiol. 20, 217–235 (2023). · DOI
  9. Zhu, Y. et al. Two distinct gut microbial pathways contribute to meta-organismal production of phenylacetylglutamine with links to cardiovascular disease. Cell Host. Microbe 31, 18–32 (2023). · DOI
  10. Poesen, R. et al. Microbiota-derived phenylacetylglutamine associates with overall mortality and cardiovascular disease in patients with CKD. J. Am. Soc. Nephrol. 27, 3479–3487 (2016). · DOI
  11. Romano, K. A. et al. Gut microbiota-generated phenylacetylglutamine and heart failure. Circ. Heart Fail. 16, e009972 (2023). · DOI
  12. Morita, M. et al. Phenylacetic acid stimulates reactive oxygen species generation and tumor necrosis factor-α secretion in vascular endothelial cells. Ther. Apher. Dial. 15, 147–150 (2011). · DOI
  13. van der Hee, B. & Wells, J. M. Microbial regulation of host physiology by short-chain fatty acids. Trends Microbiol. 29, 700–712 (2021). · DOI
  14. Saeedi Saravi, S. S. et al. Dietary omega-3 fatty acid suppresses age-associated thrombotic potential via gut microbiota modulation. iScience. 24, 102897 (2021). · DOI
  15. Kalucka, J. et al. Quiescent endothelial cells upregulate fatty acid β-oxidation for vasculoprotection via redox homeostasis. Cell Metab. 28, 881–894 (2018). · DOI
  16. Nemet, I. et al. A cardiovascular disease-linked gut microbial metabolite acts via adrenergic receptors. Cell. 180, 862–877 (2020). · DOI · Paper page
  17. Luo, Y. et al. Predicted visceral adiposity index in relation to risk of coronary heart disease and all-cause mortality: insights from NHANES. Front. Endocrinol. 14, 1296398 (2024). · DOI
  18. Wiley, C. D. & Campisi, J. The metabolic roots of senescence: mechanisms and opportunities for intervention. Nat. Metab. 3, 1290–1301 (2021). · DOI · Paper page
  19. Wu, Y. et al. Phosphoglycerate dehydrogenase activates PKM2 to phosphorylate histone H3T11 and attenuate cellular senescence. Nat. Commun. 14, 1323 (2023). · DOI
  20. Lee, Y. et al. Histone deacetylase 4 reverses cellular senescence via DDIT4 in dermal fibroblasts. Aging. 14, 4653–4672 (2022). · DOI
  21. Schader, T. et al. Oxidation of HDAC4 by Nox4-derived H2O2 maintains tube formation by endothelial cells. Redox Biol. 36, 101669 (2020). · DOI
  22. Saeedi Saravi, S. S. et al. Differential endothelial signaling responses elicited by chemogenetic H2O2 synthesis. Redox Biol. 36, 101605 (2020). · DOI
  23. Yang, D. et al. HDAC4 regulates vascular inflammation via activation of autophagy. Cardiovasc. Res. 114, 1016–1028 (2018). · DOI
  24. Yang, H. et al. Gut microbial-derived phenylacetylglutamine accelerates host cellular senescence. Nat. Aging. 5, 401–418 (2025). · DOI · Paper page
  25. Nemet, I. et al. Atlas of gut microbe-derived products from aromatic amino acids and risk of cardiovascular morbidity and mortality. Eur. Heart J. 44, 3085–3096 (2023). · DOI
  26. Roos, C. M. et al. Chronic senolytic treatment alleviates established vasomotor dysfunction in aged or atherosclerotic mice. Aging Cell 15, 973–977 (2016). · DOI · Paper page
  27. Childs, B. G. et al. Senescent intimal foam cells are deleterious at all stages of atherosclerosis. Science 354, 472–477 (2016). · DOI · Paper page
  28. Jiang, H. et al. Mechanisms of oxidized LDL-mediated endothelial dysfunction and its consequences for the development of atherosclerosis. Front. Cardiovasc. Med. 9, 925923 (2022). · DOI
  29. O’Brien, B. J. et al. CaMKIIδ is upregulated by pro-inflammatory cytokine IL-6 in a JAK/STAT3-dependent manner to promote angiogenesis. FASEB J. 35, e21437 (2021). · DOI
  30. Fukumura, D. et al. Predominant role of endothelial nitric oxide synthase in vascular endothelial growth factor-induced angiogenesis and vascular permeability. Proc. Natl Acad. Sci. USA. 98, 2604–2609 (2001). · DOI
  31. Chen, X. et al. Therapeutic angiogenesis and tissue revascularization in ischemic vascular disease. J. Biol. Eng. 17, 13 (2023). · DOI
  32. Lindquist, A. et al. Oral supplementation with the short-chain fatty acid acetate ameliorates age-related aortic stiffening in mice. Physiology 38, S1.5732615 (2023). · DOI
  33. Poll, B. G. et al. Acetate, a short-chain fatty acid, acutely lowers heart rate and cardiac contractility along with blood pressure. J. Pharmacol. Exp. Toxicol. 377, 39–50 (2021).
  34. van Soest, D. M. K. et al. Mitochondrial H2O2 release does not directly cause damage to chromosomal DNA. Nat. Commun. 15, 2725 (2024). · DOI
  35. Adeyemi, D. H. et al. Sodium acetate ameliorates doxorubicin-induced cardiac injury via upregulation of Nrf2/HO-1 signaling and downregulation of NFκB-mediated apoptotic signaling in Wistar rats. Naunyn Schmiedebergs Arch. Pharmacol. 397, 423–435 (2024). · DOI
  36. Kuosmanen, S. M. et al. MicroRNAs mediate the senescence-associated decline of NRF2 in endothelial cells. Redox Biol. 18, 77–83 (2018). · DOI
  37. Kubben, N. et al. Repression of the antioxidant NRF2 pathway in premature aging. Cell 165, 1361–1374 (2016). · DOI · Paper page
  38. Li, J. et al. Targeting the Nrf2 pathway against cardiovascular disease. Expert Opin. Ther. Targets 13, 785–794 (2009). · DOI
  39. Lewis, K. N. et al. Regulation of Nrf2 signaling and longevity in naturally long-lived rodents. Proc. Natl Acad. Sci. USA 112, 3722–3727 (2015). · DOI
  40. Sykiotis, G. P. et al. The role of the antioxidant and longevity-promoting Nrf2 pathway in metabolic regulation. Curr. Opin. Clin. Nutr. Metab. Care 14, 41–48 (2011). · DOI
  41. Ungavri, Z. et al. Resveratrol confers endothelial protection via activation of the antioxidant transcription factor Nrf2. Am. J. Physiol. Heart Circ. Physiol. 299, H18–H24 (2010). · DOI
  42. Kane, A. E. & Sinclair, D. A. Sirtuins and NAD+ in the development and treatment of metabolic and cardiovascular diseases. Circ. Res. 123, 868–885 (2018). · DOI
  43. Martens, C. R. et al. Chronic nicotinamide riboside supplementation is well-tolerated and elevates NAD+ in healthy middle-aged and older adults. Nat. Commun. 9, 1286 (2018). · DOI · Paper page
  44. Thevaranjan, N. et al. Age-associated microbial dysbiosis promotes intestinal permeability, systemic inflammation, and macrophage dysfunction. Cell Host Microbe 21, 455–466 (2017). · DOI · Paper page
  45. Kulkarni, A. S. et al. Benefits of metformin in attenuating the hallmarks of aging. Cell Metab. 32, 15–30 (2020). · DOI · Paper page
  46. Le Pelletier, L. et al. Metformin alleviates stress-induced cellular senescence of aging human adipose stromal cells and the ensuing adipocyte dysfunction. eLife 10, e62635 (2021). · DOI
  47. Grootaert, M. O. J. Cell senescence in cardiometabolic diseases. NPJ Aging 10, 46 (2024). · DOI
  48. Moslehi, J. et al. Telomeres and mitochondria in the aging heart. Circ. Res. 110, 1226–1237 (2012). · DOI
  49. Xia, L. et al. Resveratrol reduces endothelial progenitor cells senescence through augmentation of telomerase activity by Akt-dependent mechanisms. Br. J. Pharmacol. 155, 387–394 (2008). · DOI
  50. Csiszar, A. et al. Age-associated proinflammatory secretory phenotype in vascular smooth muscle cells from the non-human primate Macaca mulatta: reversal by resveratrol treatment. J. Gerontol. A Biol. Sci. Med. Sci. 67, 811–820 (2012). · DOI
  51. Wood, D. E. et al. Improved metagenomic analysis with Kraken 2. Genome Biol. 20, 257 (2019). · DOI
  52. Keiser, S. et al. Comprehensive mouse microbiota genome catalog reveals major difference to its human counterpart. PLoS Comput. Biol. 18, e1009947 (2022). · DOI
  53. Visconti, A. et al. Interplay between the human gut microbiome and host metabolism. Nat. Commun. 10, 4505 (2019). · DOI · Paper page
  54. Shabanian, K. et al. AQP1 differentially orchestrates endothelial cell senescence. Redox Biol. 76, 103317 (2024). · DOI
  55. Eroglu, E. et al. Discordance between eNOS phosphorylation and activation revealed by multispectral imaging and chemogenetic methods. Proc. Natl Acad. Sci. USA 116, 20210–20217 (2019). · DOI
  56. Spyropoulos, F. et al. Metabolomic and transcriptomic signatures of chemogenetic heart failure. Am. J. Physiol. Heart Circ. Physiol. 322, H451–H465 (2021). · DOI
  57. Sorrentino, A. et al. Reversal of heart failure in a chemogenetic model of persistent cardiac redox stress. Am. J. Physiol. Heart Circ. Physiol. 317, H617–H626 (2019). · DOI
  58. Saeedi Saravi, S. S. et al. Long-term dietary n3 fatty acid prevents aging-related cardiac diastolic and vascular dysfunction. Vasc. Pharmacol. 150, 107175 (2023). · DOI

Cited by

Sorted by citations

See all 68

Metadata

Authors
Saeedi Saravi, S. S., Pugin, B., Constancias, F., Shabanian, K., Spalinger, M., Thomas, A., Le Gludic, S., Shabanian, T., Karsai, G., Colucci, M., Menni, C., Attaye, I., Zhang, X., Allemann, M. S., Lee, P., Visconti, A., Falchi, M., Alimonti, A., Ruschitzka, F., Paneni, F., & Beer, J. H.
Venue
Nature Aging
Published
2025-05-12
Volume
5
Issue
6
Pages
1025-1045
ISSN
2662-8465
Cited by
68
References
12
Language
en
Funders
  • Schweizerischer Nationalfonds zur Förderung der Wissenschaftlichen Forschung (#310030_21A053, #CRSK-3_229134)
  • Schweizerische Herzstiftung
  • Novartis Stiftung für Medizinisch-Biologische Forschung (#21A053)

About these checks

Registry, retraction, Cites and statistics results are computed, not judged, with one exception: a printed reference that no index lists is read once by a model before it counts as a citation error. Claims are extracted by a model and kept only when their quote appears verbatim in the text; each cited source is then checked, with a model’s help, for whether it says what the claim relies on. Those verdicts can be wrong — read the claim’s quote and the cited source before relying on one.

Statistics and arithmetic are recomputed, not judged.

Confidence bands are shown only for fields calibrated on our annotated test set. None is calibrated yet, so no band is shown.

What counts as a claim ›How we measure confidence ›How we check this ›

Are you an author, or do you see a problem with this page? Request a review