

The DOI matches its Crossref record; 58 of the 58 references it cites were found in a registry or an index.
FGF19 and its analog Aldafermin cooperate with MYC to induce aggressive hepatocarcinogenesis
Open accessPublished version of a preprint
Abstract
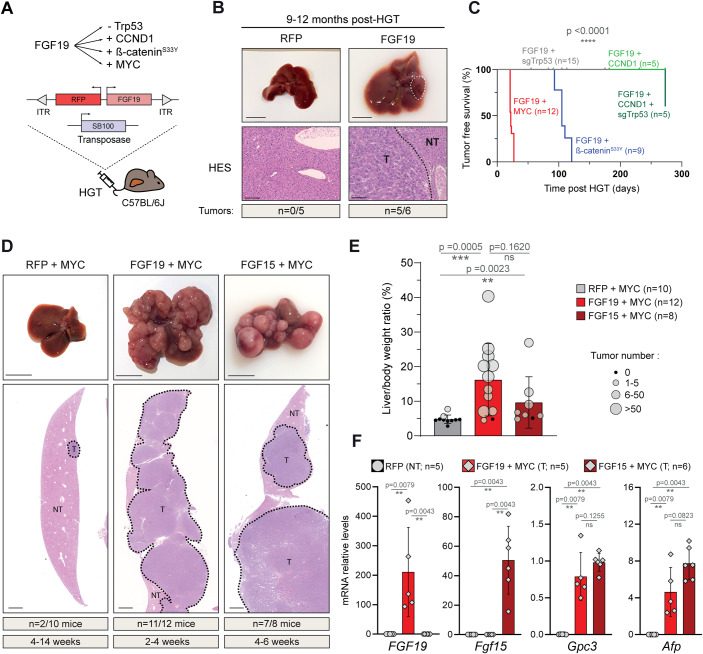
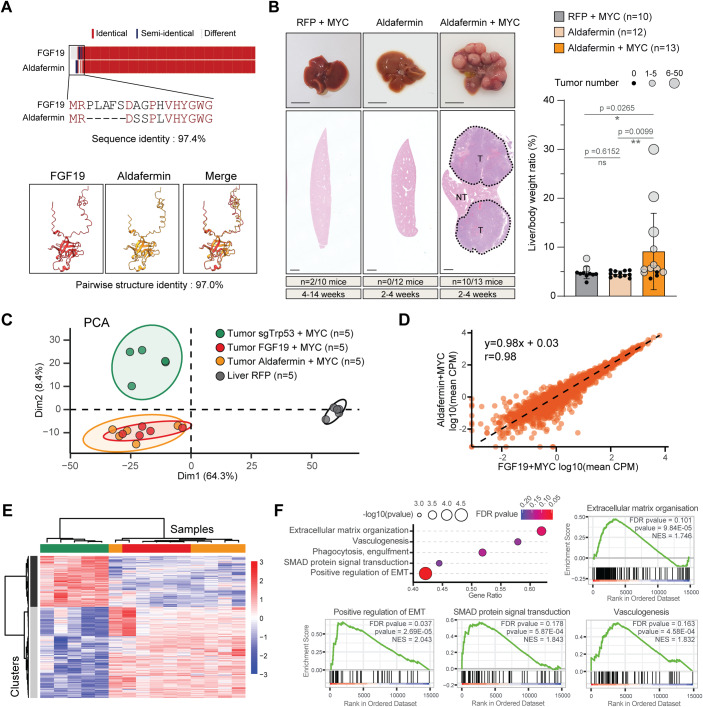
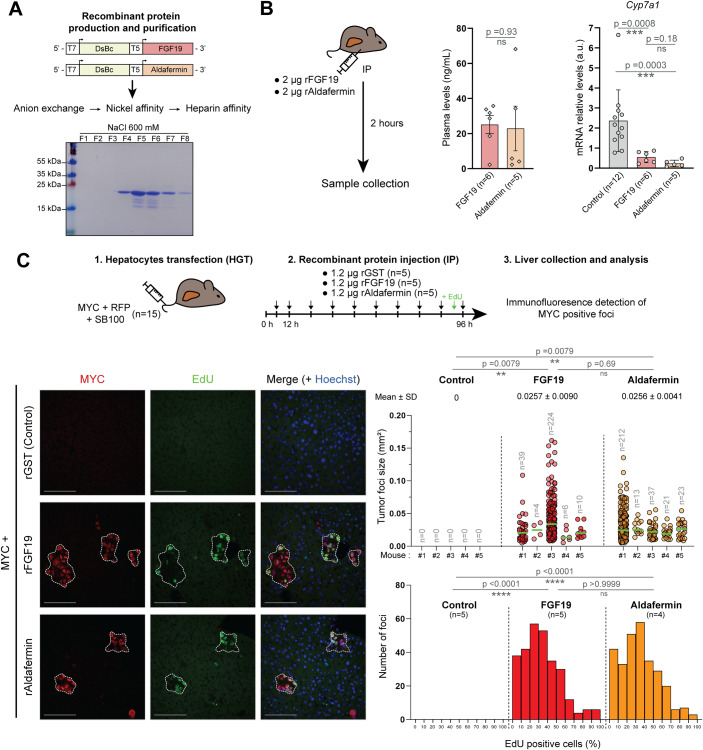
FGF19 hormone has pleiotropic metabolic functions, including the modulation of insulin sensitivity, glucose/lipid metabolism and energy homeostasis. On top of its physiological metabolic role, FGF19 has been identified as a potentially targetable oncogenic driver, notably in hepatocellular carcinoma (HCC). Nevertheless, FGF19 remained an attractive candidate for treatment of metabolic disease, prompting the development of analogs uncoupling its metabolic and tumor-promoting activities. Using pre-clinical mice models of somatic mutation driven HCC, we assessed the oncogenicity of FGF19 in combination with frequent HCC tumorigenic alterations: p53 inactivation, CTNNB1 mutation, CCND1 or MYC overexpression. Our data revealed a strong oncogenic cooperation between FGF19 and MYC. Most importantly, we show that this oncogenic synergy is conserved with a FGF19-analog Aldafermin (NGM282), designed to solely mimic the hormone’s metabolic functions. In particular, even a short systemic treatment with recombinant proteins triggered rapid appearance of proliferative foci of MYC-expressing hepatocytes. The fact that FGF19 analog Aldafermin is not fully devoid of the hormone’s oncogenic properties raises concerns in the context of its potential use for patients with damaged, mutation-prone liver.
Overview
The claims and statistics of this paper haven’t been checked yet.
Run the check — free, no account needed. It reads the open-access text and checks the sources it cites.
Integrity signals
Registry
Cites
Statistics
Figures
Verification
Claims the paper makes
The claims and statistics of this paper haven’t been checked yet.
Run the check — free, no account needed. It reads the open-access text and checks the sources it cites.
Self-check
Percentages, sums and reported differences re-computed from the paper’s own numbers.
The self-check needs the paper’s full text.
Citations
Cites
Highly accurate protein structure prediction with AlphaFold
Jumper, J., Evans, R., Pritzel, A., Green, T., Figurnov, M., Ronneberger, O., Tunyasuvunakool, K., Bates, R., Žídek, A., Potapenko, A., et al. (2021) · Nature · doi:10.1038/s41586-021-03819-2 · Cited by 43,764
Robinson, M. D., McCarthy, D. J., & Smyth, G. K. (2010) · Bioinformatics · doi:10.1093/bioinformatics/btp616 · Cited by 41,364
UCSF ChimeraX : Structure visualization for researchers, educators, and developers
Pettersen, E. F., Goddard, T. D., Huang, C. C., Meng, E. C., Couch, G. S., Croll, T. I., Morris, J. H., & Ferrin, T. E. (2020) · Protein Science · doi:10.1002/pro.3943 · Cited by 9,521
QuPath: Open source software for digital pathology image analysis
Bankhead, P., Loughrey, M. B., Fernández, J. A., Dombrowski, Y., McArt, D. G., Dunne, P. D., McQuaid, S., Gray, R. T., Murray, L. J., Coleman, H. G., et al. (2017) · Scientific Reports · doi:10.1038/s41598-017-17204-5 · Cited by 8,908
In situ click chemistry generation of cyclooxygenase-2 inhibitors
Bhardwaj, A., Kaur, J., Wuest, M., & Wuest, F. (2017) · Nature Communications · doi:10.1038/s41467-016-0009-6 · Cited by 7,448
Comprehensive and Integrative Genomic Characterization of Hepatocellular Carcinoma
Ally, A., Balasundaram, M., Carlsen, R., Chuah, E., Clarke, A., Dhalla, N., Holt, R. A., Jones, S. J. M., Lee, D., Ma, Y., et al. (2017) · Cell · doi:10.1016/j.cell.2017.05.046 · Cited by 2,490
The Fibroblast Growth Factor signaling pathway
Ornitz, D. M., & Itoh, N. (2015) · WIREs Developmental Biology · doi:10.1002/wdev.176 · Cited by 2,050 · cited 1×
“…to its receptor FGFR4 and co-receptor β -Klotho (KLB) has been reported to activate several major signal transduction pathways, such as Ras/MAPK, Akt, Mst1/2 and β -catenin signaling, which are all implicated in hepatic carcinogenesis (Chen et al, 2020; Ornitz and Itoh, 2015; Ji et al, 2019).”
Schulze, K., Imbeaud, S., Letouzé, E., Alexandrov, L. B., Calderaro, J., Rebouissou, S., Couchy, G., Meiller, C., Shinde, J., Soysouvanh, F., et al. (2015) · Nature Genetics · doi:10.1038/ng.3252 · Cited by 1,803
Hydrodynamics-based transfection in animals by systemic administration of plasmid DNA
Liu, F., Song, Y. K., & Liu, D. (1999) · Gene Therapy · doi:10.1038/sj.gt.3300947 · Cited by 1,728
Three-dimensional Epigenome Statistical Model: Genome-wide Chromatin Looping Prediction
Bkhetan, Z. A., & Plewczyński, D. (2018) · Scientific Reports · doi:10.1038/s41598-018-23276-8 · Cited by 1,672
Guichard, C., Amaddeo, G., Imbeaud, S., Ladeiro, Y., Pelletier, L., Benmaad, I., Caldéraro, J., Bioulac‐Sage, P., Letexier, M., Degos, F., et al. (2012) · Nature Genetics · doi:10.1038/ng.2256 · Cited by 1,522
Genetic landscape and biomarkers of hepatocellular carcinoma
Zucman-Rossi, J., Villanueva, A., Nault, J.-C., & Llovet, J. M. (2015) · Gastroenterology · doi:10.1053/j.gastro.2015.05.061 · Cited by 1,325
Sikweyiya, Y. M., & Jewkes, R. K. (2012) · PLoS ONE · doi:10.1371/journal.pone.0035495 · Cited by 1,320
Zhang, G., Budker, V. G., & Wolff, J. A. (1999) · Human Gene Therapy · doi:10.1089/10430349950017734 · Cited by 946
Flexible structure alignment by chaining aligned fragment pairs allowing twists
Ye, Y., & Godzik, A. (2003) · Bioinformatics · doi:10.1093/bioinformatics/btg1086 · Cited by 615
Advances in molecular classification and precision oncology in hepatocellular carcinoma
Rebouissou, S., & Nault, J. (2020) · Journal of Hepatology · doi:10.1016/j.jhep.2019.08.017 · Cited by 603
Sawey, E. T., Chanrion, M., Cai, C., Wu, G., Zhang, J., Zender, L., Zhao, A. S., Busuttil, R. W., Yee, H. T., Stein, L. D., et al. (2011) · Cancer Cell · doi:10.1016/j.ccr.2011.01.040 · Cited by 437
Harrison, S. A., Rinella, M. E., Abdelmalek, M. F., Trotter, J. F., Paredes, A. H., Arnold, H. L., Kugelmas, M., Bashir, M. R., Jaros, M. J., Ling, L., et al. (2018) · The Lancet · doi:10.1016/s0140-6736(18)30474-4 · Cited by 425
Therapeutic potential of the endocrine fibroblast growth factors FGF19, FGF21 and FGF23
Degirolamo, C., Sabbà, C., & Moschetta, A. (2016) · Nature Reviews Drug Discovery · doi:10.1038/nrd.2015.9 · Cited by 424 · cited 1×
“A single injection led to circulating levels of around 20 ng/mL after 2 h, in accordance with the reported short half-life of the hormone (Degirolamo et al, 2016).”
Ahn, S., Jang, S. J., Shim, J. H., Kim, D., Hong, S., Sung, C. O., Baek, D., Haq, F., Ansari, A. A., Lee, S. Y., et al. (2014) · Hepatology · doi:10.1002/hep.27198 · Cited by 424
A Mouse Model of Hepatocellular Carcinoma
Nicholes, K., Guillet, S., Tomlinson, E., Hillan, K., Wright, B., Frantz, G. D., Pham, T. A., Dillard-Telm, L., Tsai, S. P., Stephan, J.-P., et al. (2002) · The American Journal of Pathology · doi:10.1016/s0002-9440(10)61177-7 · Cited by 359
Hagel, M., Miduturu, C., Sheets, M. P., Rubin, N. T., Weng, W., Stransky, N., Bifulco, N., Kim, J. L., Hodous, B. L., Brooijmans, N., et al. (2015) · Cancer Discovery · doi:10.1158/2159-8290.cd-14-1029 · Cited by 325
Tissue-specific actions of the metabolic hormones FGF15/19 and FGF21
Owen, B. M., Mangelsdorf, D. J., & Kliewer, S. A. (2015) · Trends in Endocrinology & Metabolism · doi:10.1016/j.tem.2014.10.002 · Cited by 286
Kim, R. D., Sarker, D., Meyer, T., Yau, T. C. C., Macarulla, T. M., Park, J., Choo, S. P., Hollebecque, A., Sung, M. W., Lim, H.-Y., et al. (2019) · Cancer Discovery · doi:10.1158/2159-8290.cd-19-0555 · Cited by 276
Harrison, S. A., Rossi, S. J., Paredes, A. H., Trotter, J. F., Bashir, M. R., Guy, C. D., Banerjee, R., Jaros, M. J., Owers, S., Baxter, B. A., et al. (2020) · Hepatology · doi:10.1002/hep.30590 · Cited by 262
Lan, T., Morgan, D. A., Rahmouni, K., Sonoda, J., Fu, X., Burgess, S. C., Holland, W. L., Kliewer, S. A., & Mangelsdorf, D. J. (2017) · Cell Metabolism · doi:10.1016/j.cmet.2017.09.005 · Cited by 261
Pinyol, R., Torrecilla, S., Wang, H., Montironi, C., Piqué‐Gili, M., Torres‐Martín, M., Leow, W. Q., Willoughby, C. E., Ramadori, P., Andreu-Oller, C., et al. (2021) · Journal of Hepatology · doi:10.1016/j.jhep.2021.04.049 · Cited by 261
Targeting FGFR4 Inhibits Hepatocellular Carcinoma in Preclinical Mouse Models
French, D., Lin, B. C., Wang, M.-T., Adams, C. W., Shek, T., Hötzel, K., Bolon, B., Ferrando, R., Blackmore, C., Schroeder, K., et al. (2012) · PLoS ONE · doi:10.1371/journal.pone.0036713 · Cited by 216
Miura, S., Mitsuhashi, N., Shimizu, H., Kimura, F., Yoshidome, H., Otsuka, M., Kato, A., Shida, T., Okamura, D., & Miyazaki, M. (2012) · BMC Cancer · doi:10.1186/1471-2407-12-56 · Cited by 193
Central Role of c-Myc during Malignant Conversion in Human Hepatocarcinogenesis
Kaposi-Novák, P., Libbrecht, L. J., Woo, H. G., Lee, Y., Sears, N. C., Conner, E. A., Factor, V. M., Roskams, T., & Thorgeirsson, S. S. (2009) · Cancer Research · doi:10.1158/0008-5472.can-08-3357 · Cited by 188
Hirschfield, G. M., Chazouillères, O., Drenth, J. P., Thorburn, D., Harrison, S. A., Landis, C. S., Mayo, M. J., Muir, A. J., Trotter, J. F., Leeming, D. J., et al. (2019) · Journal of Hepatology · doi:10.1016/j.jhep.2018.10.035 · Cited by 187
FGF19-induced Hepatocyte Proliferation Is Mediated through FGFR4 Activation
Wu, X., Ge, H., Lemon, B., Vonderfecht, S., Weiszmann, J., Hecht, R., Gupte, J., Hager, T., Wang, Z.-L., Lindberg, R., et al. (2009) · Journal of Biological Chemistry · doi:10.1074/jbc.m109.068783 · Cited by 186
Separating Tumorigenicity from Bile Acid Regulatory Activity for Endocrine Hormone FGF19
Zhou, M., Wang, X., Phung, V., Lindhout, D. A., Mondal, K., Hsu, J.-Y., Yang, H., Humphrey, M., Ding, X., Arora, T., et al. (2014) · Cancer Research · doi:10.1158/0008-5472.can-14-0208 · Cited by 183
Marcelin, G., Jo, Y., Li, X., Schwartz, G. J., Zhang, Y., Dun, N. J., Lyu, R., Blouet, C., Chang, J. K., & Chua, S. C. (2013) · Molecular Metabolism · doi:10.1016/j.molmet.2013.10.002 · Cited by 168
Zhou, M., Learned, R. M., Rossi, S. J., DePaoli, A. M., Tian, H., & Ling, L. (2017) · Hepatology Communications · doi:10.1002/hep4.1108 · Cited by 152
Harrison, S. A., Abdelmalek, M. F., Neff, G., Gunn, N., Guy, C. D., Alkhouri, N., Bashir, M. R., Freilich, B., Kohli, A., Khazanchi, A., et al. (2022) · The Lancet. Gastroenterology & hepatology · doi:10.1016/s2468-1253(22)00017-6 · Cited by 148
Metabolic Messengers: fibroblast growth factor 15/19
Gadaleta, R. M., & Moschetta, A. (2019) · Nature Metabolism · doi:10.1038/s42255-019-0074-3 · Cited by 138
Mayo, M. J., Wigg, A. J., Leggett, B. A., Arnold, H., Thompson, A. J., Weltman, M., Carey, E. J., Muir, A. J., Ling, L., Rossi, S. J., et al. (2018) · Hepatology Communications · doi:10.1002/hep4.1209 · Cited by 125
Non-cell-autonomous activation of IL-6/STAT3 signaling mediates FGF19-driven hepatocarcinogenesis
Zhou, M., Yang, H., Learned, R. M., Tian, H., & Ling, L. (2017) · Nature Communications · doi:10.1038/ncomms15433 · Cited by 123
Molina-Sánchez, P., Ruiz de Galarreta, M., Yao, M. A., Lindblad, K. E., Bresnahan, E., Bitterman, E., Martin, T. C., Rubenstein, T., Nie, K., Golas, J., et al. (2020) · Gastroenterology · doi:10.1053/j.gastro.2020.08.015 · Cited by 117
FGF15 Activates Hippo Signaling to Suppress Bile Acid Metabolism and Liver Tumorigenesis
Ji, S., Liu, Q., Zhang, S., Chen, Q., Wang, C., Zhang, W., Chen, X., Li, Y., Nian, C., Li, J., et al. (2019) · Developmental Cell · doi:10.1016/j.devcel.2018.12.021 · Cited by 106
Mouse species-specific control of hepatocarcinogenesis and metabolism by FGF19/FGF15
Zhou, M., Luo, J., Chen, M., Yang, H., Learned, R. M., DePaoli, A. M., Tian, H., & Ling, L. (2017) · Journal of Hepatology · doi:10.1016/j.jhep.2017.01.027 · Cited by 102
Rinella, M. E., Lieu, H. D., Kowdley, K. V., Goodman, Z. D., Alkhouri, N., Lawitz, E., Ratziu, V., Abdelmalek, M. F., Wong, V. W., Younes, Z. H., et al. (2023) · Hepatology · doi:10.1097/hep.0000000000000607 · Cited by 99
Ileal FGF 15 contributes to fibrosis‐associated hepatocellular carcinoma development
Uriarte, I., Latasa, M. U., Carotti, S., Fernández‐Barrena, M. G., García‐Irigoyen, O., Elizalde, M., Urtasun, R., Gentilucci, U. V., Morini, S., Pulido, Á. D. M., et al. (2014) · International Journal of Cancer · doi:10.1002/ijc.29287 · Cited by 88
Gao, L., Lang, L., Zhao, X., Shay, C., Shull, A. Y., & Teng, Y. (2018) · Oncogene · doi:10.1038/s41388-018-0591-7 · Cited by 80
Wang, Z., Zhu, S., Jia, Y., Wang, Y., Kubota, N., Fujiwara, N., Gordillo, R., Lewis, C., Zhu, M., Sharma, T., et al. (2023) · Cell · doi:10.1016/j.cell.2023.03.014 · Cited by 72
Jin, L., Yang, R., Geng, L., & Xu, A. (2023) · Annual Review of Pharmacology and Toxicology · doi:10.1146/annurev-pharmtox-032322-093904 · Cited by 71
DePaoli, A. M., Zhou, M., Kaplan, D. D., Hunt, S. C., Adams, T. D., Learned, R. M., Tian, H., & Ling, L. (2019) · Diabetes · doi:10.2337/db18-1305 · Cited by 65
Gadaleta, R. M., Scialpi, N., Peres, C. M., Cariello, M., Ko, B., Luo, J., Porru, E., Roda, A., Sabbà, C., & Moschetta, A. (2018) · Scientific Reports · doi:10.1038/s41598-018-35496-z · Cited by 54
Chen, J., Du, F., Dang, Y., Li, X., Qian, M., Feng, W., Qiao, C., Fan, D., Nie, Y., Wu, K., et al. (2019) · Hepatology · doi:10.1002/hep.30951 · Cited by 52
Kang, H. J., Haq, F. U., Sung, C. O., Choi, J., Hong, S., Eo, S., Jeong, H. J., Shin, J., Shim, J. H., Lee, H. C., et al. (2018) · Liver Cancer · doi:10.1159/000488541 · Cited by 38
FGFR redundancy limits the efficacy of FGFR4-selective inhibitors in hepatocellular carcinoma
Tao, Z., Cui, Y., Xu, X., & Han, T. (2022) · Proceedings of the National Academy of Sciences · doi:10.1073/pnas.2208844119 · Cited by 32
BouSaba, J., Torres, M., Dilmaghani, S., Harmsen, W. S., Ling, L., & Camilleri, M. (2023) · Gastroenterology · doi:10.1053/j.gastro.2023.04.007 · Cited by 21
Choi, H., Cheong, D., Yoo, S., Park, J., Lee, D.-H., & Kim, G. (2020) · Microorganisms · doi:10.3390/microorganisms8121942 · Cited by 6
Fibroblast growth factor 19 stimulates water intake
Bedoya, J. U., Chavey, C., Desandré, G., Meunier, L., Dupuy, A., Dopeso‐Reyes, I. G., Tordjmann, T., Assénat, E., Hibner, U., & Grégoire, D. (2022) · Molecular Metabolism · doi:10.1016/j.molmet.2022.101483 · Cited by 5
Self-citationOne-step metal affinity purification of recombinant hFGF19 without using tags.
Choi, H.-J., Cheong, D., Yoo, S.-K., & Kim, G.-J. (2022) · Protein Expression and Purification · doi:10.1016/j.pep.2022.106186 · Cited by 5
CDK8 and CDK19 kinases have non-redundant oncogenic functions in hepatocellular carcinomaPreprint
Bacevic, K., Prieto, S., Caruso, S., Camasses, A., Dubra, G., Ursic-Bedoya, J., Lozano, A., Butterworth, J. A., Zucman-Rossi, J., Hibner, U., et al. (2019) · bioRxiv · doi:10.1101/789586 · Cited by 4
Self-citationFerket, B. S., Hunink, M. G. M., Masharani, U. B., Max, W. B., & Fleischmann, K. E. (2019) · Diabetes · doi:10.2337/db19-1315-p · Cited by 3
Research works printed but not linked: 1
- Zhou M, Wang X, Phung V, Lindhout DA, Mondal K, Hsu JY, Yang H, Humphrey M, Ding X, Arora T et al (2014b) Separating tumorigenicity from bile acid regulatory activity for endocrine hormone FGF19. Cancer Res 74:3306–3316 · DOI · Paper page
Cited by
Sorted by citations
FGF-based drug discovery: advances and challenges
Chen, G., Chen, L., Li, X., & Mohammadi, M. (2025) · Nature Reviews Drug Discovery · doi:10.1038/s41573-024-01125-w · Cited by 51
Potential therapeutic strategies for MASH: from preclinical to clinical development
Xie, Z., Li, Y., Cheng, L., Huang, Y., Rao, W., Shi, H., & Li, J. (2024) · Life Metabolism · doi:10.1093/lifemeta/loae029 · Cited by 31
The role of FGF19 in metabolic regulation: insights from preclinical models to clinical trials
de Carvalho, M. B., Jorge, G. M. C. P., Zanardo, L. W., Hamada, L. M., Izabel, L. D. S., Santoro, S., & Magdalon, J. (2024) · American Journal of Physiology-Endocrinology and Metabolism · doi:10.1152/ajpendo.00156.2024 · Cited by 23
López-Pascual, A., Russo-Cabrera, J. S., Ardaiz, N., Palmer, T., Graham, A.-R., Uriarte, I., Gomar, C., Ruiz-Guillamon, D., Latasa, M. U., Arechederra, M., et al. (2024) · Clinical Science · doi:10.1042/cs20241137 · Cited by 14
Identification and characterization of eccDNA-driven genes in humans
Gu, Y., Song, Y., & Liu, J. (2025) · PLoS ONE · doi:10.1371/journal.pone.0324438 · Cited by 7
Metadata
- Authors
- Ursic-Bedoya, J., Desandré, G., Chavey, C., Marie, P., Polizzi, A., Rivière, B., Guillou, H., Assenat, E., Hibner, U., & Gregoire, D.
- Affiliations
- Centre National de la Recherche Scientifique (FR)
- Université Toulouse III - Paul Sabatier (FR)
- Université de Montpellier (FR)
- Corresponding author
- Desandré, Guillaume
- ORCID
- Venue
- EMBO Molecular Medicine
- Published
- 2024-01-16
- Volume
- 16
- Issue
- 2
- Pages
- 238-250
- ISSN
- 1757-4676 (ISSN-L)
- 1757-4684
- PMC
- PMC10897482
- OpenAlex
- W4390904460
- Cited by
- 11
- References
- 58
- Citations by year
- 2026: 5 · 2025: 3 · 2024: 3
- FWCI
- 1.50
- Type
- journal article
- Language
- en
- Open access
- gold
- doi.org
- Locations
- EMBO Molecular Medicine (publishedVersion, cc-by)
- bioRxiv (Cold Spring Harbor Laboratory) (acceptedVersion, cc-by-nc-nd)
- PubMed Central (publishedVersion, cc-by)
- PubMed (publishedVersion)
- HAL (submittedVersion, cc-by-nc-nd)
- HAL (submittedVersion, cc-by-nc-sa)
- DOAJ (DOAJ: Directory of Open Access Journals) (submittedVersion, cc-by-sa)
- Funders
- Association Française pour l'Etude du Foie (AAP_2021)
- SIRIC Montpellier (Cancer Grant INCa_Inserm_DGOS_12553)
- Fondation ARC pour la Recherche sur le Cancer (2019)
- Institut National Du Cancer (2019-134)
- ITMO Cancer (EVA-Plan cancer INSERM HTE-201610)
- Topics
- Life Sciences › Biochemistry, Genetics and Molecular Biology › Molecular Biology › Fibroblast Growth Factor Research
- Health Sciences › Medicine › Hepatology › Hepatocellular Carcinoma Treatment and Prognosis
- Health Sciences › Medicine › Hepatology › Liver physiology and pathology
- Keywords
- FGF19, c-Myc, hepatocellular carcinoma, hepatocarcinogenesis, oncogene cooperation, p53 inactivation, CTNNB1 mutation, hepatocyte proliferation, drug safety concerns
- MeSH terms
- Animals, Fibroblast Growth Factors, Carcinoma, Hepatocellular, Hormones, Humans, Liver Neoplasms, Mice
About these checks
Registry, retraction, Cites and statistics results are computed, not judged, with one exception: a printed reference that no index lists is read once by a model before it counts as a citation error. Claims are extracted by a model and kept only when their quote appears verbatim in the text; each cited source is then checked, with a model’s help, for whether it says what the claim relies on. Those verdicts can be wrong — read the claim’s quote and the cited source before relying on one.
Statistics and arithmetic are recomputed, not judged.
Confidence bands are shown only for fields calibrated on our annotated test set. None is calibrated yet, so no band is shown.
What counts as a claim ›How we measure confidence ›How we check this ›
Are you an author, or do you see a problem with this page? Request a review
